- Release Notes and Announcements
- Release Notes
- Announcements
- Security Vulnerability Fix Description
- Discontinuing Update of NginxIngress Addon
- qGPU Service Adjustment
- Version Upgrade of Master Add-On of TKE Managed Cluster
- Upgrading tke-monitor-agent
- Discontinuing TKE API 2.0
- Instructions on Cluster Resource Quota Adjustment
- Decommissioning Kubernetes Version
- Deactivation of Scaling Group Feature
- Notice on TPS Discontinuation on May 16, 2022 at 10:00 (UTC +8)
- Basic Monitoring Architecture Upgrade
- Starting Charging on Managed Clusters
- Instructions on Stopping Delivering the Kubeconfig File to Nodes
- Release Notes
- Product Introduction
- Purchase Guide
- Quick Start
- TKE General Cluster Guide
- TKE General Cluster Overview
- Purchase a TKE General Cluster
- High-risk Operations of Container Service
- Deploying Containerized Applications in the Cloud
- Kubernetes API Operation Guide
- Open Source Components
- Permission Management
- Cluster Management
- Cluster Overview
- Cluster Hosting Modes Introduction
- Cluster Lifecycle
- Creating a Cluster
- Deleting a Cluster
- Cluster Scaling
- Changing the Cluster Operating System
- Connecting to a Cluster
- Upgrading a Cluster
- Enabling IPVS for a Cluster
- Enabling GPU Scheduling for a Cluster
- Custom Kubernetes Component Launch Parameters
- Using KMS for Kubernetes Data Source Encryption
- Images
- Worker node introduction
- Normal Node Management
- Native Node Management
- Overview
- Purchasing Native Nodes
- Lifecycle of a Native Node
- Native Node Parameters
- Creating Native Nodes
- Deleting Native Nodes
- Self-Heal Rules
- Declarative Operation Practice
- Native Node Scaling
- In-place Pod Configuration Adjustment
- Enabling SSH Key Login for a Native Node
- Management Parameters
- Modifying Native Nodes
- Enabling Public Network Access for a Native Node
- FAQs for Native Nodes
- Supernode management
- Registered Node Management
- Memory Compression Instructions
- GPU Share
- Kubernetes Object Management
- Overview
- Namespace
- Workload
- Deployment Management
- StatefulSet Management
- DaemonSet Management
- Job Management
- CronJob Management
- Setting the Resource Limit of Workload
- Setting the Scheduling Rule for a Workload
- Setting the Health Check for a Workload
- Setting the Run Command and Parameter for a Workload
- Using a Container Image in a TCR Enterprise Instance to Create a Workload
- Auto Scaling
- Configuration
- Service Management
- Ingress Management
- Storage Management
- Application and Add-On Feature Management Description
- Add-On Management
- Add-on Overview
- Add-On Lifecycle Management
- CBS-CSI Description
- UserGroupAccessControl
- COS-CSI
- CFS-CSI
- P2P
- OOMGuard
- TCR Introduction
- TCR Hosts Updater
- DNSAutoscaler
- NodeProblemDetectorPlus Add-on
- NodeLocalDNSCache
- Network Policy
- DynamicScheduler
- DeScheduler
- Nginx-ingress
- HPC
- Description of tke-monitor-agent
- GPU-Manager Add-on
- Cluster Autoscaler
- CFSTURBO-CSI
- tke-log-agent
- Helm Application
- Application Market
- Network Management
- Container Network Overview
- GlobalRouter Mode
- VPC-CNI Mode
- VPC-CNI Mode
- Multiple Pods with Shared ENI Mode
- Pods with Exclusive ENI Mode
- Static IP Address Mode Instructions
- Non-static IP Address Mode Instructions
- Interconnection Between VPC-CNI and Other Cloud Resources/IDC Resources
- Security Group of VPC-CNI Mode
- Instructions on Binding an EIP to a Pod
- VPC-CNI Component Description
- Limits on the Number of Pods in VPC-CNI Mode
- Cilium-Overlay Mode
- OPS Center
- Log Management
- Backup Center
- Cloud Native Monitoring
- Remote Terminals
- Policy Management
- TKE Serverless Cluster Guide
- TKE Edge Cluster Guide
- TKE Registered Cluster Guide
- Cloud Native Service Guide
- Practical Tutorial
- Cluster
- Cluster Migration
- Serverless Cluster
- Edge Cluster
- Security
- Service Deployment
- Hybrid Cloud
- Network
- DNS
- Using Network Policy for Network Access Control
- Deploying NGINX Ingress on TKE
- Nginx Ingress High-Concurrency Practices
- Nginx Ingress Best Practices
- Limiting the bandwidth on pods in TKE
- Directly connecting TKE to the CLB of pods based on the ENI
- Use CLB-Pod Direct Connection on TKE
- Obtaining the Real Client Source IP in TKE
- Using Traefik Ingress in TKE
- Release
- Logs
- Monitoring
- OPS
- Removing and Re-adding Nodes from and to Cluster
- Using Ansible to Batch Operate TKE Nodes
- Using Cluster Audit for Troubleshooting
- Renewing a TKE Ingress Certificate
- Using cert-manager to Issue Free Certificates
- Using cert-manager to Issue Free Certificate for DNSPod Domain Name
- Using the TKE NPDPlus Plug-In to Enhance the Self-Healing Capability of Nodes
- Using kubecm to Manage Multiple Clusters kubeconfig
- Quick Troubleshooting Using TKE Audit and Event Services
- Customizing RBAC Authorization in TKE
- Clearing De-registered Tencent Cloud Account Resources
- Terraform
- DevOps
- Auto Scaling
- Cluster Auto Scaling Practices
- Using tke-autoscaling-placeholder to Implement Auto Scaling in Seconds
- Installing metrics-server on TKE
- Using Custom Metrics for Auto Scaling in TKE
- Utilizing HPA to Auto Scale Businesses on TKE
- Using VPA to Realize Pod Scaling up and Scaling down in TKE
- Adjusting HPA Scaling Sensitivity Based on Different Business Scenarios
- Implementing elasticity based on traffic prediction with EHPA
- Implementing Horizontal Scaling based on CLB monitoring metrics using KEDA in TKE
- Storage
- Containerization
- Microservice
- Cost Management
- Fault Handling
- Disk Full
- High Workload
- Memory Fragmentation
- Cluster DNS Troubleshooting
- Cluster kube-proxy Troubleshooting
- Cluster API Server Inaccessibility Troubleshooting
- Service and Ingress Inaccessibility Troubleshooting
- Troubleshooting for Pod Network Inaccessibility
- Pod Status Exception and Handling
- Authorizing Tencent Cloud OPS Team for Troubleshooting
- Engel Ingres appears in Connechtin Reverside
- CLB Loopback
- CLB Ingress Creation Error
- API Documentation
- History
- API Category
- Cluster APIs
- DescribeEncryptionStatus
- DisableEncryptionProtection
- EnableEncryptionProtection
- UpdateClusterVersion
- AcquireClusterAdminRole
- CreateClusterEndpoint
- CreateClusterEndpointVip
- DeleteCluster
- DeleteClusterEndpoint
- DeleteClusterEndpointVip
- DescribeAvailableClusterVersion
- DescribeClusterAuthenticationOptions
- DescribeClusterCommonNames
- DescribeClusterEndpointStatus
- DescribeClusterEndpointVipStatus
- DescribeClusterEndpoints
- DescribeClusterKubeconfig
- DescribeClusterLevelAttribute
- DescribeClusterLevelChangeRecords
- DescribeClusterSecurity
- DescribeClusterStatus
- DescribeClusters
- DescribeEdgeAvailableExtraArgs
- DescribeEdgeClusterExtraArgs
- DescribeResourceUsage
- DisableClusterDeletionProtection
- EnableClusterDeletionProtection
- GetClusterLevelPrice
- GetUpgradeInstanceProgress
- ModifyClusterAttribute
- ModifyClusterAuthenticationOptions
- ModifyClusterEndpointSP
- UpgradeClusterInstances
- CreateCluster
- UpdateClusterKubeconfig
- DescribeBackupStorageLocations
- DeleteBackupStorageLocation
- CreateBackupStorageLocation
- Node Pool APIs
- TKE Edge Cluster APIs
- DescribeTKEEdgeScript
- UpdateEdgeClusterVersion
- CreateTKEEdgeCluster
- DescribeTKEEdgeExternalKubeconfig
- DescribeTKEEdgeClusters
- DescribeTKEEdgeClusterStatus
- DescribeTKEEdgeClusterCredential
- DescribeEdgeClusterInstances
- DescribeEdgeCVMInstances
- DescribeECMInstances
- DescribeAvailableTKEEdgeVersion
- DeleteTKEEdgeCluster
- DeleteEdgeClusterInstances
- DeleteEdgeCVMInstances
- DeleteECMInstances
- CreateECMInstances
- CheckEdgeClusterCIDR
- ForwardTKEEdgeApplicationRequestV3
- UninstallEdgeLogAgent
- InstallEdgeLogAgent
- DescribeEdgeLogSwitches
- CreateEdgeLogConfig
- CreateEdgeCVMInstances
- DescribeEdgeClusterUpgradeInfo
- Introduction
- Making API Requests
- Add-on APIs
- Network APIs
- Node APIs
- Cloud Native Monitoring APIs
- Virtual node APIs
- Other APIs
- Scaling group APIs
- Data Types
- Error Codes
- API Mapping Guide
- TKE Insight
- TKE Scheduling
- FAQs
- Service Agreement
- Contact Us
- Purchase Channels
- Glossary
- User Guide(Old)
NoteTo provide better and more powerful product capabilities, TPS will be merged and upgraded into Tencent Managed Service for Prometheus (TMP). The new TMP service supports cross-region and cross-VPC monitoring and connecting a unified Grafana dashboard to multiple TMP instances for data display in one place. For more information on TMP billing, see Pay-as-You-Go. For Tencent Cloud resource usage details, see Billing Mode and Resource Usage. Free metrics for basic monitoring will not be billed.
TPS will be deactivated on May 16, 2022. For more information, see Announcements. Click here to try out the launched TMP service. TPS instances can no longer be created. You can use our quick migration tool to migrate your TPS instances to TMP. Before the migration, streamline monitoring metrics or reduce the collection frequency first; otherwise, higher costs may be incurred.
Overview
This document describes how to streamline the TPS collection metrics to avoid unnecessary expenses after the migration to TMP.
Prerequisites
Before configuring monitoring collection items, you need to perform the following operations:
- You have logged in to the TKE console and created a self-deployed cluster.
- You have created a TMP instance in the VPC of the cluster.
Streamlining Metrics
Streamlining metrics in the console
TMP offers more than 100 free basic monitoring metrics as listed in Free Metrics in Pay-as-You-Go Mode.
- Log in to the TKE console and select Cloud Native Monitoring on the left sidebar.
- On the instance list page, select the target instance to enter its details page.
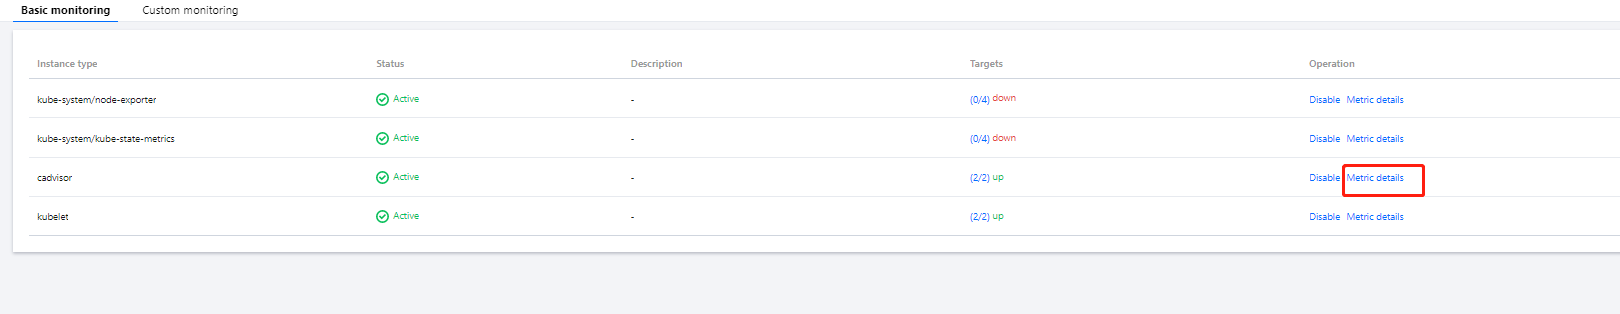
- On the Associate with Cluster page, click Data Collection Configuration on the right of the cluster to enter the collection configuration list page.
- You can add or remove targets of basic metrics on the productized page. Click Metric Details on the right.
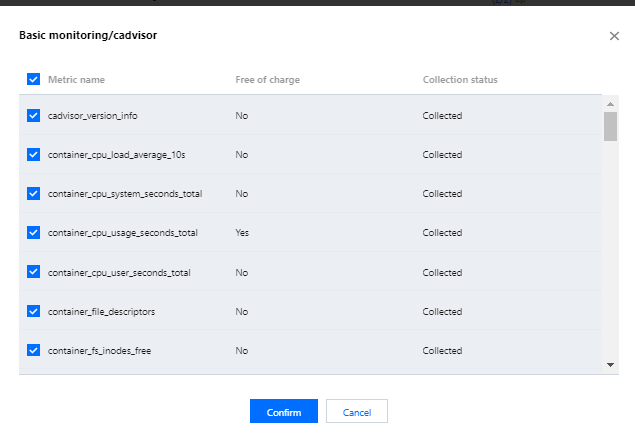
- The following shows whether the metrics are free. If you select a metric, it will be collected. We recommend you deselect paid metrics to avoid additional costs after the migration to TMP. Only metrics for basic monitoring are free of charge. For more information on free metrics, see Free Metrics in Pay-as-You-Go Mode. For more information on paid metrics, see Pay-as-You-Go.
Streamlining metrics through YAML
Currently, TMP is billed by the number of monitoring data points. We recommend you optimize your collection configuration to collect only required metrics and filter out unnecessary ones. This will save costs and reduce the overall reported data volume. For more information on the billing mode and Tencent Cloud resource usage, see here.
The following describes how to add filters for ServiceMonitors, PodMonitors, and RawJobs to streamline custom metrics.
- Log in to the TKE console and select Cloud Native Monitoring on the left sidebar.
- On the instance list page, select the target instance to enter its details page.
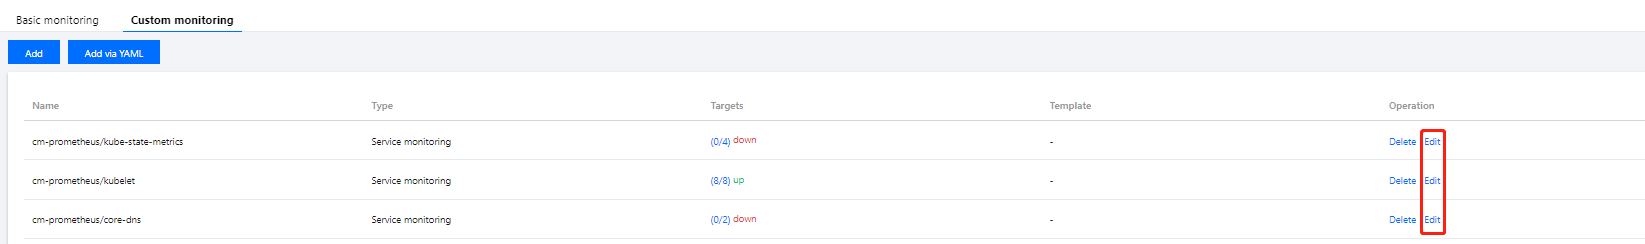
- On the Associate with Cluster page, click Data Collection Configuration on the right of the cluster to enter the collection configuration list page.
- Click Edit as shown below:
ServiceMonitor and PodMonitor
A ServiceMonitor and a PodMonitor use the same filtering fields, and this document uses a ServiceMonitor as an example.
Sample for ServiceMonitor:
apiVersion: monitoring.coreos.com/v1
kind: ServiceMonitor
metadata:
labels:
  app.kubernetes.io/name: kube-state-metrics
  app.kubernetes.io/version: 1.9.7
name: kube-state-metrics
namespace: kube-system
spec:
endpoints:
- bearerTokenSecret:
    key: ""
  interval: 15s # This parameter is the collection frequency. You can increase it to reduce the data storage costs. For example, you can set it to `300s` for less important metrics, which can reduce the amount of monitoring data collected by 20 times.
  port: http-metrics
  scrapeTimeout: 15s
jobLabel: app.kubernetes.io/name
namespaceSelector: {}
selector:
  matchLabels:
    app.kubernetes.io/name: kube-state-metrics
To collect kube_node_info and kube_node_role metrics, you need to add the metricRelabelings field to the Endpoint list of the ServiceMonitor. Note that it is metricRelabelings but not relabelings.
Sample for adding metricRelabelings:
apiVersion: monitoring.coreos.com/v1
kind: ServiceMonitor
metadata:
labels:
  app.kubernetes.io/name: kube-state-metrics
  app.kubernetes.io/version: 1.9.7
name: kube-state-metrics
namespace: kube-system
spec:
endpoints:
- bearerTokenSecret:
    key: ""
  interval: 15s # This parameter is the collection frequency. You can increase it to reduce the data storage costs. For example, you can set it to `300s` for less important metrics, which can reduce the amount of monitoring data collected by 20 times.
  port: http-metrics
  scrapeTimeout: 15s # This parameter is the collection timeout period. TMP configuration requires that this value not exceed the collection interval, i.e., `scrapeTimeout` <= `interval`.
  # The following four lines are added:
  metricRelabelings: # Each collected item is subject to the following processing.
  - sourceLabels: ["__name__"] # The name of the label to be detected. `__name__` indicates the name of the metric or any label that comes with the item.
    regex: kube_node_info|kube_node_role # Whether the above label satisfies this regex. Here, `__name__` should satisfy the requirements of `kube_node_info` or `kube_node_role`.
    action:  keep # Keep the item if it meets the above conditions; otherwise, drop it.
jobLabel: app.kubernetes.io/name
namespaceSelector: {}
selector:
RawJob
If Prometheus' RawJob is used, see the following method for metric filtering.
Sample job:
scrape_configs:
- job_name: job1
  scrape_interval: 15s # This parameter is the collection frequency. You can increase it to reduce the data storage costs. For example, you can set it to `300s` for less important metrics, which can reduce the amount of monitoring data collected by 20 times.
  static_configs:
    - targets:
        - '1.1.1.1'
If you only need to collect kube_node_info and kube_node_role metrics, add the metric_relabel_configs field. Note that it is metric_relabel_configs but not relabel_configs.
Sample for adding metric_relabel_configs:
scrape_configs:
- job_name: job1
  scrape_interval: 15s # This parameter is the collection frequency. You can increase it to reduce the data storage costs. For example, you can set it to `300s` for less important metrics, which can reduce the amount of monitoring data collected by 20 times.
  static_configs:
  - targets:
    - '1.1.1.1'
  # The following four lines are added:
  metric_relabel_configs: # Each collected item is subject to the following processing.
  - source_labels: ["__name__"] # The name of the label to be detected. `__name__` indicates the name of the metric or any label that comes with the item.
    regex: kube_node_info|kube_node_role # Whether the above label satisfies this regex. Here, `__name__` should satisfy the requirements of `kube_node_info` or `kube_node_role`.
    action: keep # Keep the item if it meets the above conditions; otherwise, drop it.
Blocking certain targets
Blocking the monitoring of the entire namespace
TPS will manage all the ServiceMonitors and PodMonitors in a cluster by default after the cluster is associated. If you want to block the monitoring of a namespace, you can label it with tps-skip-monitor: "true" as instructed in Labels and Selectors.
Blocking certain targets
TPS collects monitoring data by creating CRD resources of ServiceMonitor and PodMonitor types in your cluster. If you want to block the collection of the specified ServiceMonitor and PodMonitor resources, you can add the label of tps-skip-monitor: "true" to these CRD resources as instructed in Labels and Selectors.

 Ya
Ya
 Tidak
Tidak
Apakah halaman ini membantu?