
数据引擎监控

最后更新时间:2024-07-31 17:31:25
使用须知
监控入口
入口一:数据湖计算 DLC 控制台
注意:
账号需有数据引擎的监控权限。
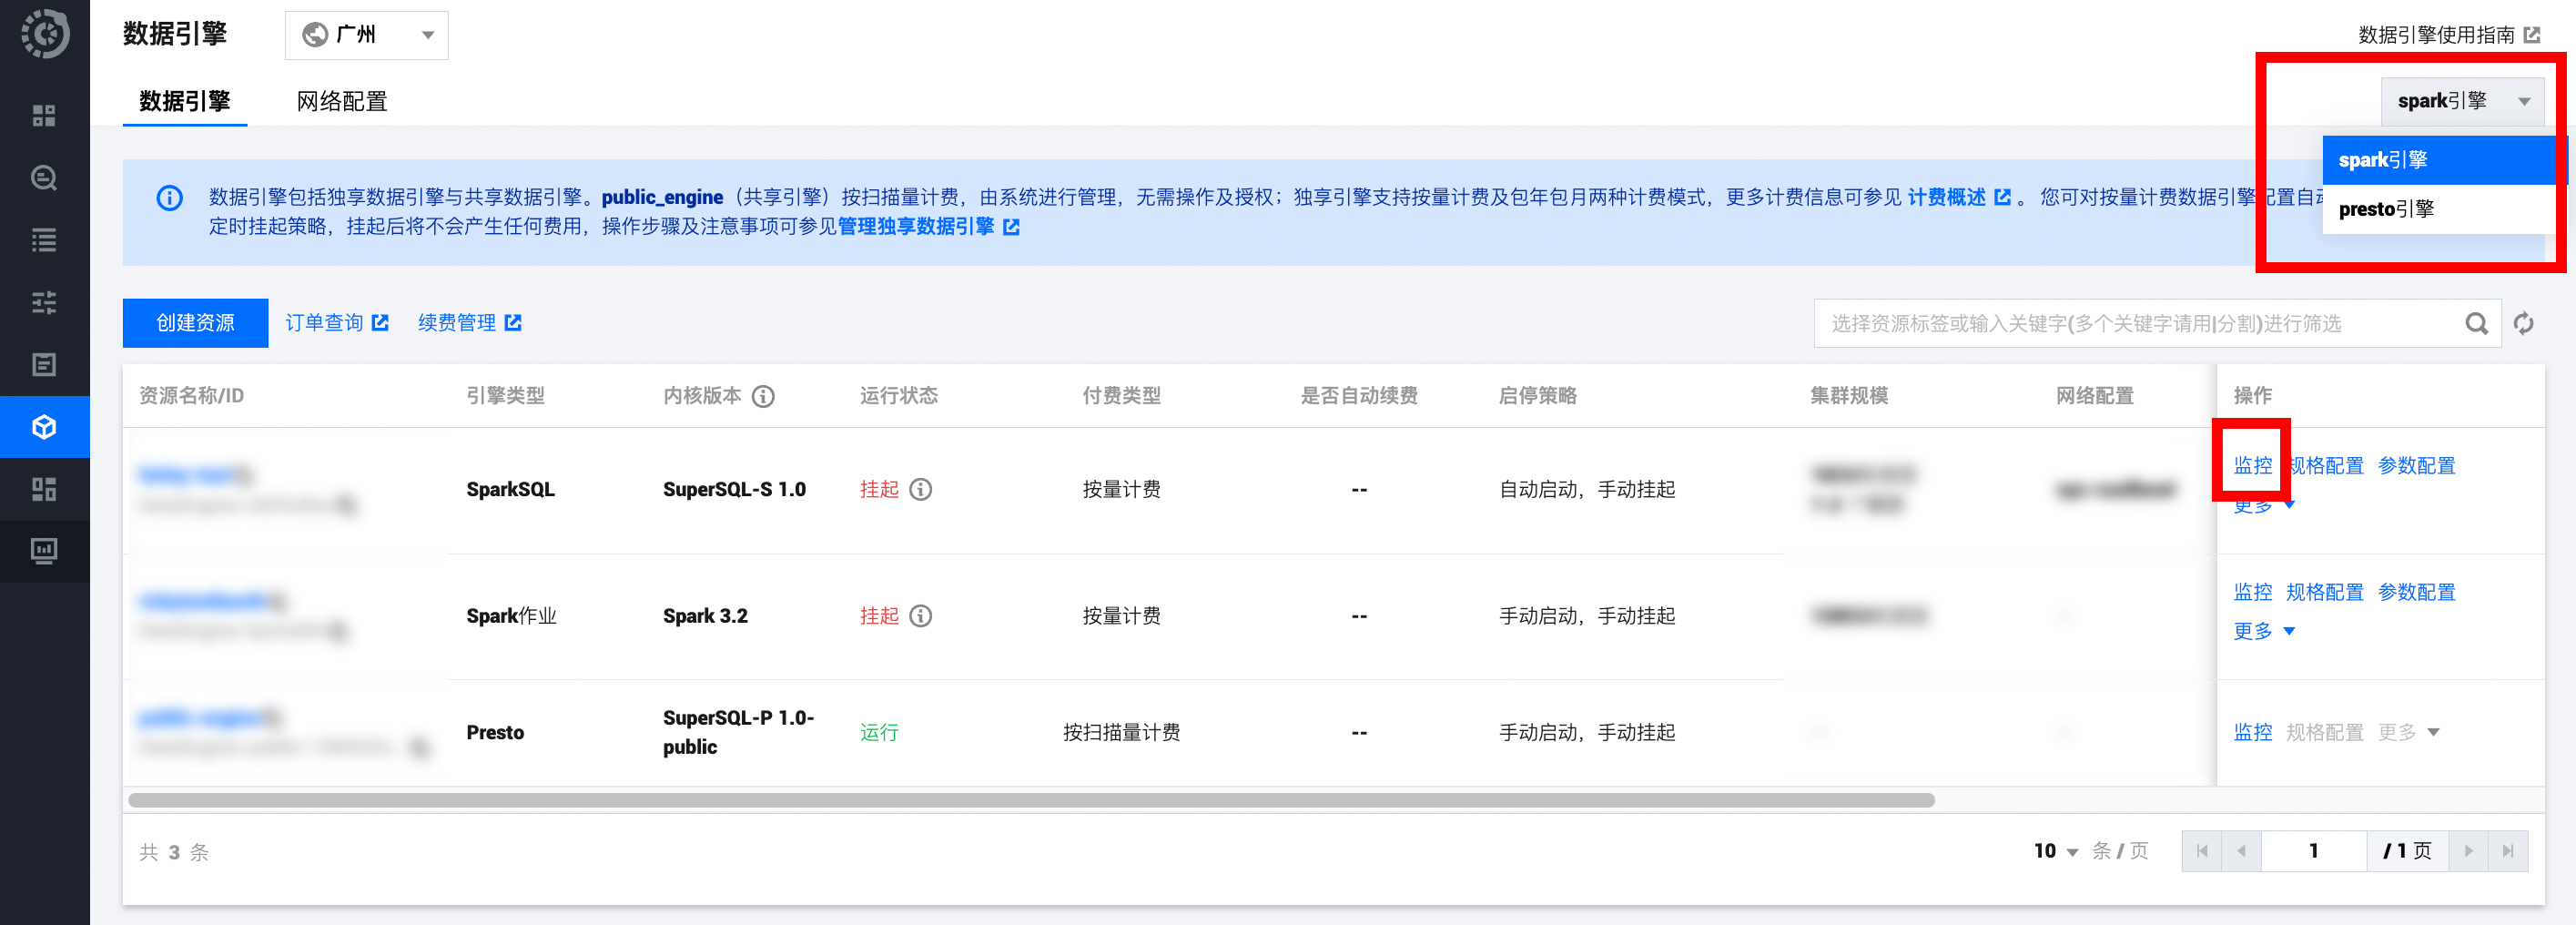
1. 登录 数据湖计算 DLC 控制台,选择服务地域。
2. 左侧菜单栏进入数据引擎页。
3. 查看方式支持:
方式1:选择引擎类型,进入匹配引擎监控列表。
方式2:选择引擎列表中目标引擎,单击监控查看目标引擎监控。
入口二:腾讯云可观测平台
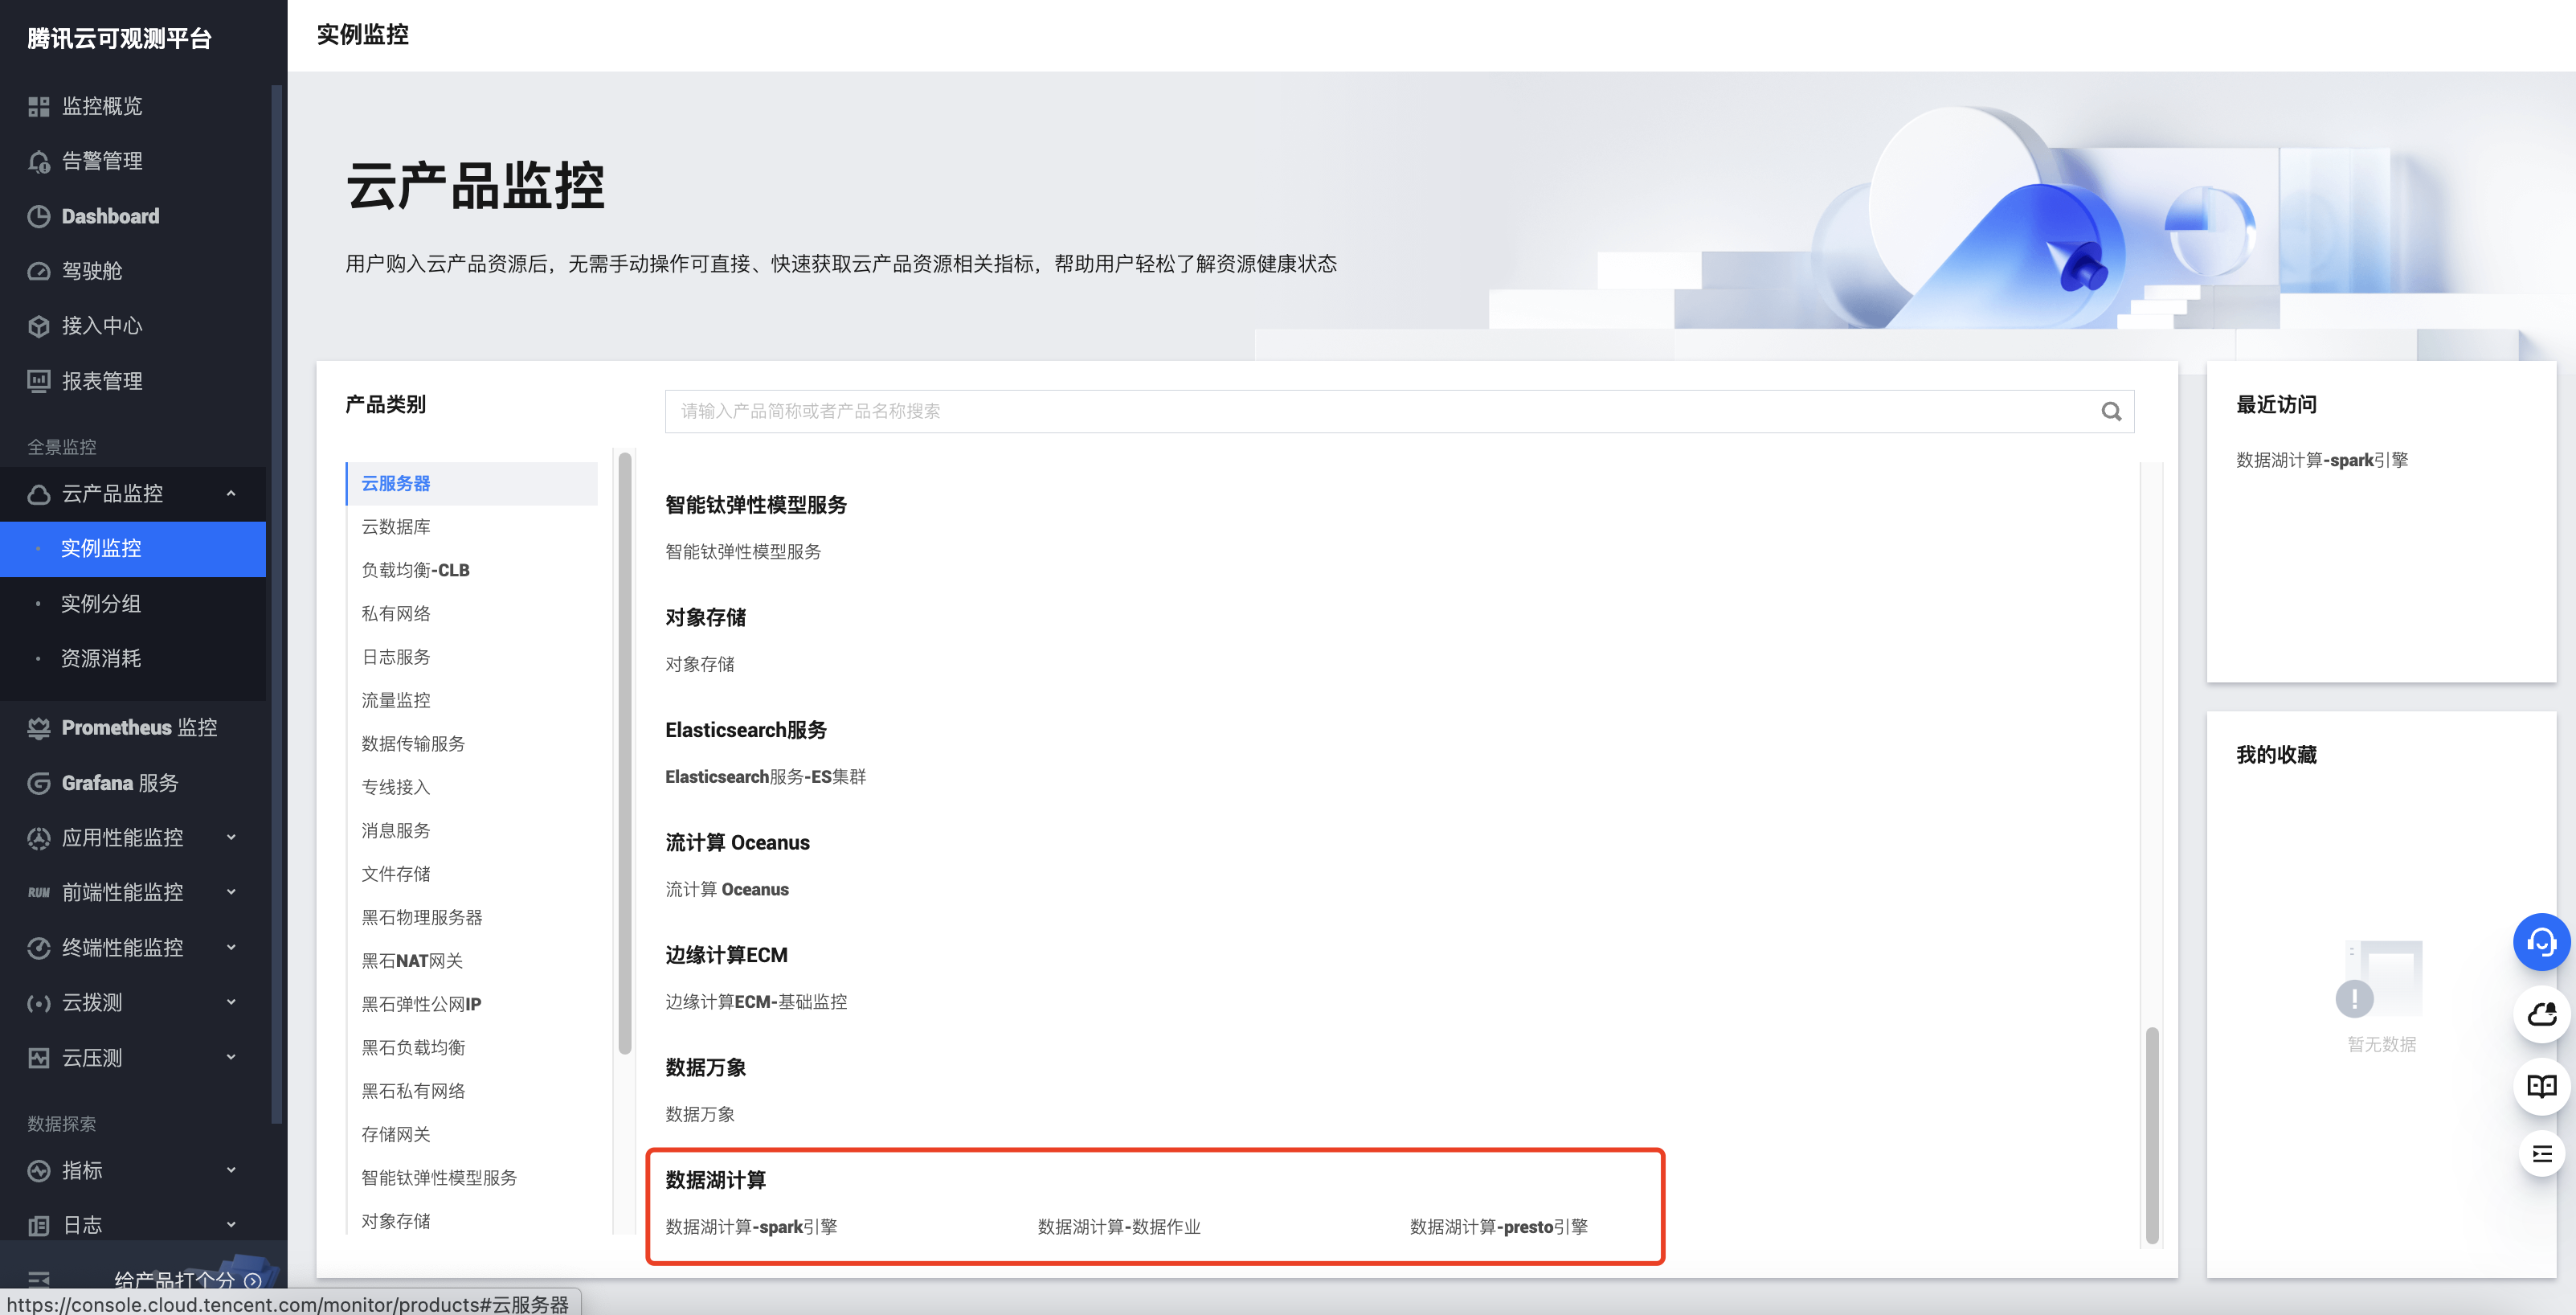
1. 登录 腾讯云可观测平台,登录账号需具备相关权限。
2. 左侧菜单选择云产品监控,找到数据湖计算 DLC,并选择需要查看监控的类型。
3. 选择监控类型后进入监控页,选择对应地域即可查看该地域下的监控资源信息。
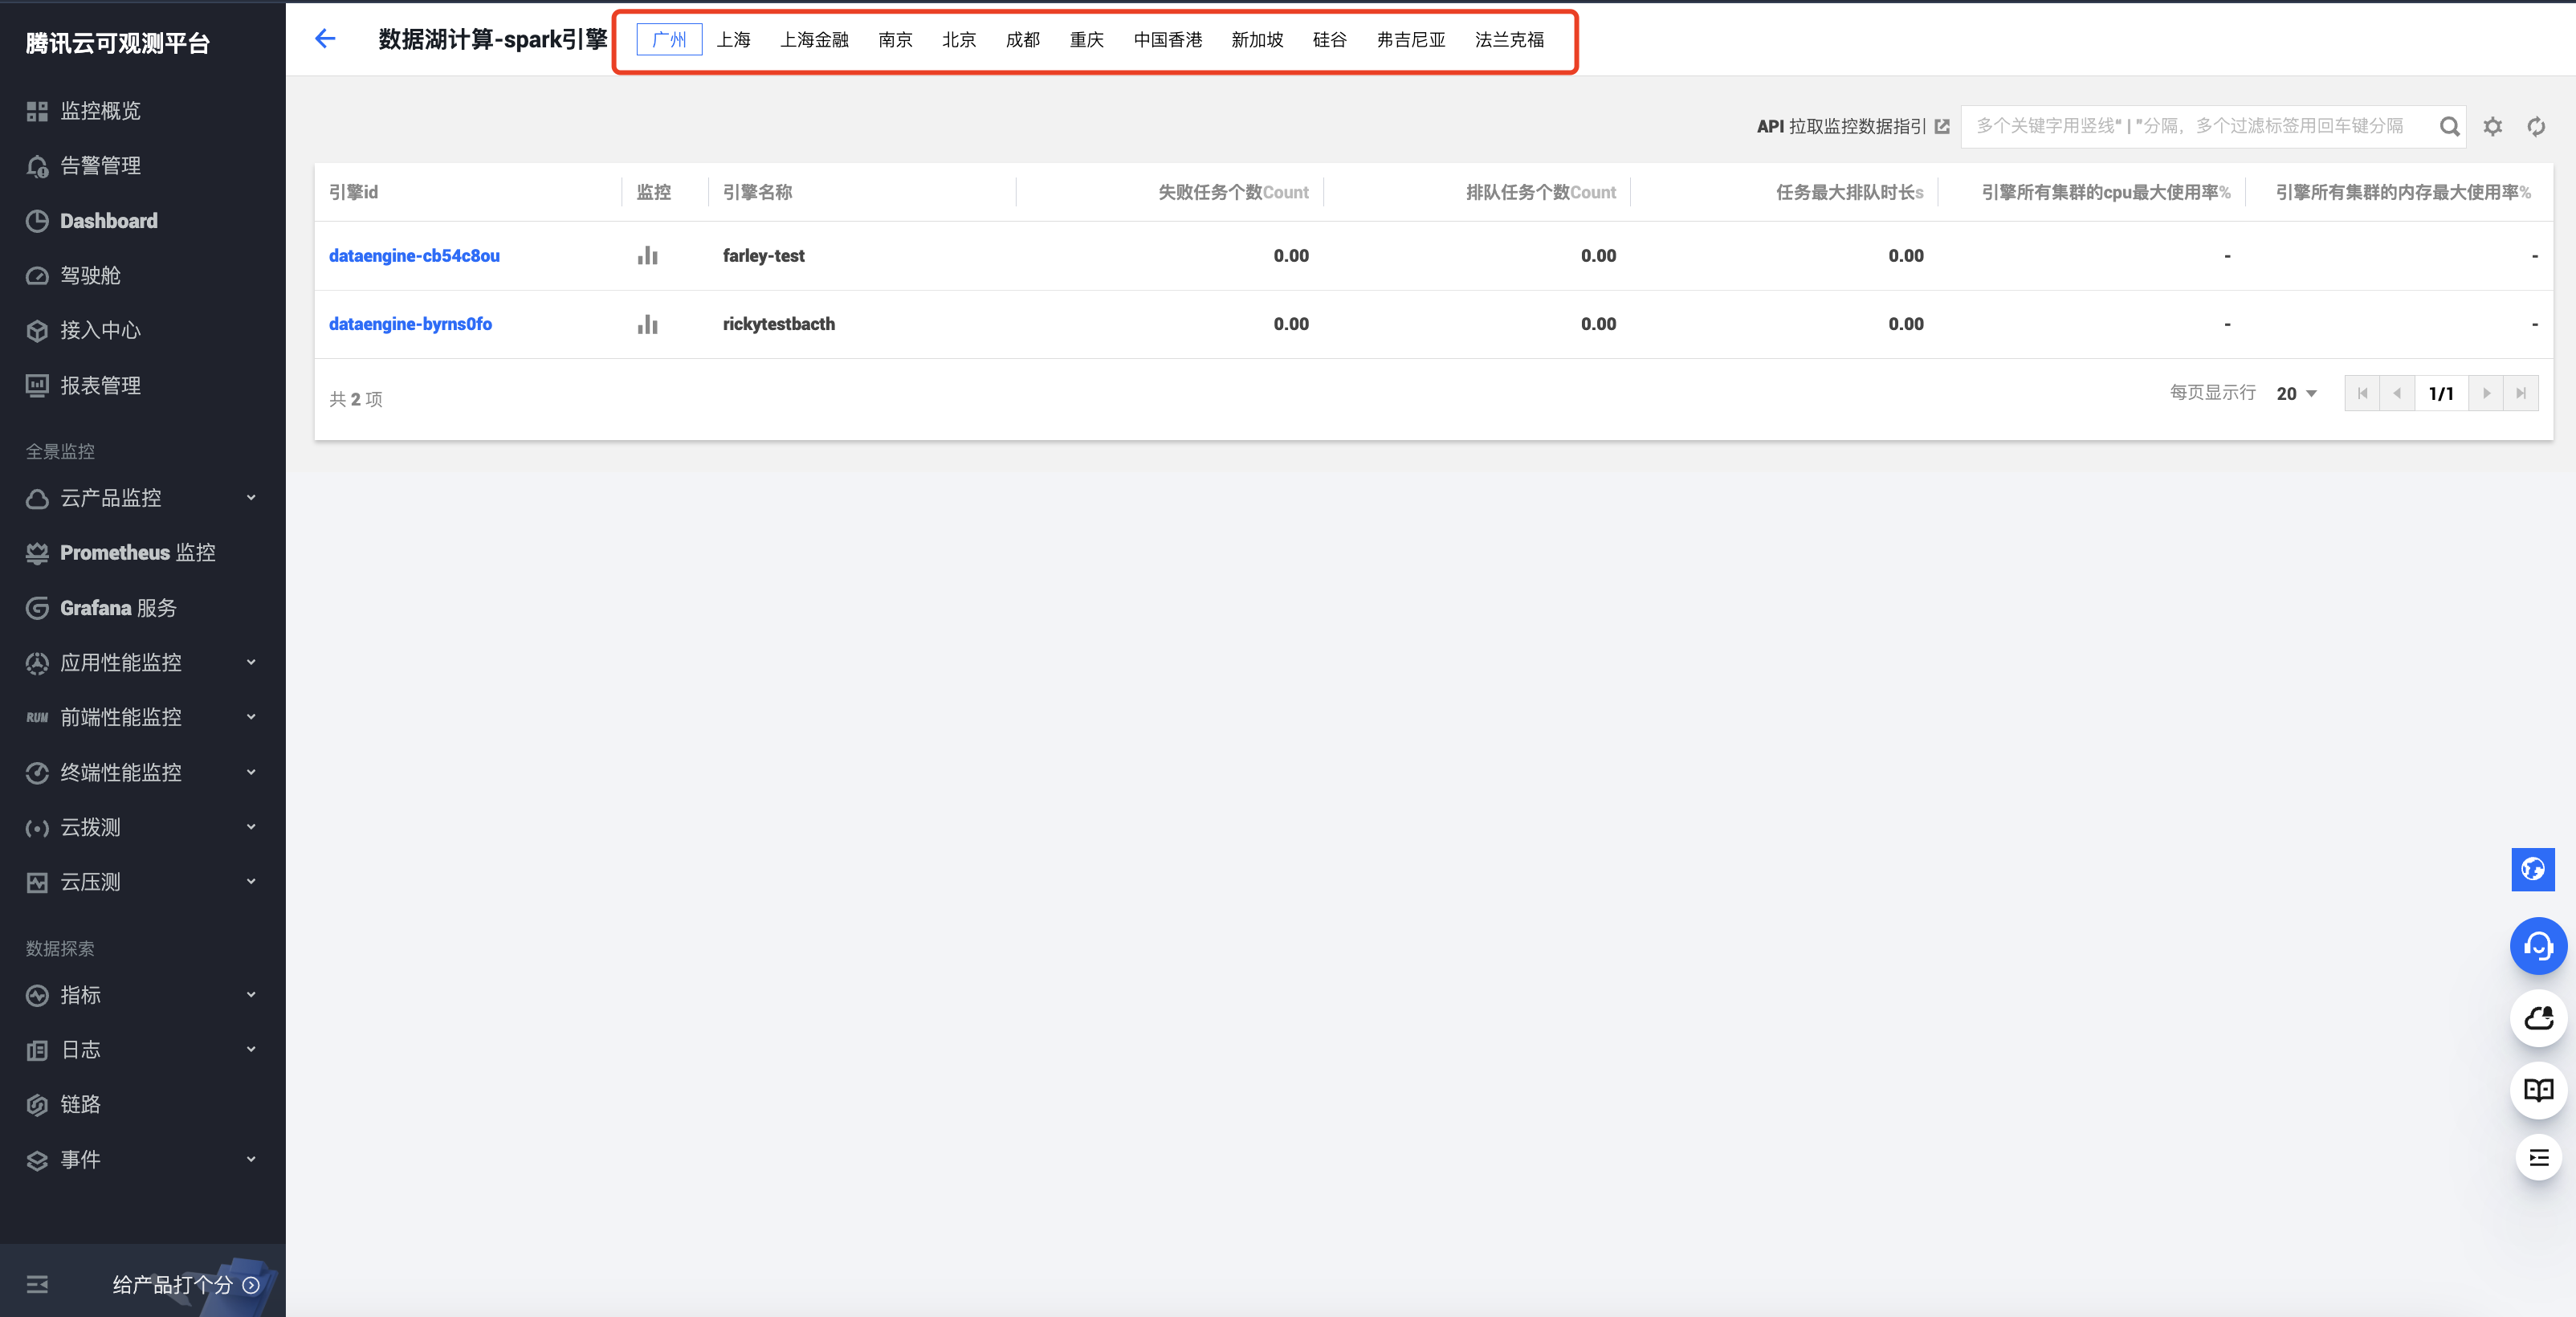
4. 单击引擎 ID 即可进入监控详情。
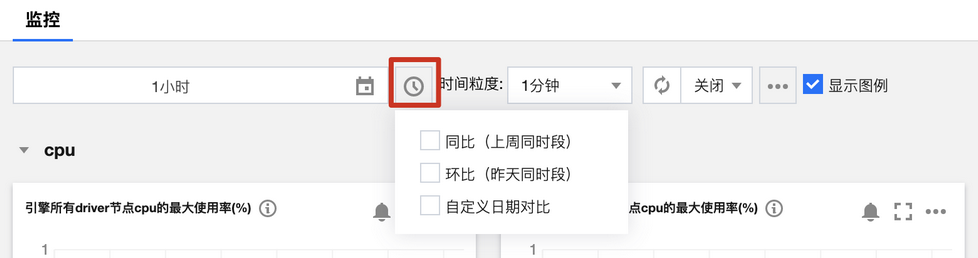
监控粒度配置
支持通过监控顶部配置监控数据时间范围、时间粒度、自动更新时间范围。
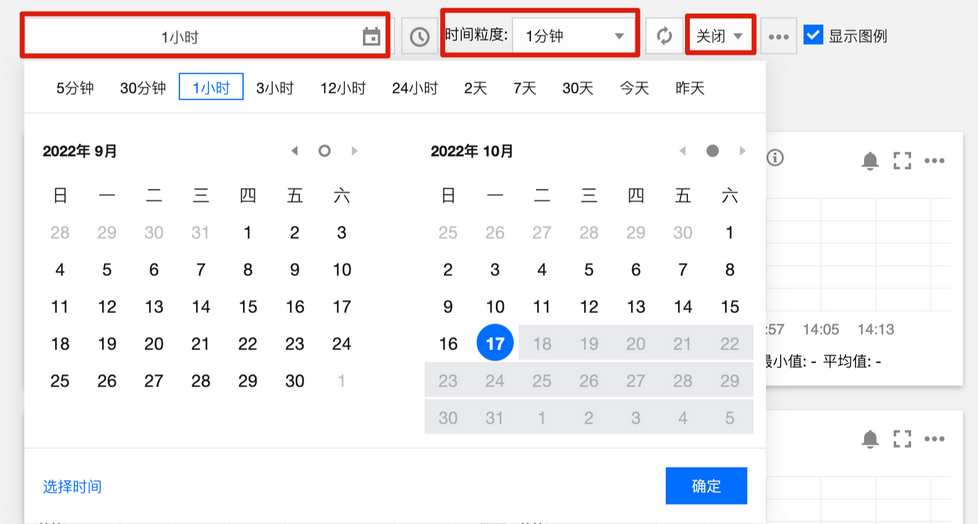
监控数据时间范围:精确到分钟,支持选择一段时间的数据。
时间粒度:监测点间隔时间,支持配置1分钟或5分钟。
自动更新数据:页面数据自动刷新方式配置,支持配置关闭、30s、5min、30min、1h。
监控数据对比
支持选择一段时间的数据进行监控对比。单击选择对比时间范围后即可在下方数据罗盘查看对比数据。
监控指标
监控类型 | 监控指标 |
CPU | 所有 Driver 节点 CPU 最大使用率 |
| 所有 Executor 节点 CPU 最大使用率 |
| 所有 Driver 节点 CPU 平均使用率 |
| 所有 Executor 节点 CPU 平均使用率 |
| 所有集群 CPU 最大使用率 |
| 所有集群 CPU 平均使用率 |
内存 | 所有 Driver 节点内存最大使用率 |
| 所有 Executor 节点内存最大使用率 |
| 所有 Driver 节点内存平均使用率 |
| 所有 Executor 节点内存平均使用率 |
| 所有集群内存最大使用率 |
| 所有集群内存平均使用率 |
任务 | 取消任务个数 |
| 失败任务个数 |
| 初始化任务个数 |
| 任务平均初始化时长 |
| 任务最大初始化时长 |
| 排队任务个数 |
| 任务平均排队时长 |
| 任务最大排队时长 |
| 运行中任务个数 |
| 成功任务个数 |
网络 | 所有 Driver 节点网络最大入带宽 |
| 所有 Executor 节点网络最大入带宽 |
| 所有 Driver 节点网络平均入带宽 |
| 所有 Executor 节点网络平均入带宽 |
| 所有 Driver 节点网络最大出带宽 |
| 所有 Executor 节点网络最大出带宽 |
| 所有 Driver 节点网络平均出带宽 |
| 所有 Executor 节点网络平均出带宽 |
云盘 | 所有 Driver 节点云盘最大使用率 |
| 所有 Executor 节点云盘最大使用率 |
| 所有 Driver 节点云盘平均使用率 |
| 所有 Executor 节点云盘平均使用率 |
CU | 作业引擎 CU 数 |
| CU 使用率 |
文档反馈