Cloud Streaming Services
- Release Notes and Announcements
- Announcements
- Product Introduction
- CSS Products
- Purchase Guide
- Basic Service Fee
- Value-Added Service Fee
- Live Video Broadcasting (LVB)
- Live Event Broadcasting (LEB)
- Live Video Caster
- General Cloud Director
- Console Guide
- Domain Management
- Adding Domain Names
- Push Domain Name Management
- Playback Domain Name Management
- HTTPS Configuration
- Feature Configuration
- Time Shifting
- Live Stream Moderation
- Live Subtitling
- Laboratory
- Monitoring
- Log Service
- Feature Guide
- Push and Playback
- WebRTC Protocol Push Stream
- Features
- Live Recording
- Practices in Typical Scenarios
- Live Streaming Security
- Global CSS Service
- Callback Notifications
- User Guides for Common Third-Party Tools
- SDK Guide
- 1. Stream Push
- API Documentation
- Making API Requests
- Monitoring Data Query APIs
- Billing Data Query APIs
- Live Transcoding APIs
- Delayed Playback Management APIs
- Domain Name Management APIs
- Watermark Management APIs
- Certificate Management APIs
- Live Stream Mix APIs
- Stream Pulling APIs
- Recording Management APIs
- Time Shifting APIs
- Live Callback APIs
- Screencapturing and Porn Detection APIs
- Authentication Management APIs
- Live Stream Management APIs
- Ops Guide
- Troubleshooting
- About Pushing
- Generating Push URLs
- PC Push
- Playing Method
- Web Player
- Web Player TcPlayer
- Web CSS Player 1.0
- Web VOD Player 1.0
- FAQs
Billing Usage Statistics
Last updated: 2024-09-12 14:07:24
Billing usage statistics
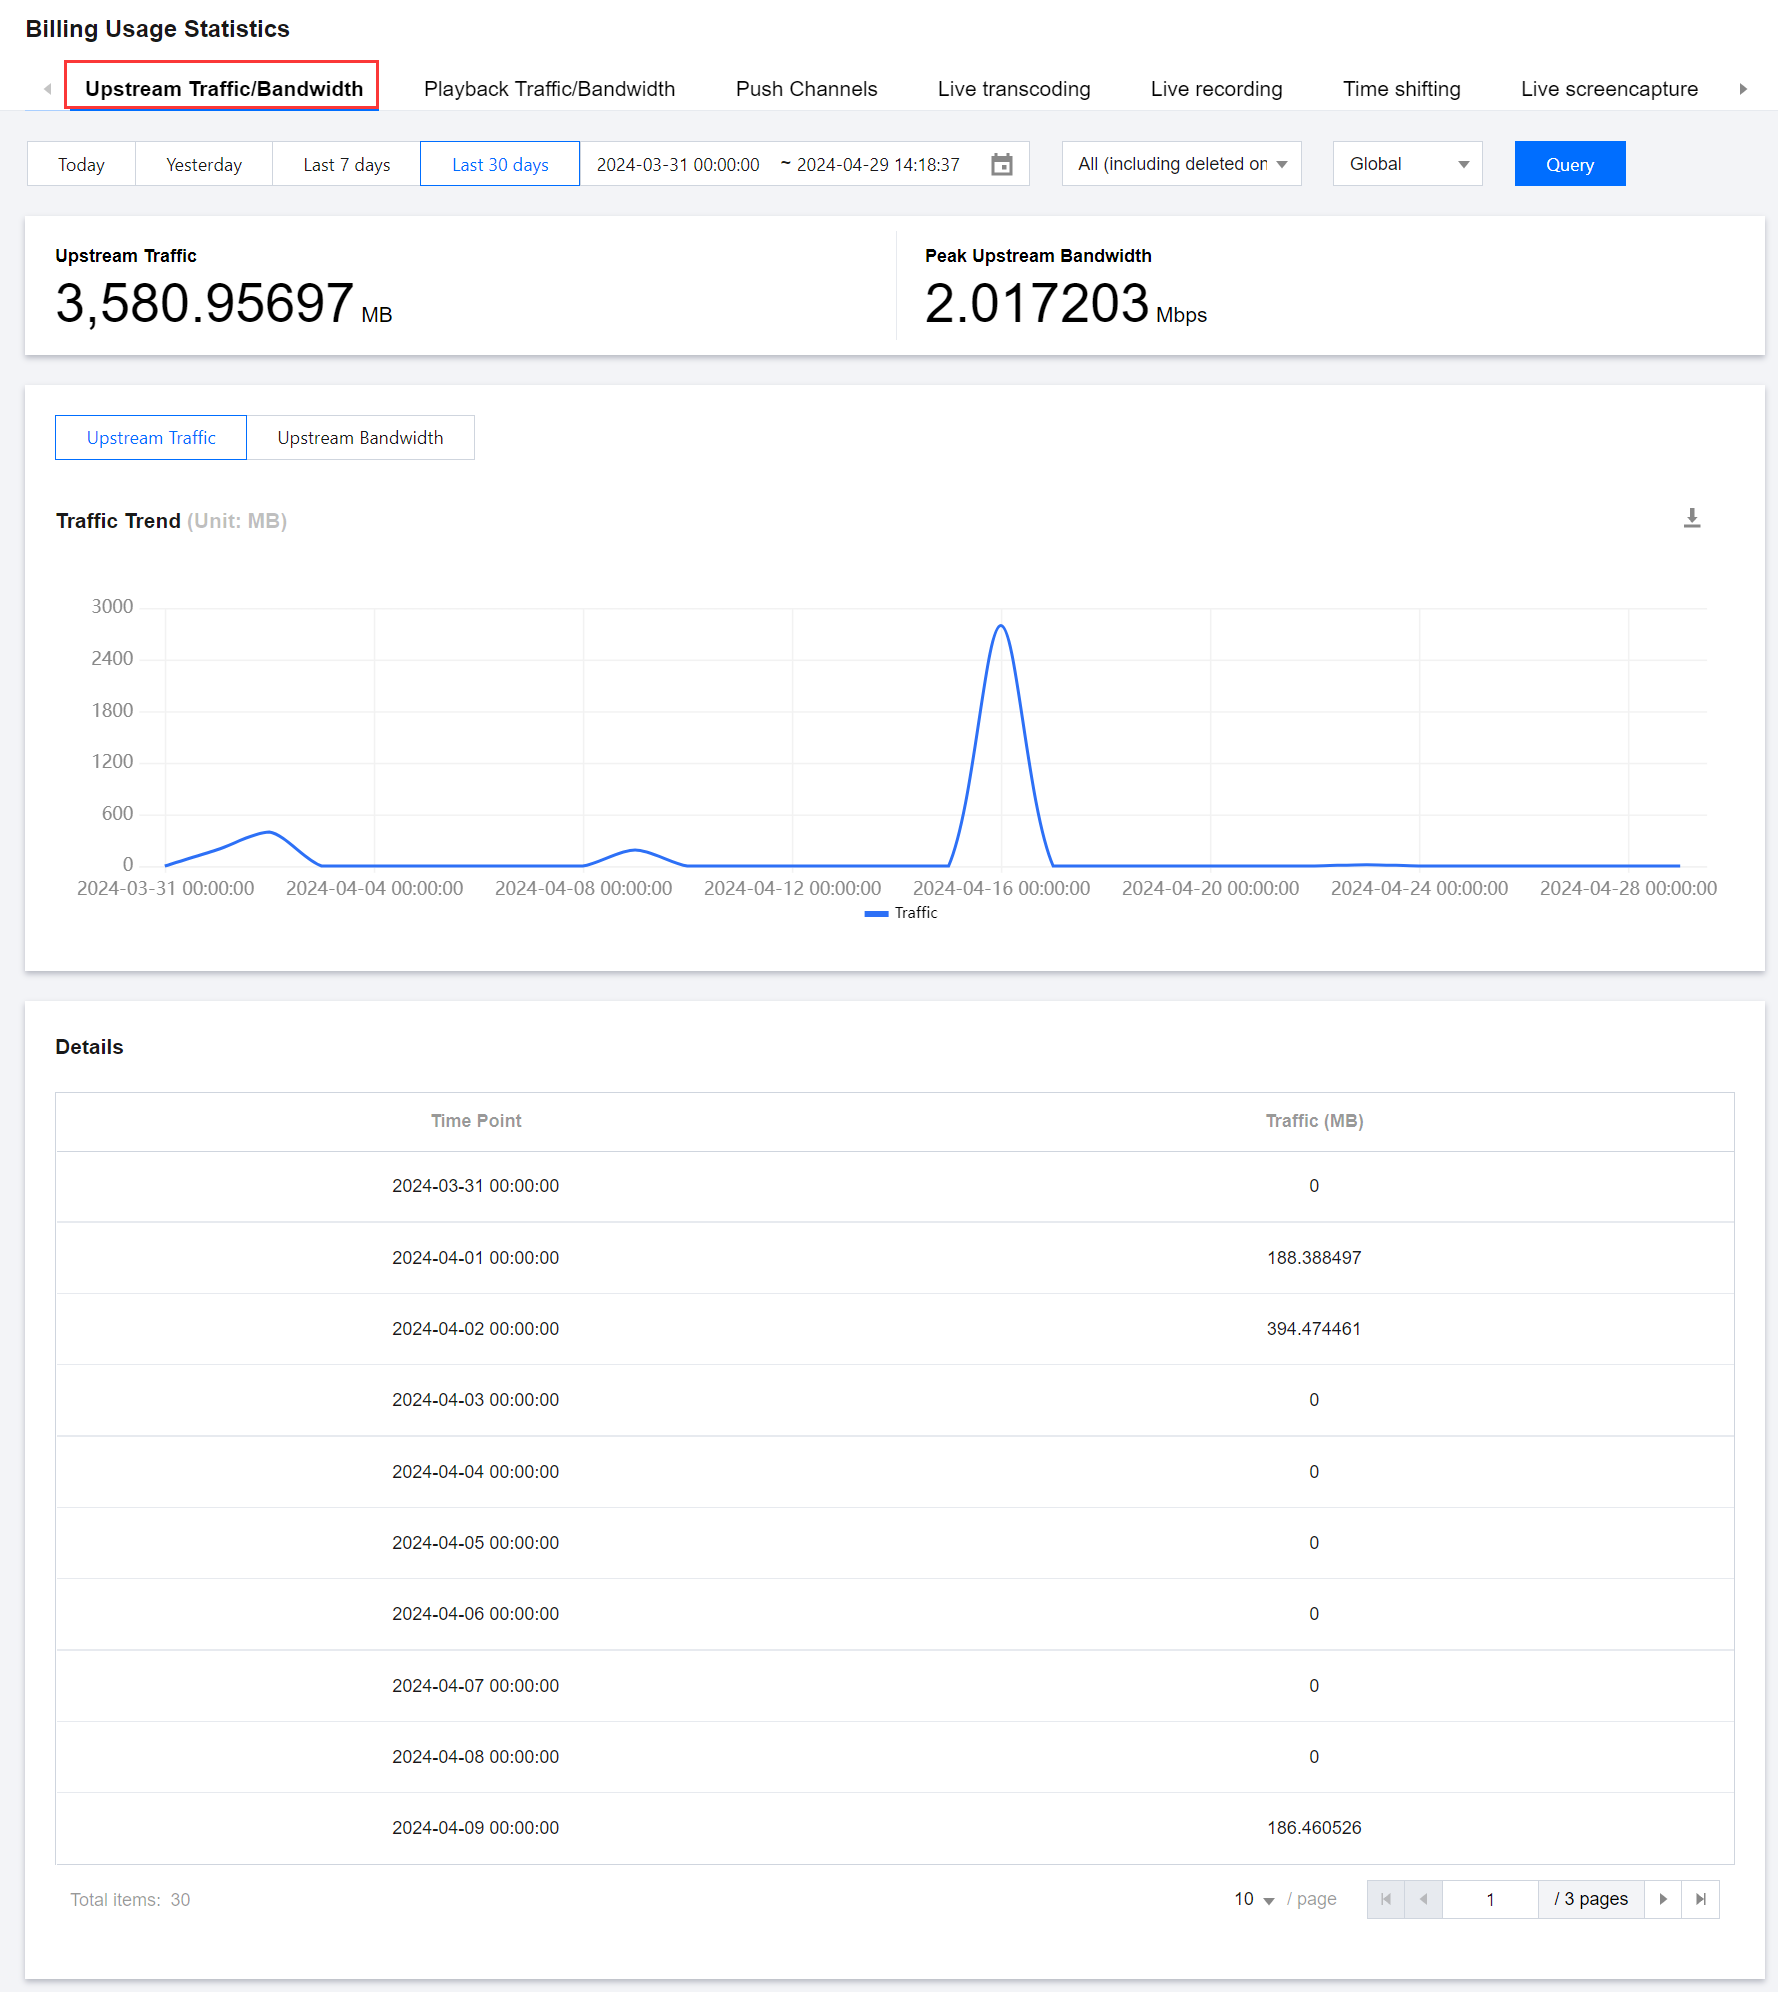
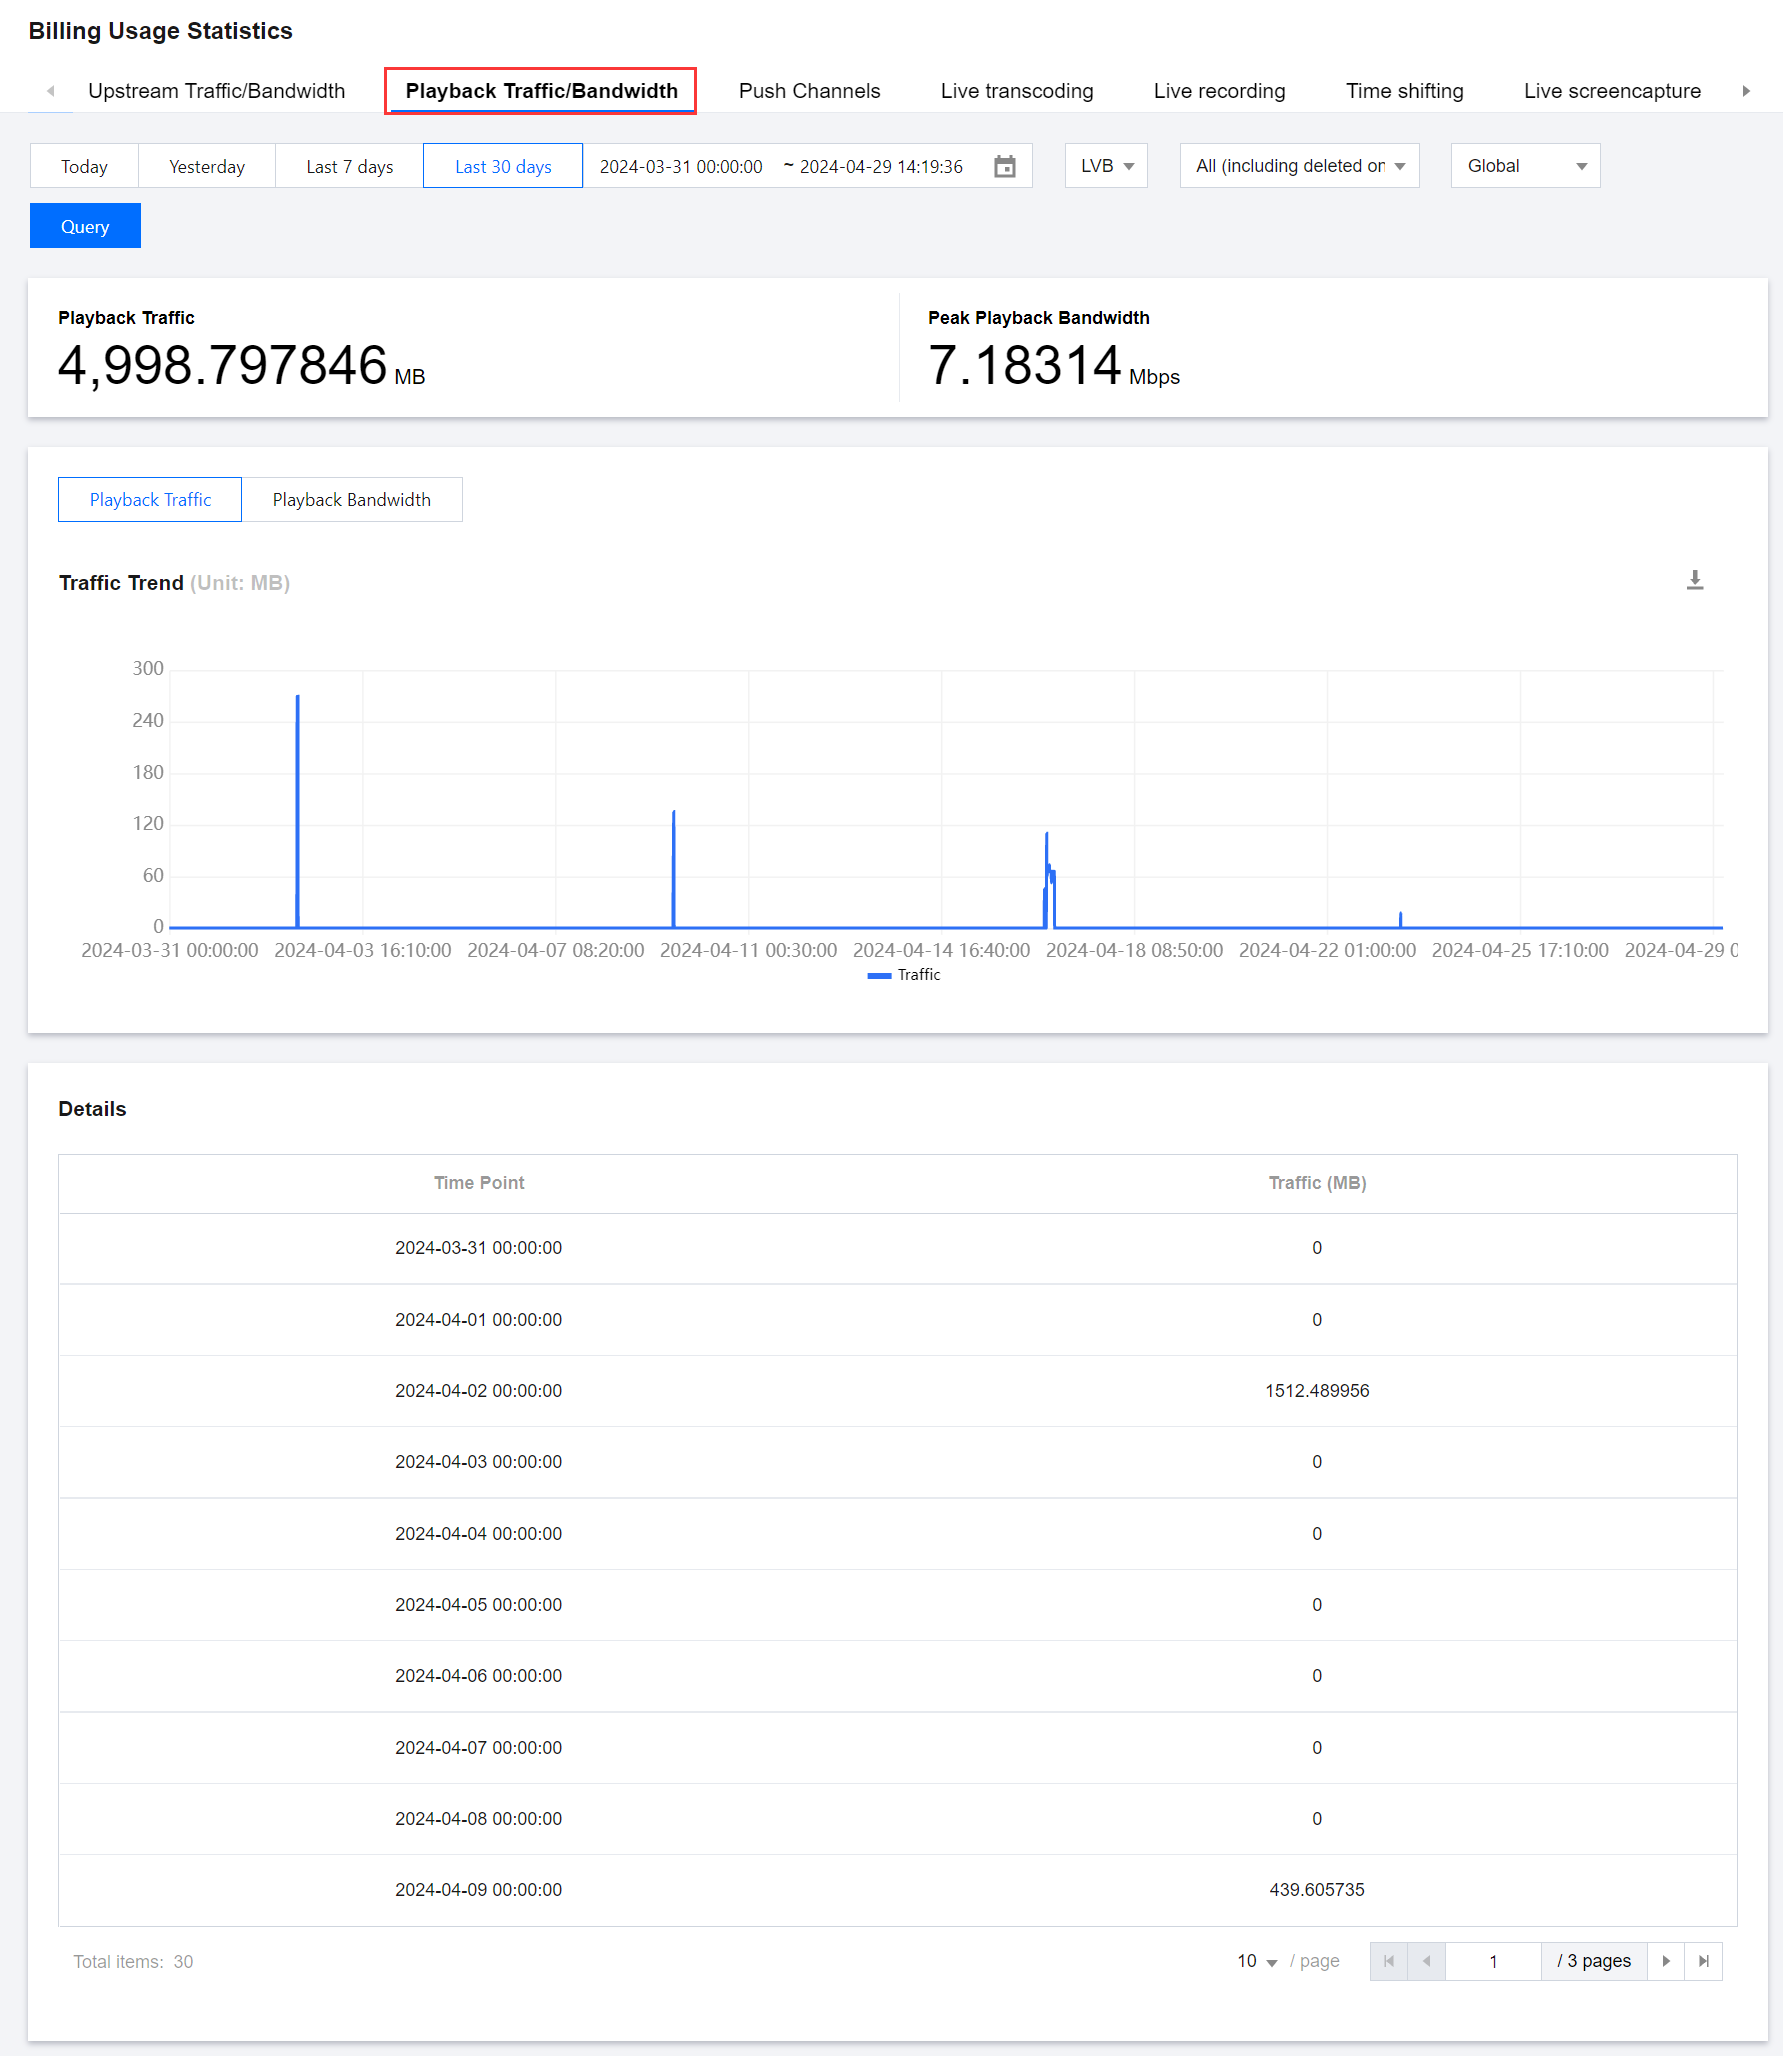
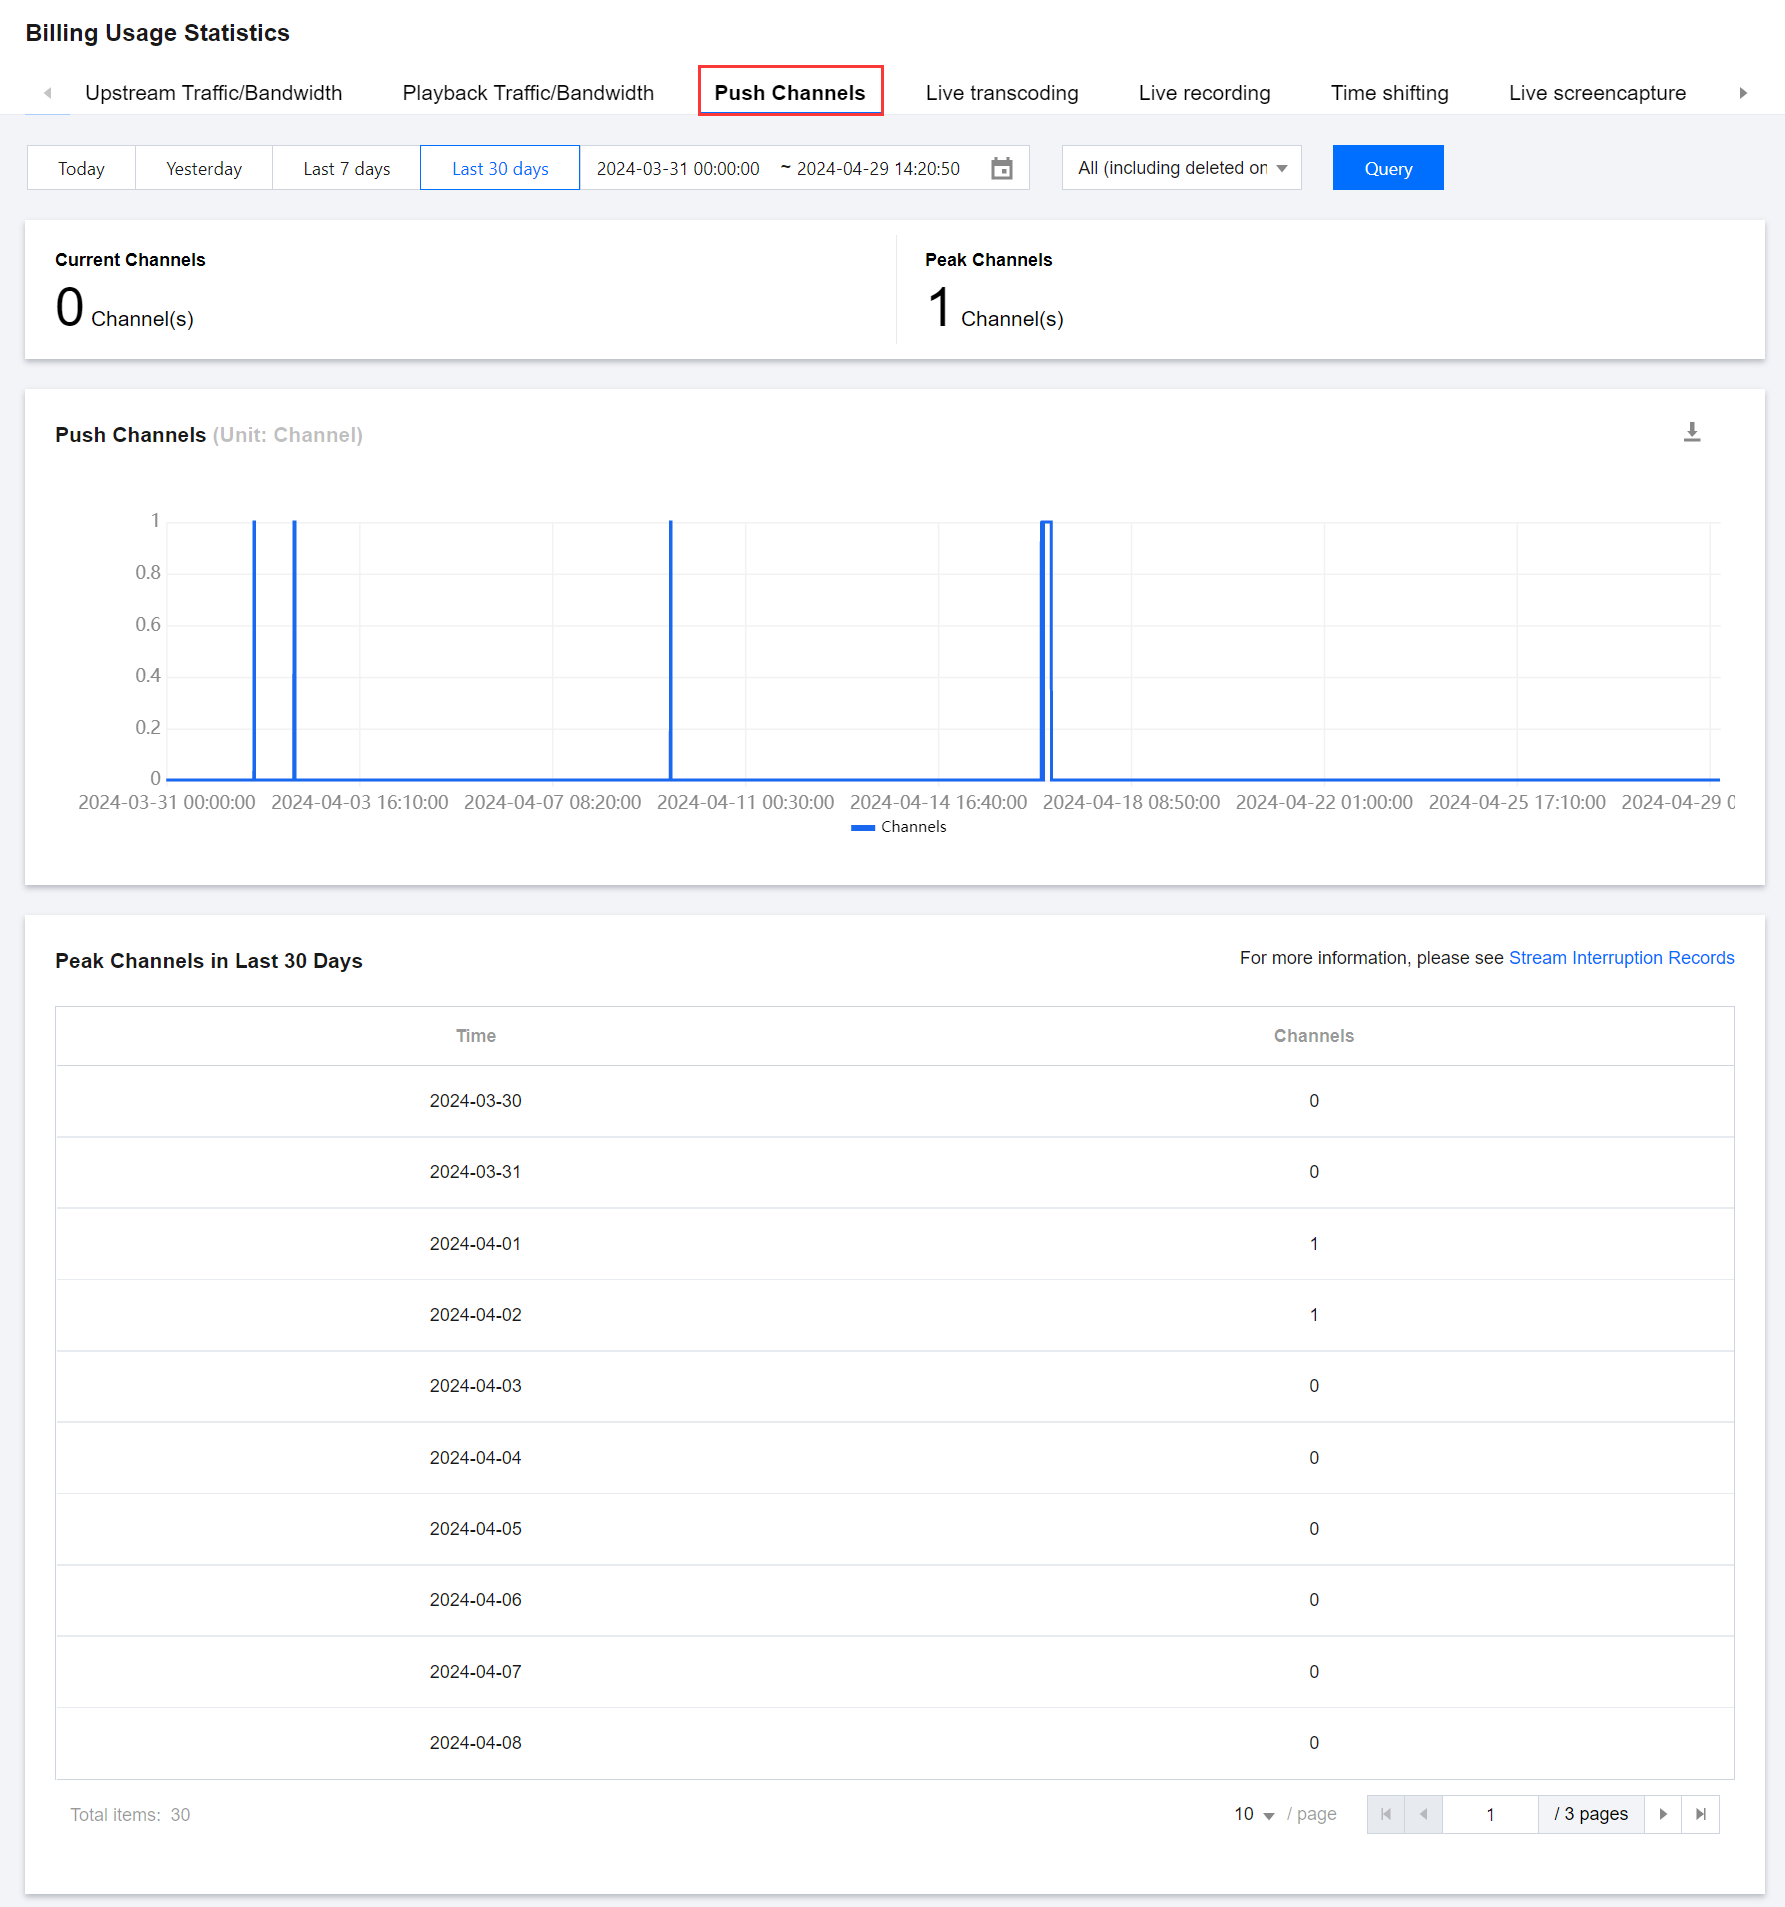
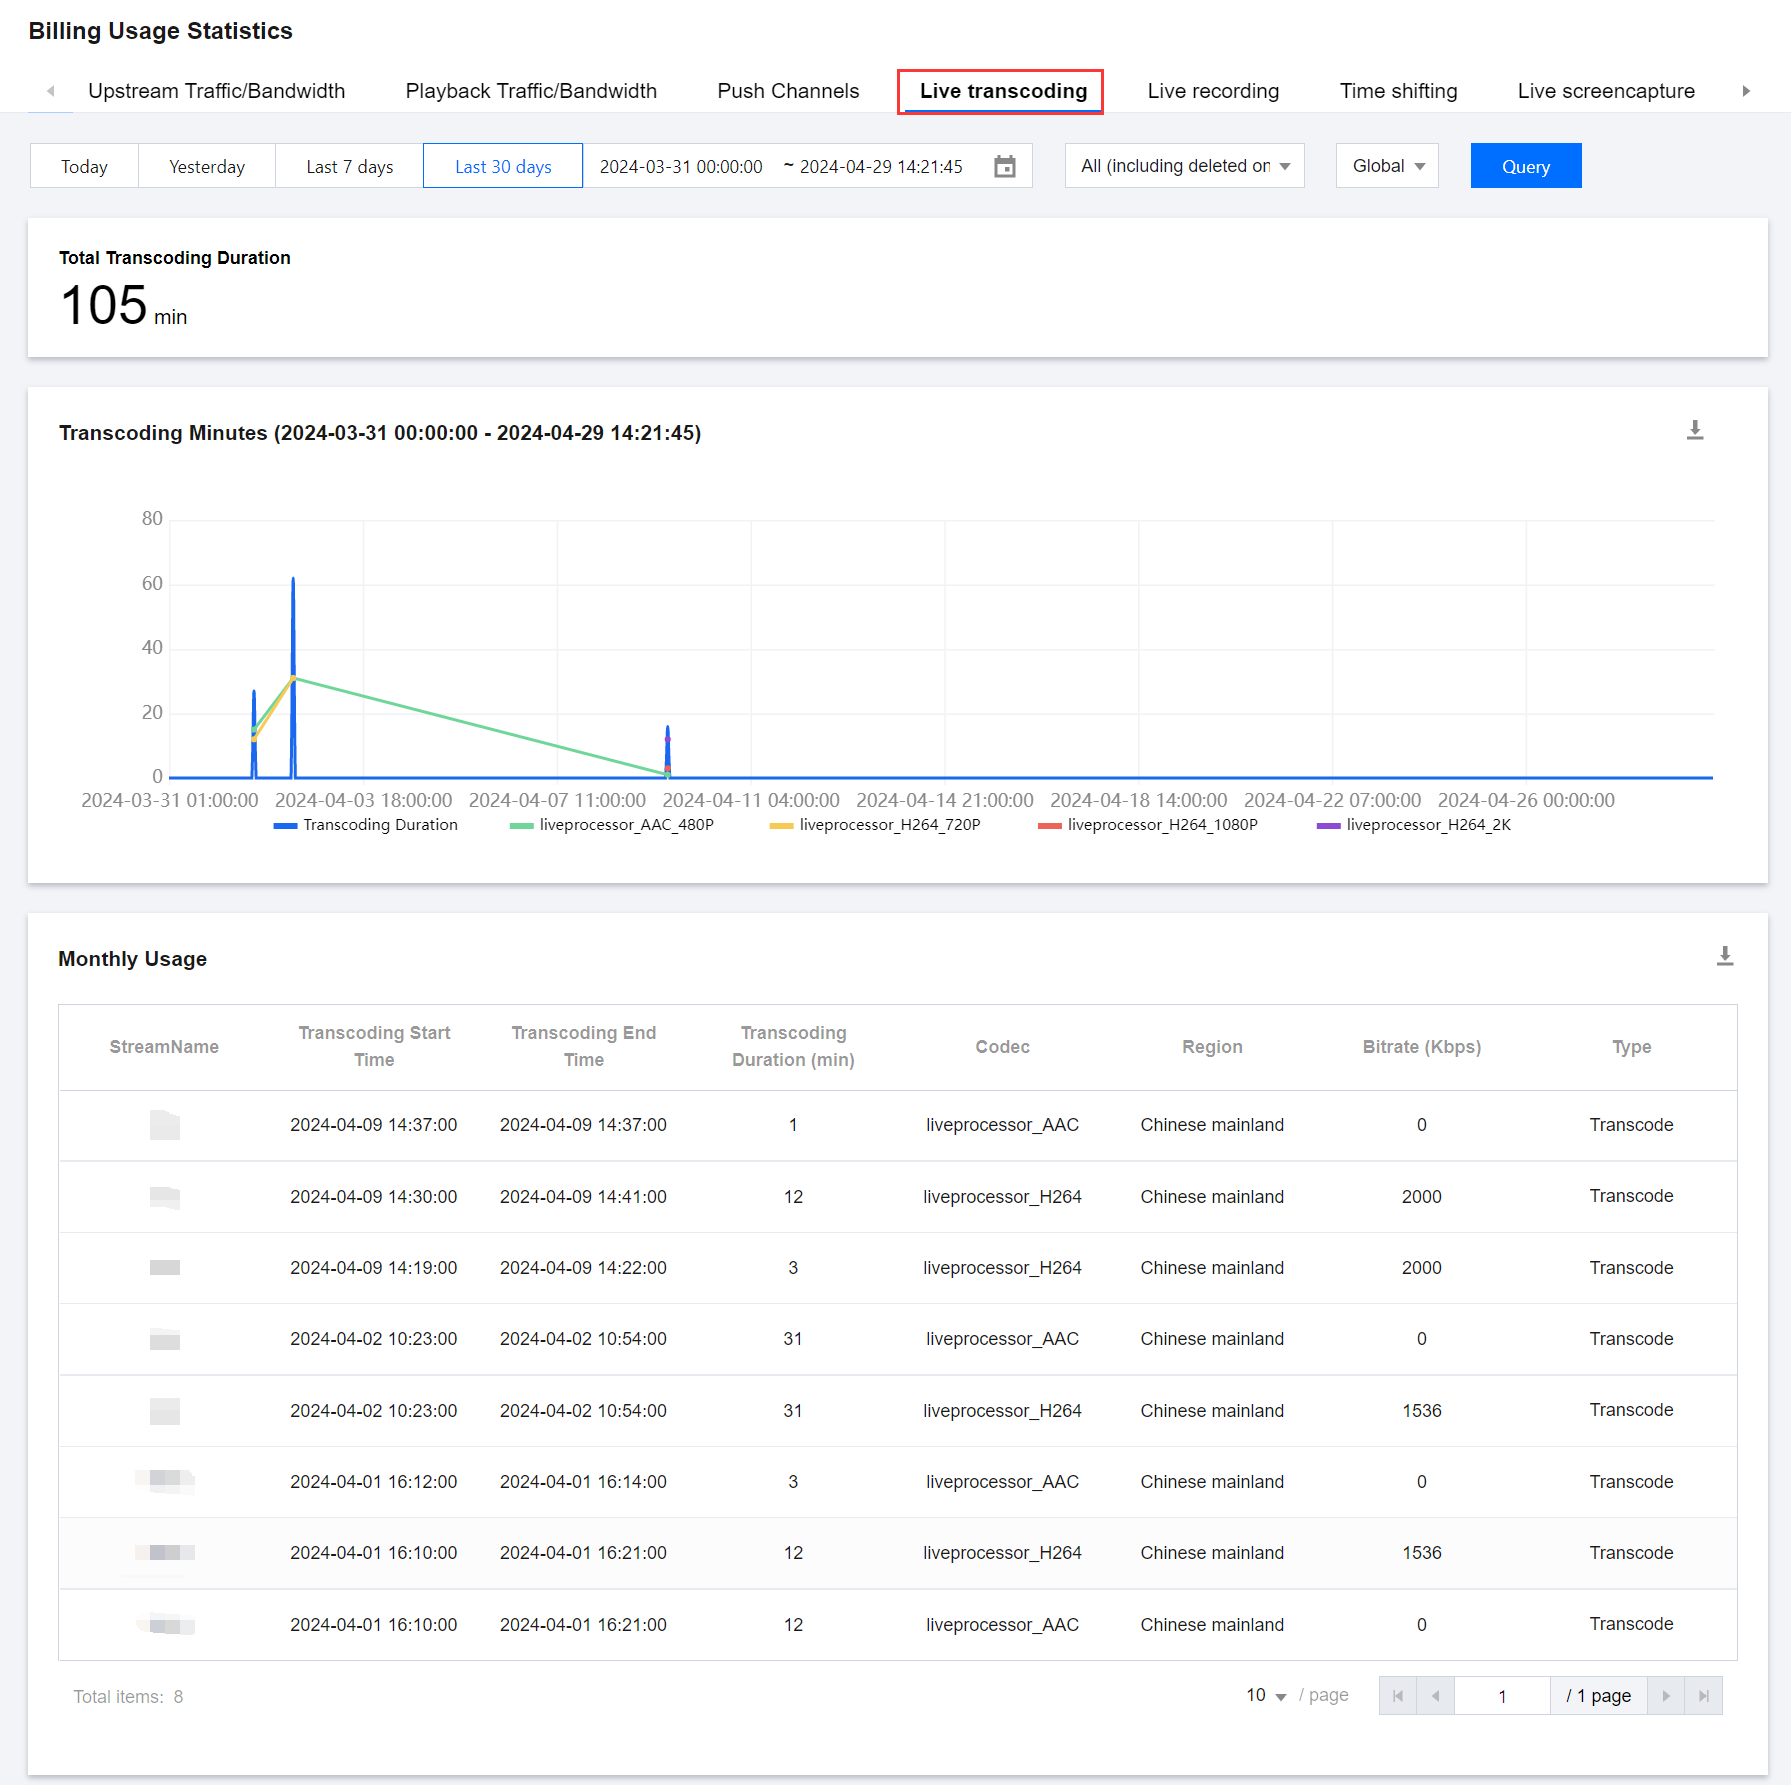
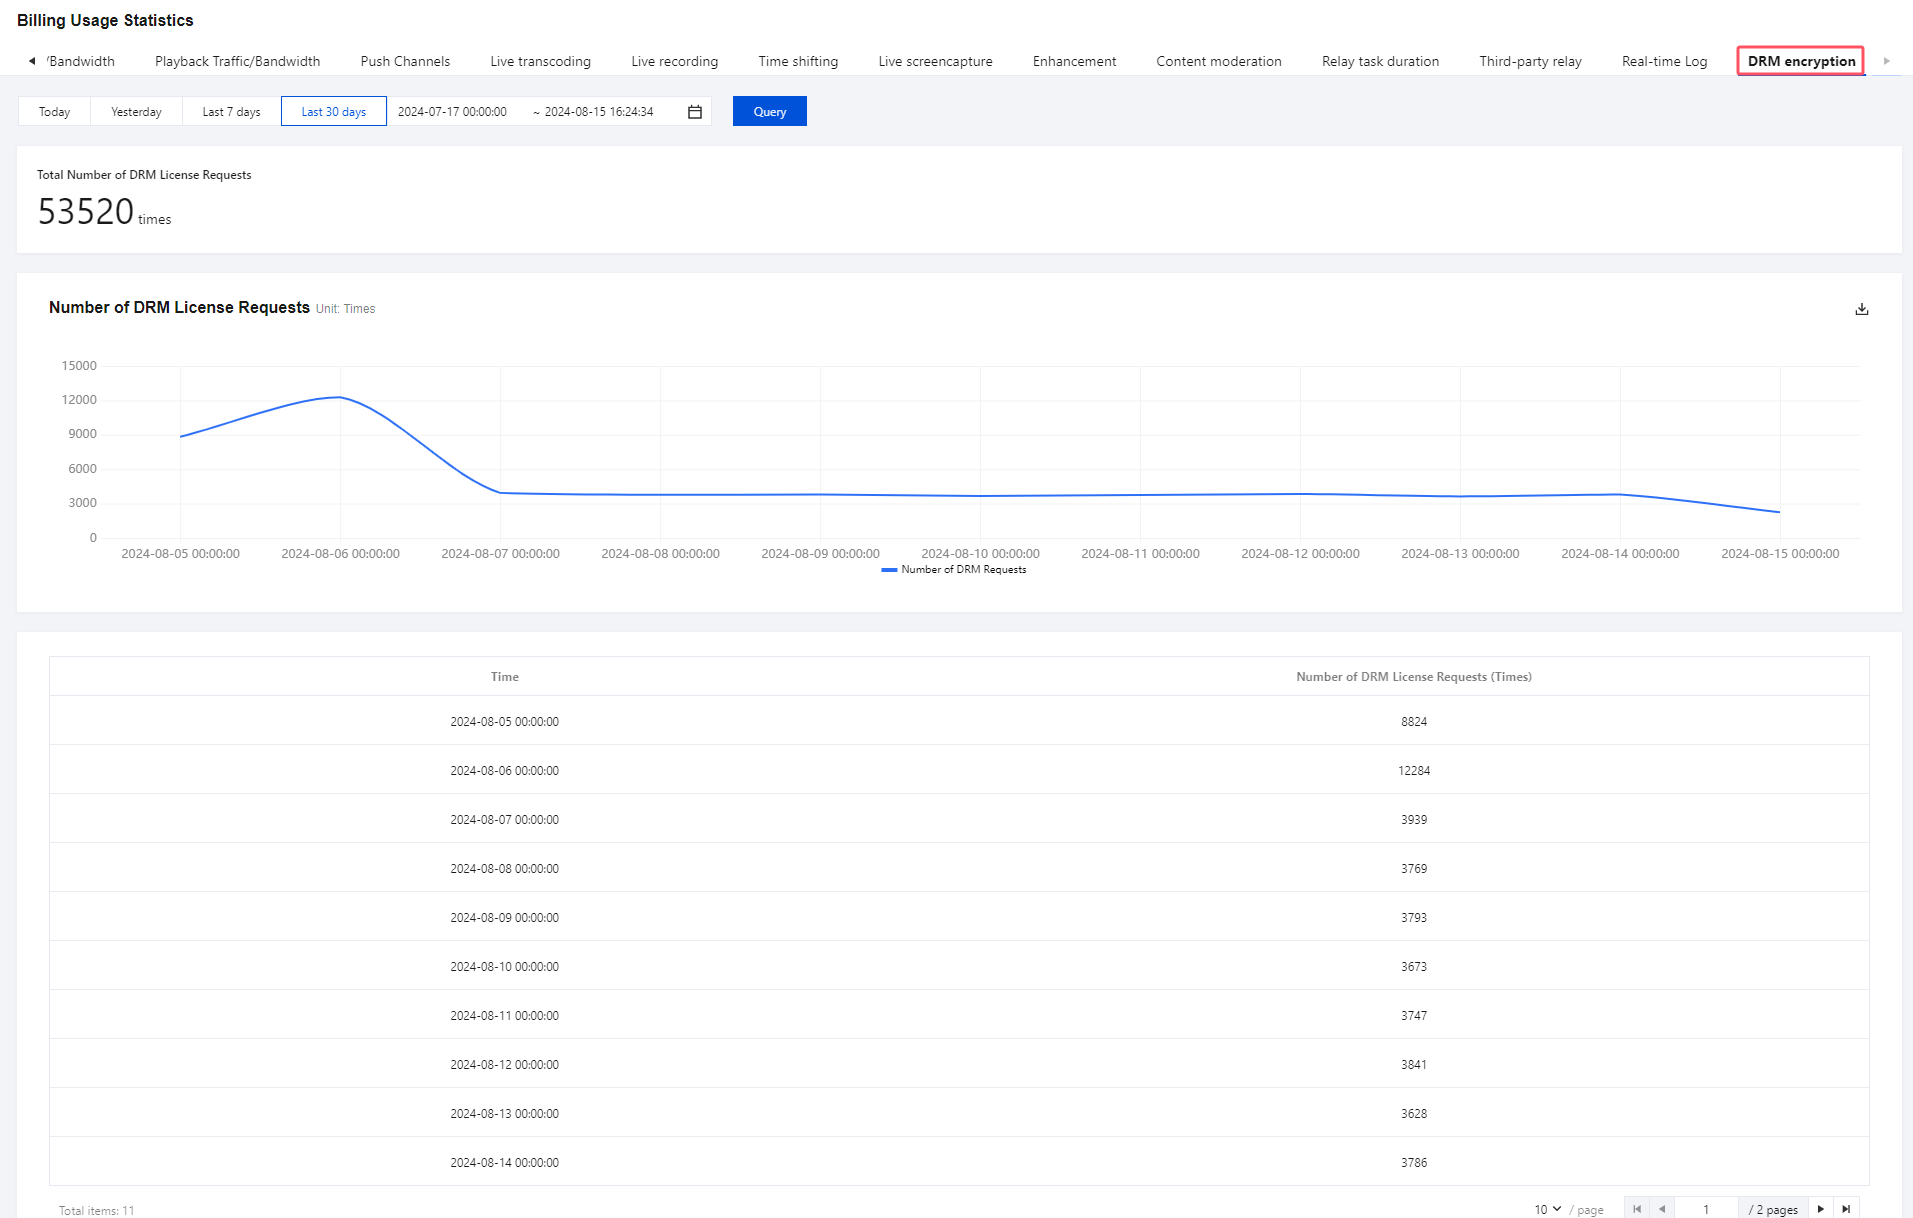
The Tencent Cloud console provides a billing usage statistics query feature for Live Video Broadcasting (LVB) and Live Event Broadcasting (LEB). If you want to know the usage of services such as upstream traffic/bandwidth, playback traffic/bandwidth, push channels, live transcoding, live recording, time shifting, live screencapture, enhancement, content moderation, relay task duration, third-party relay, real-time log, and DRM encryption, you can view the relevant data in Statistics > Billing Usage Statistics in the Cloud Streaming Services (CSS) console. You can view data related to CSS service usage in the last month.
Billing Details
Billable Service | Statistical Item | Description |
Upstream traffic/bandwidth | Upstream traffic | Upstream traffic consumed for push during the selected time range |
| Peak upstream bandwidth | Peak bandwidth used for push during the selected time range |
| Upstream traffic/bandwidth line chart | Upstream traffic/bandwidth usage on a 5-minute basis |
| Details | Hourly upstream traffic/bandwidth consumption over the last 30 days |
Playback traffic/bandwidth | Playback traffic | Downstream traffic consumed for playback during the selected time range |
| Peak playback bandwidth | Peak bandwidth used for playback during the selected time range |
| Playback traffic/bandwidth line chart | Downstream traffic/bandwidth usage on a 5-minute basis. You can choose to view the usage of LVB or LEB. |
| Details | Hourly playback traffic/bandwidth consumption over the last 30 days |
Push channels | Current channels | Current number of push channels |
| Peak channels | Maximum number of push channels |
| Push channel line chart | Number of push channels on a 5-minute basis |
| Peak channels in last 30 days | Highest number of channels per day in the last 30 days |
Live transcoding | Total transcoding duration | Total transcoding duration during the selected time range |
| Transcoding duration line chart | Transcoding durations on a 5-minute basis |
| Monthly usage | Transcoding detail information of stream dimension in the last 30 days |
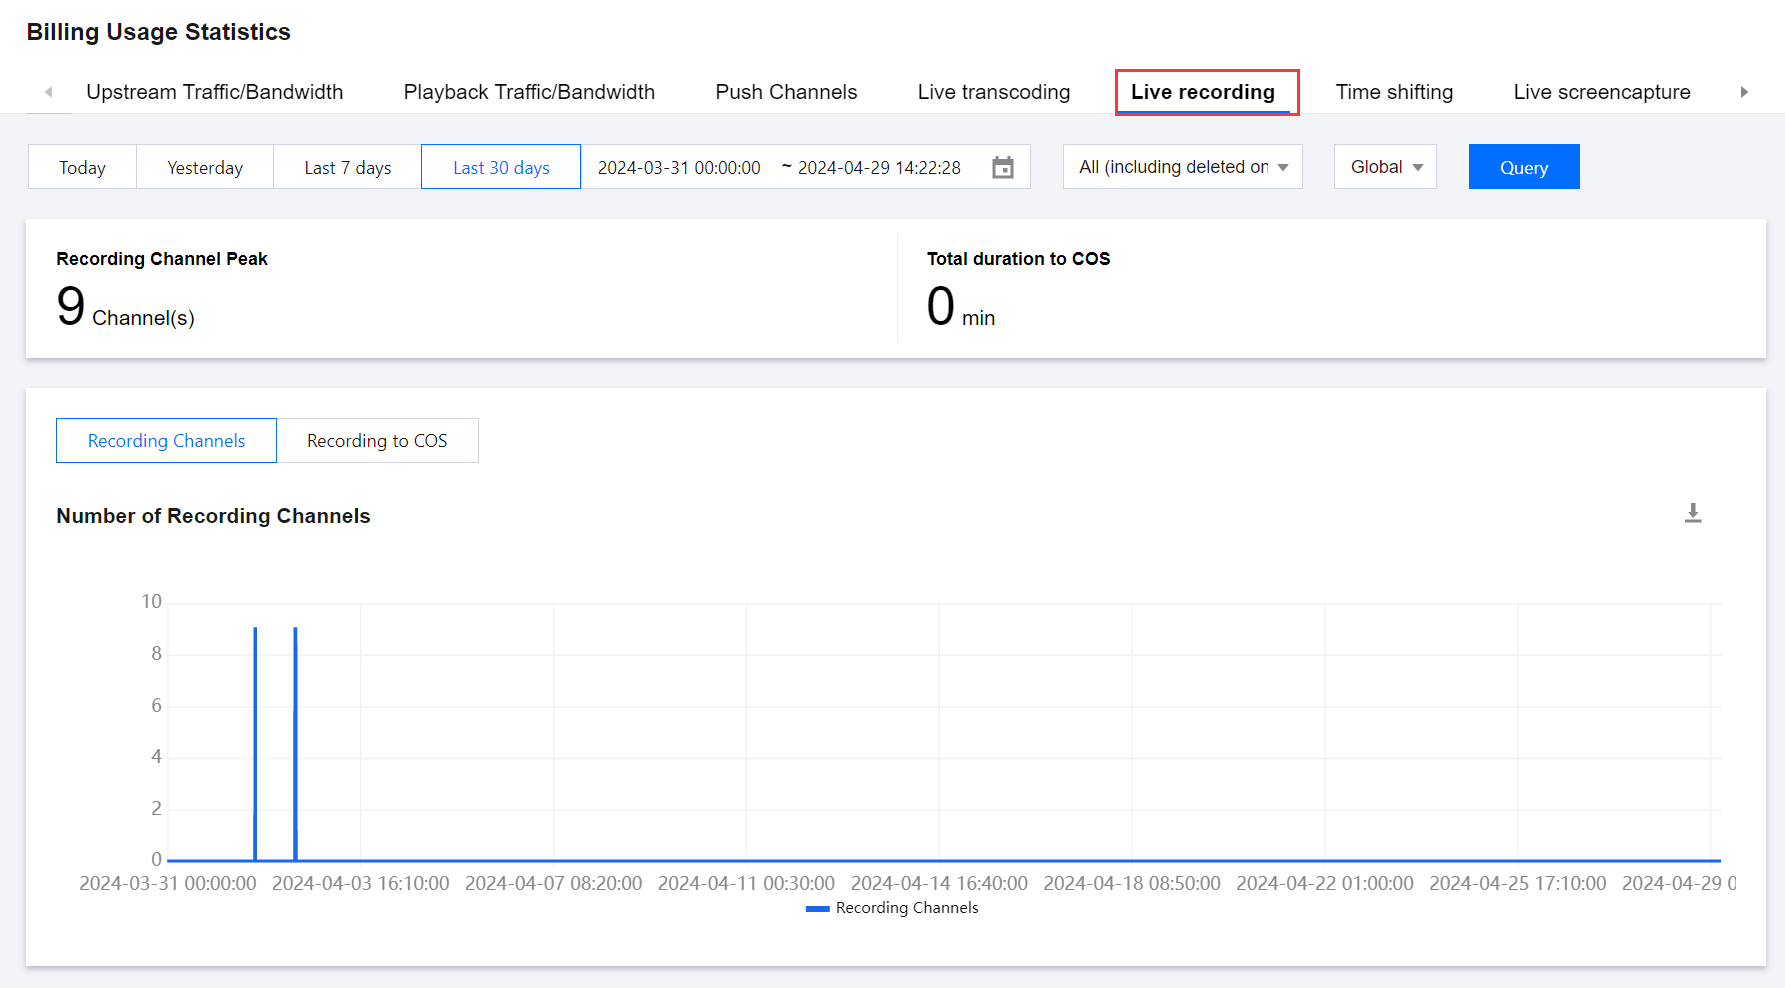
Live recording | Recording channel peak | Highest number of concurrent recording channels during the selected time range |
| Total duration to COS | The total duration of recording shipping to COS during the query period |
| Recording channel peak/Total duration to COS line chart | Highest number of concurrent recording channels on a 5-minute basis/Cumulative data on the duration of recording shipping to COS |
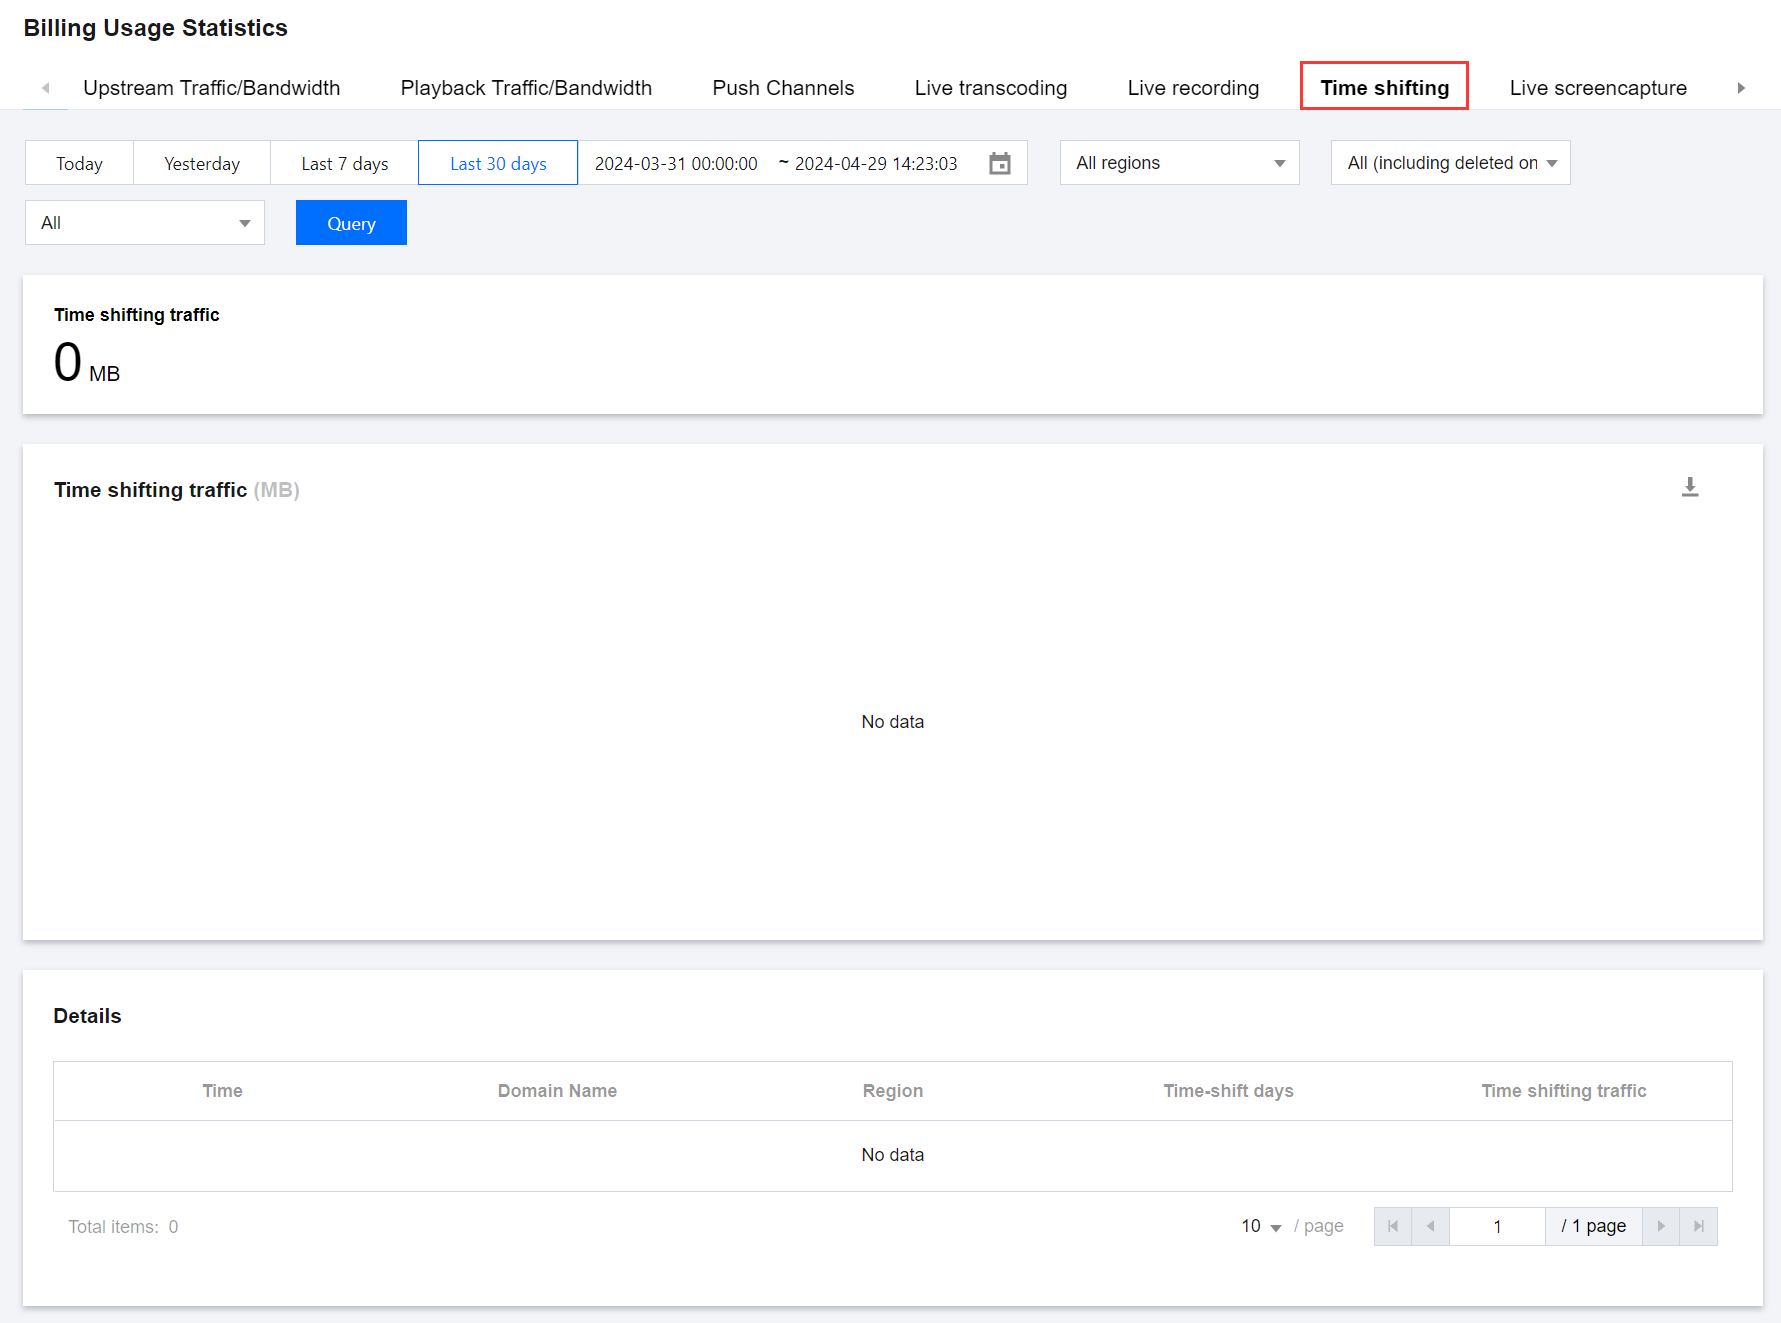
Time shifting | Time shifting traffic | Time shifting write volume during the query period |
| Time shifting traffic line chart | Cumulative data of time shifting write volume on a 5-minute basis |
| Details | Time shifting write volume by domain name and time shifting day |
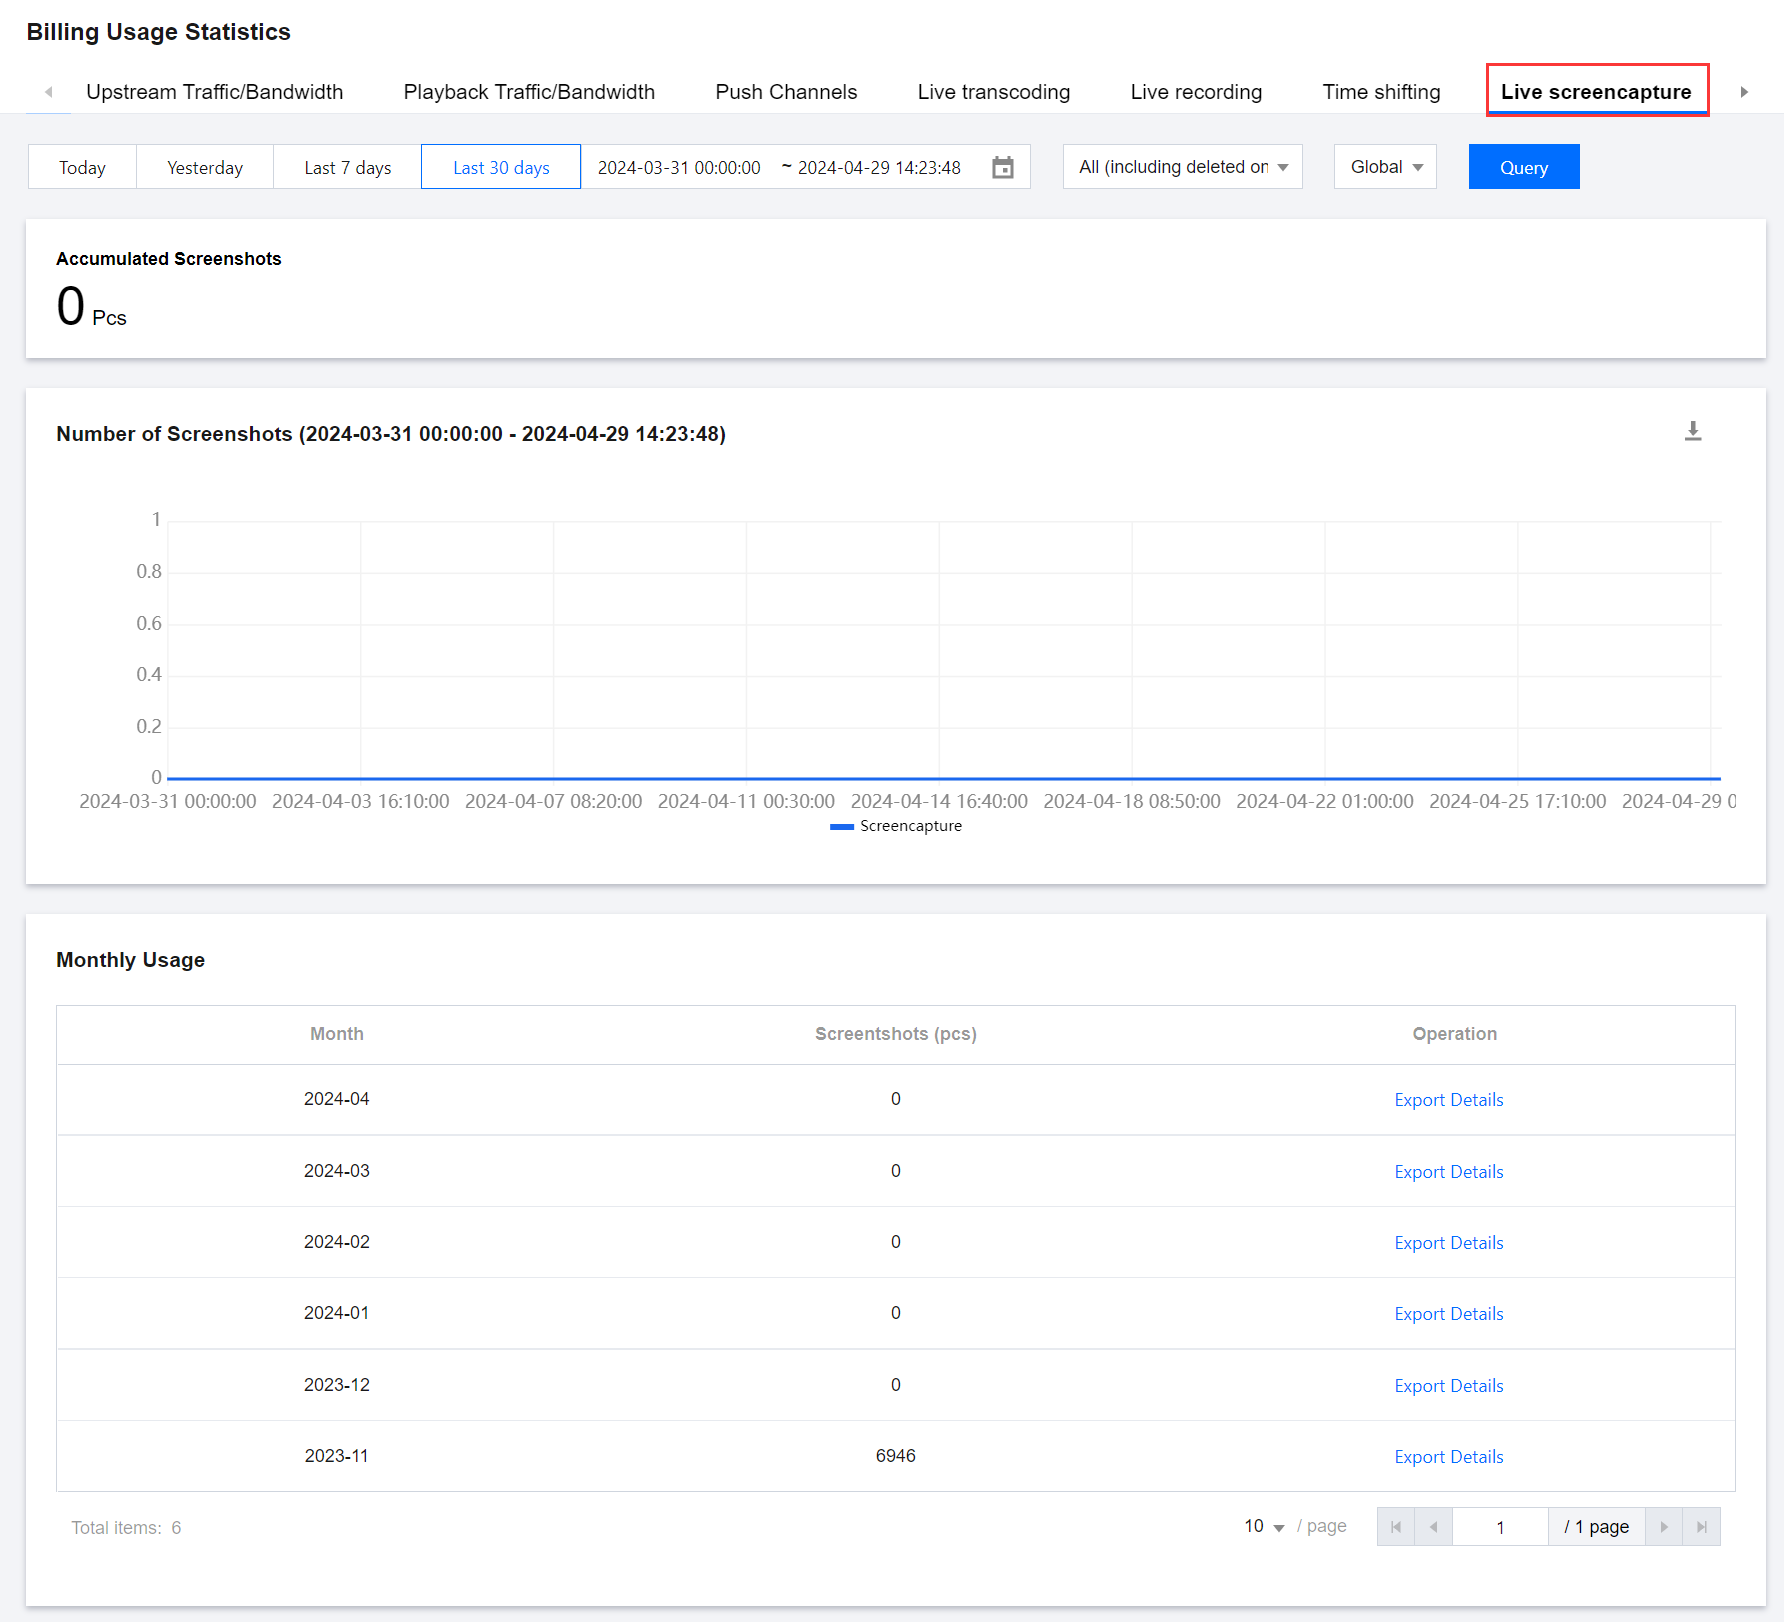
Live screencapture | Accumulated screenshots | Total number of screenshots taken during the selected time range |
| Screenshot number line chart | Number of screenshots on a 5-minute basis |
| Monthly usage | Total number of screenshots each month in the last six months |
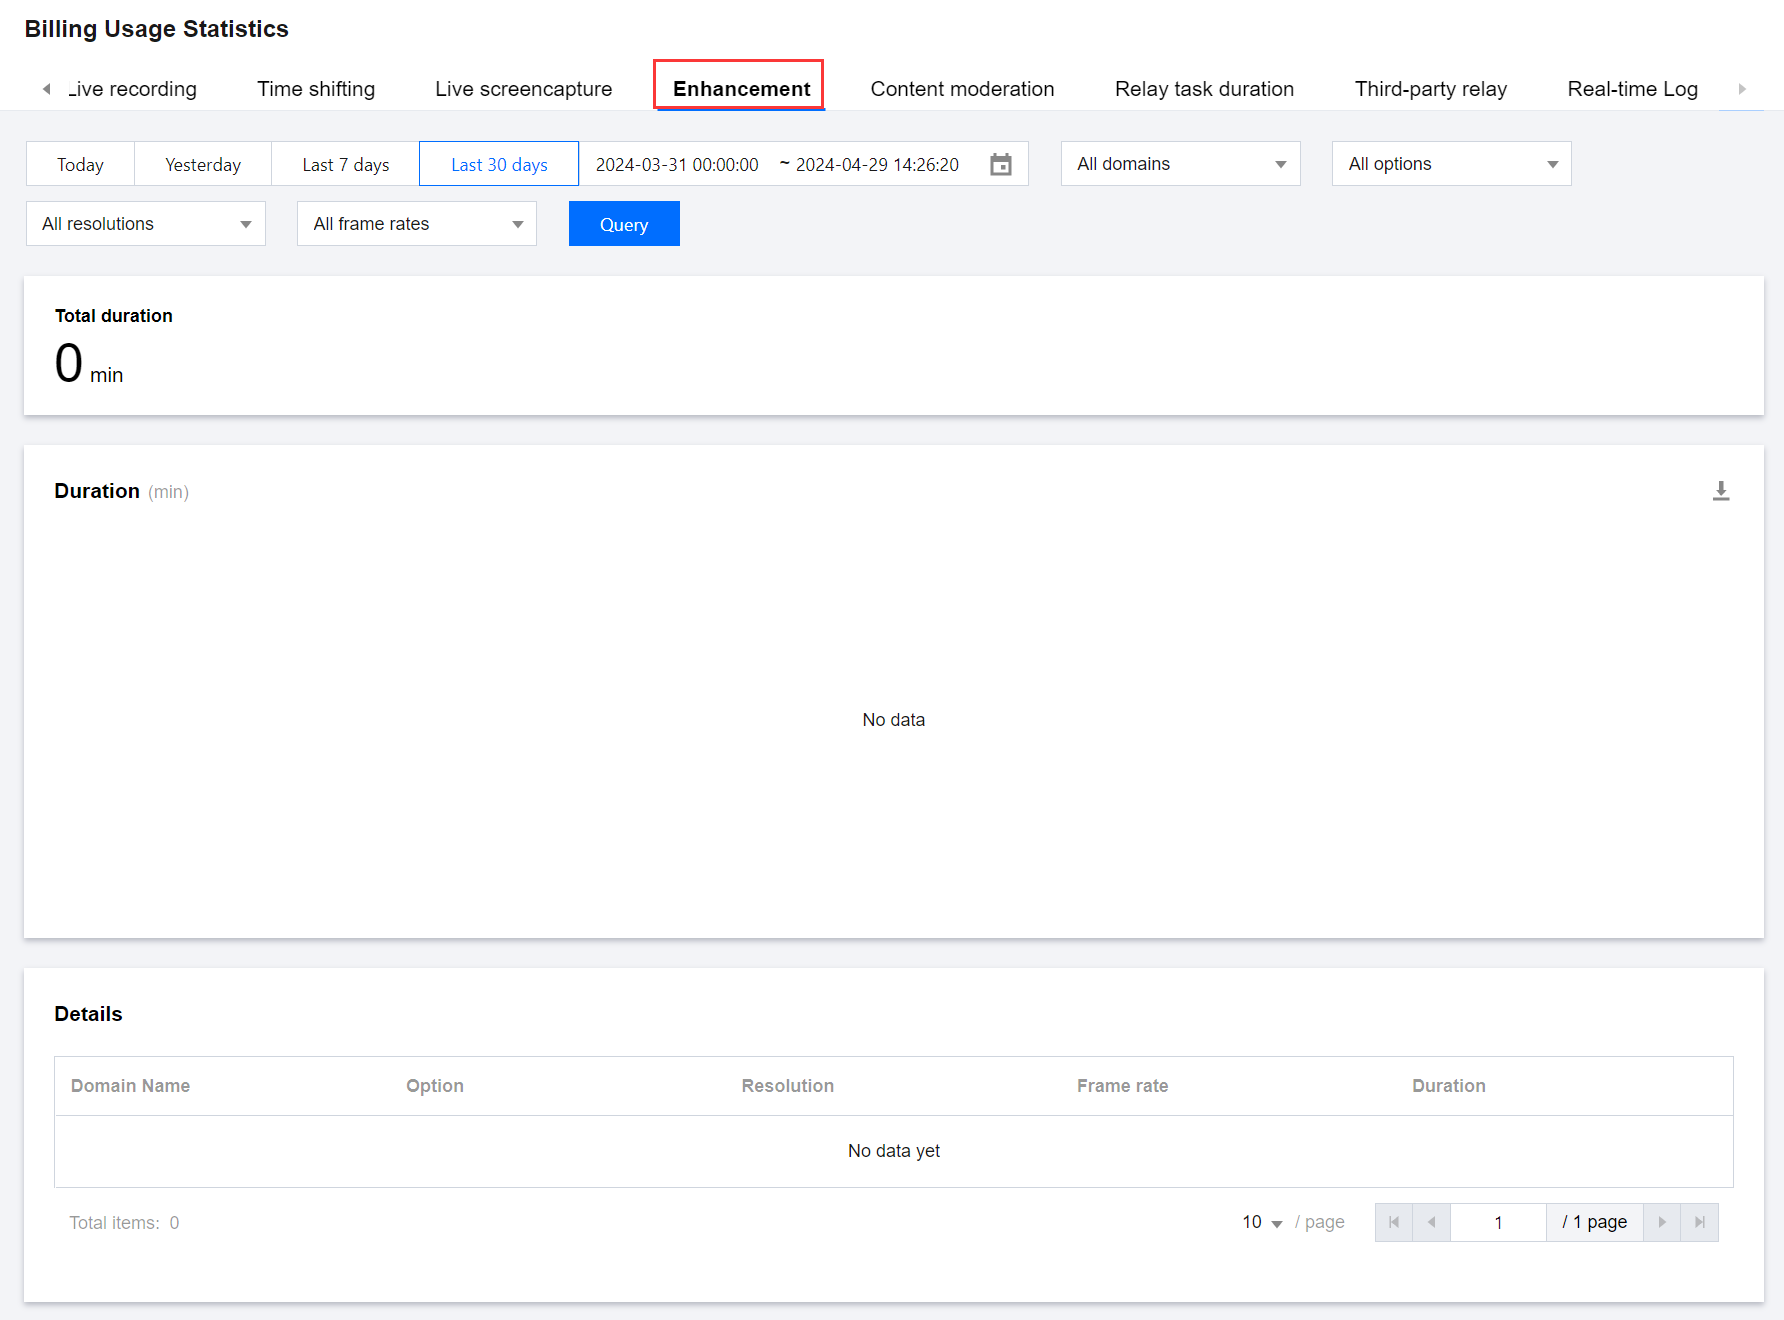
Enhancement | Total duration | Total enhancement duration during the query period |
| Duration line chart | Enhancement duration data on a 5-minute basis |
| Details | Live streaming enhancement consumption data in the last 30 days |
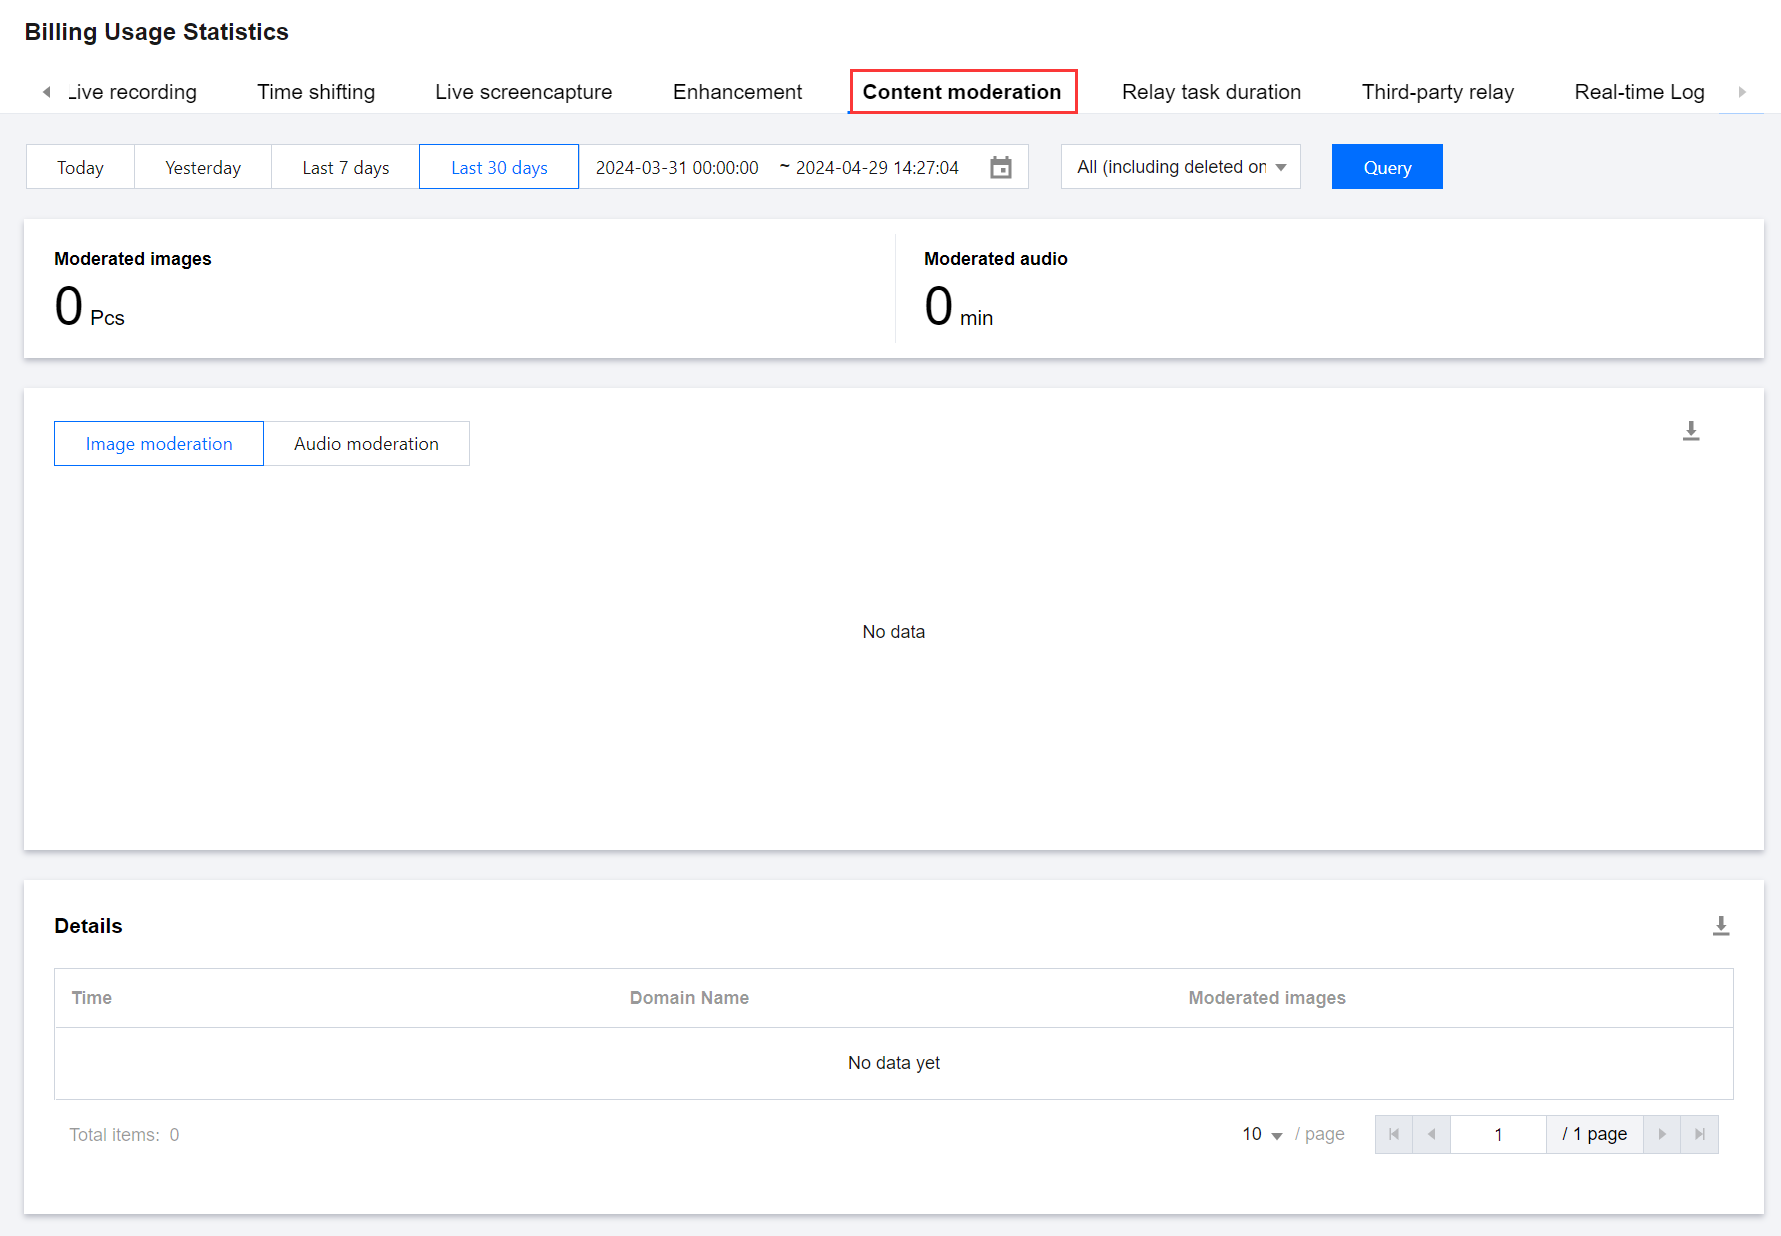
Content moderation | Moderated images | Total number of images generated by image moderation during the query period |
| Moderated audio | Total duration generated by audio moderation during the query period |
| Image moderation/Audio moderation line chart | Cumulative data of image moderation/audio moderation on a 5-minute basis |
| Details | Content moderation records in the last 30 days |
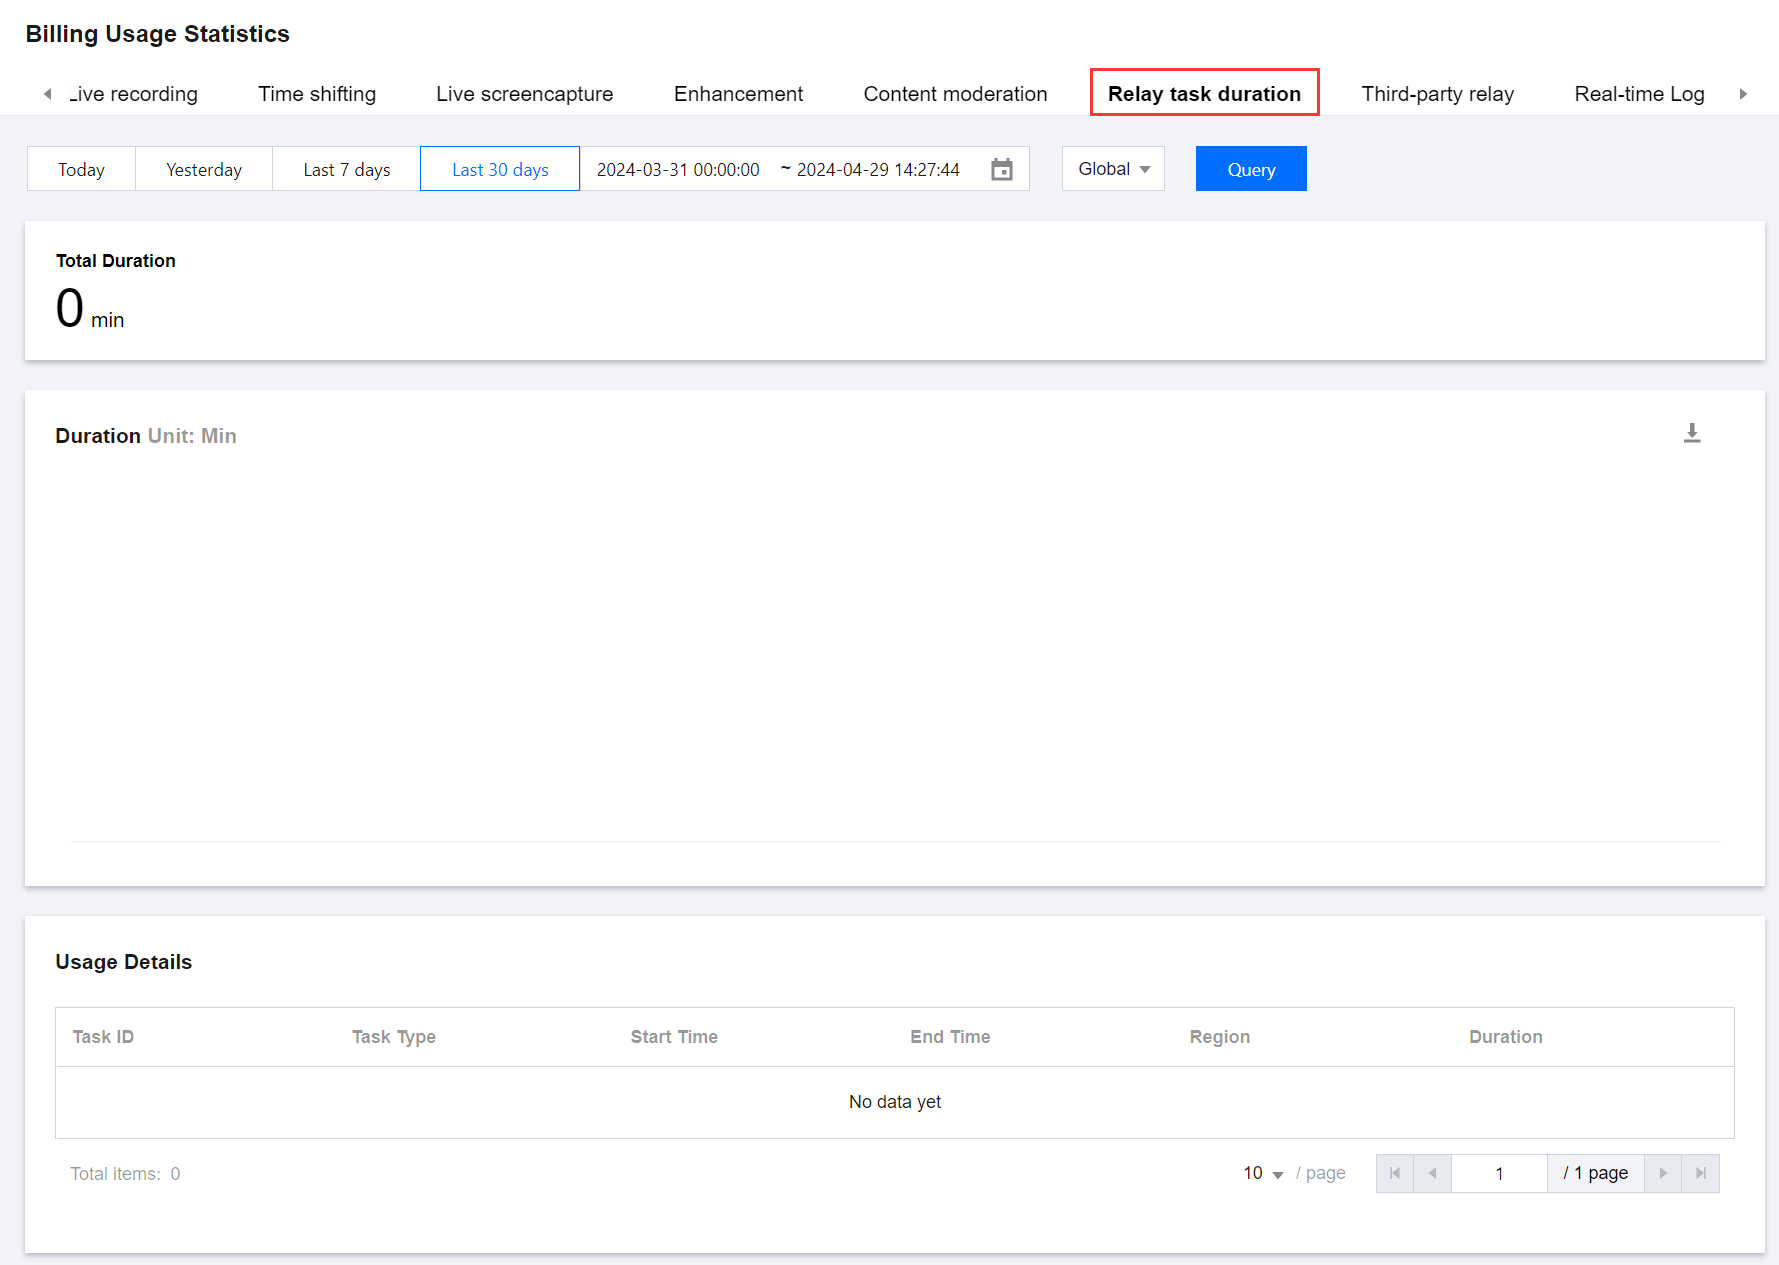
Relay task duration | Total duration | Total duration of relay tasks during the selected time range |
| Duration line chart | Cumulative task duration data on a 5-minute basis |
| Usage details | Detailed information such as task start time and end time by task dimension |
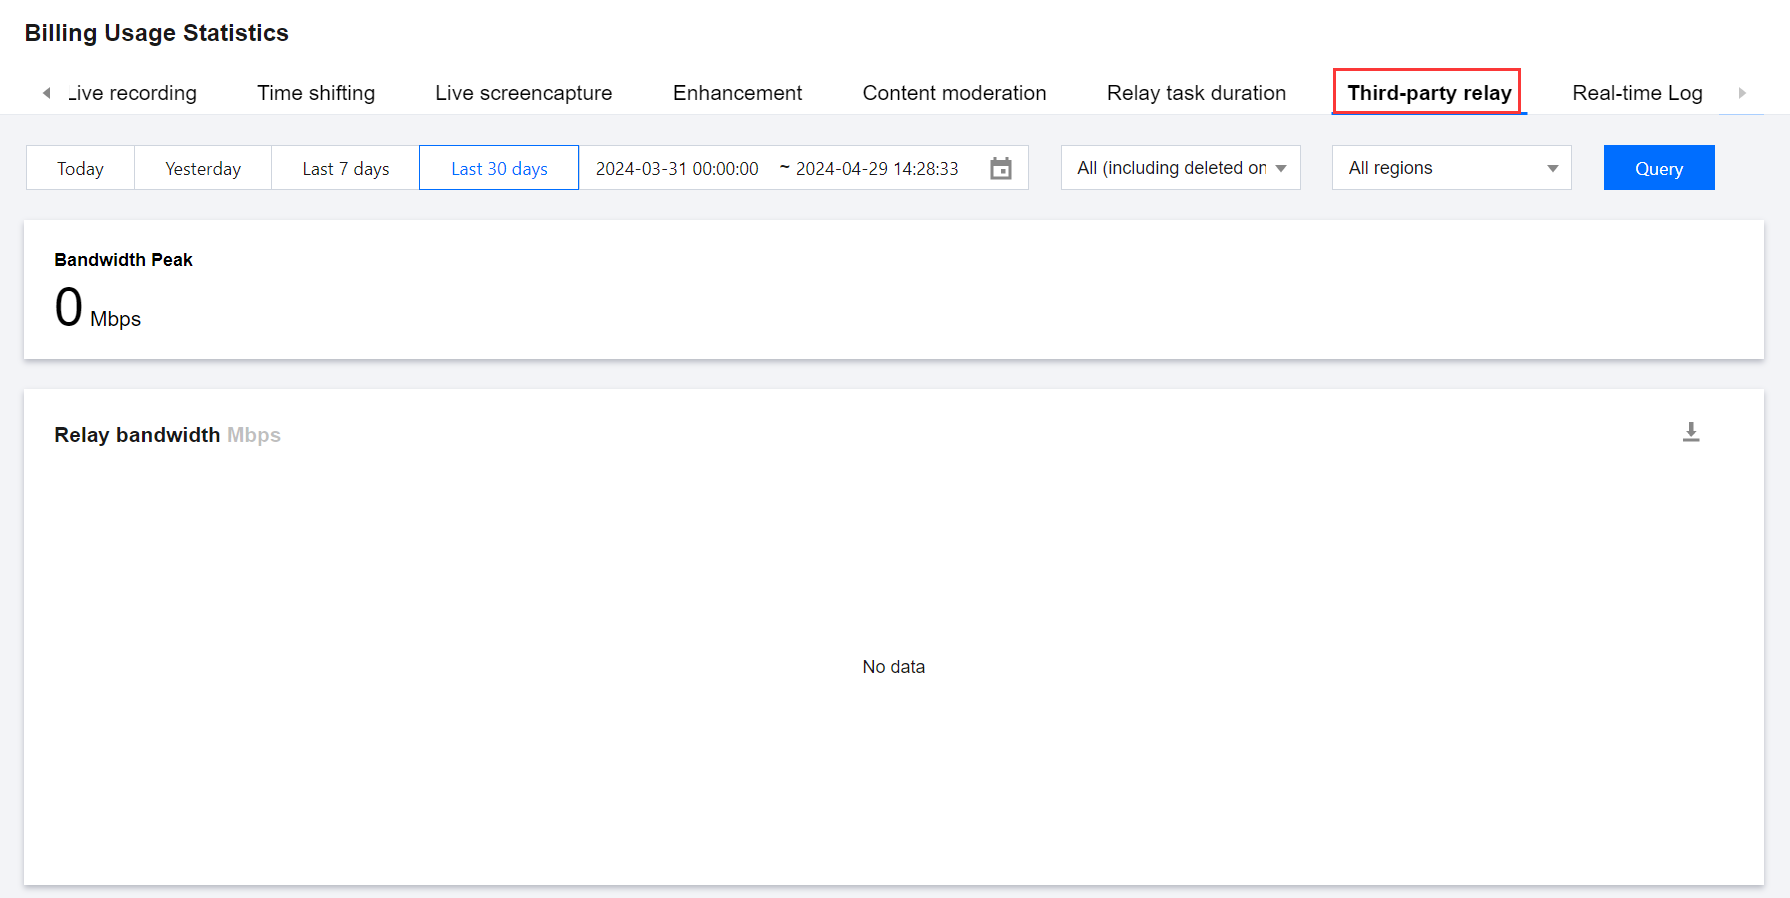
Third-party relay | Bandwidth peak | Peak bandwidth of the relay service during the query period |
| Relay bandwidth line chart | Peak bandwidth of the relay service on a 5-minute basis |
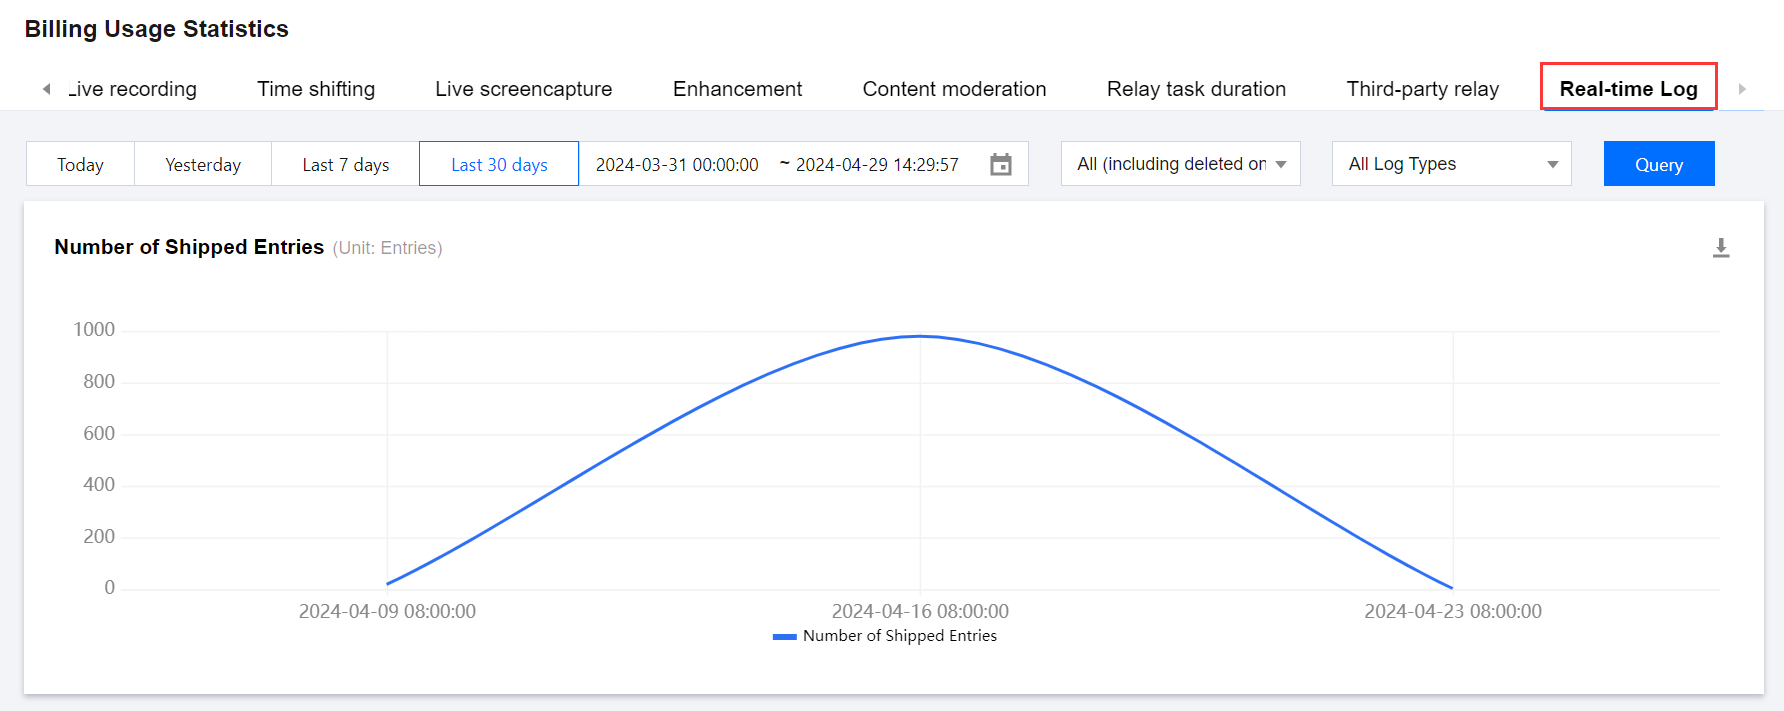
Real-time log |
Number of shipped entries | Total number of shipped entries for push logs/playback logs during the query period |
DRM encryption | Total number of DRM license requests | Total number of DRM license requests in the last 30 days |
| DRM license request line chart | Number of DRM license requests every 5 minutes |
Was this page helpful?
You can also Contact Sales or Submit a Ticket for help.
Yes
No

