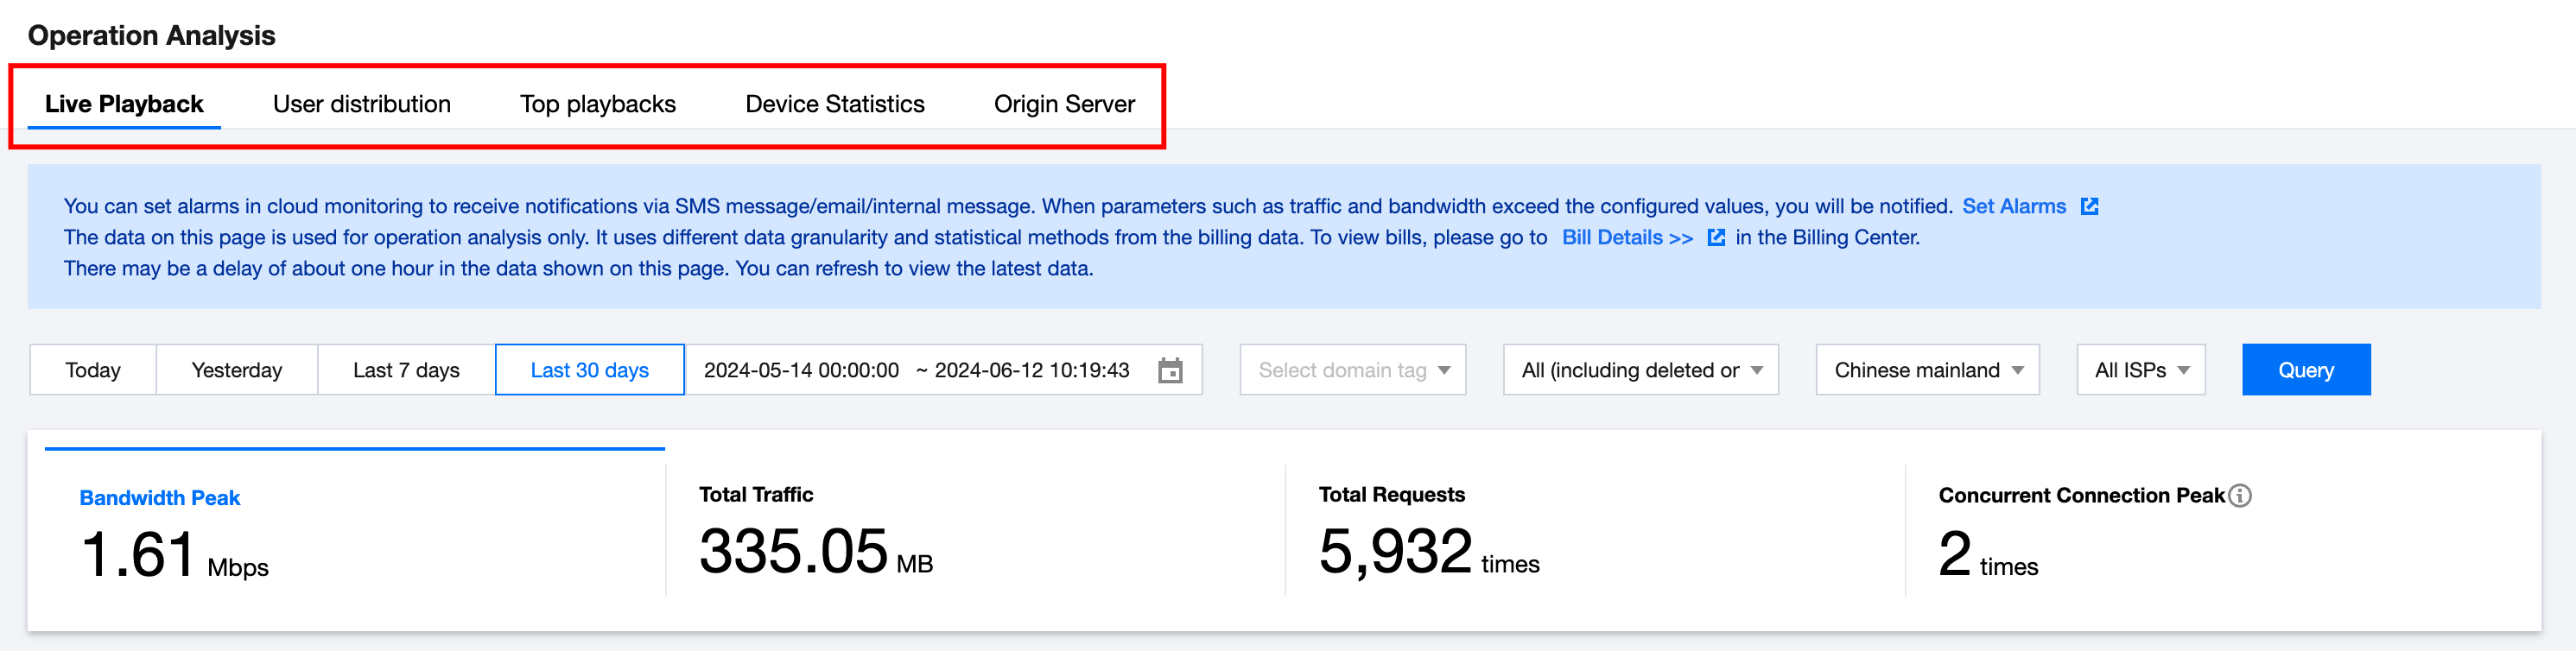
The CSS console provides the Operation Analysis page where you can view data related to Live Playback, User distribution, Top playbacks, Device Statistics, and Origin Server.
Note:
For the Live Playback and User distribution tabs, data is based on the user's location IP.
The Origin Server tab does not support querying data before February 18, 2022.
Data for outside the Chinese mainland is aggregated instead of ISP-specific.
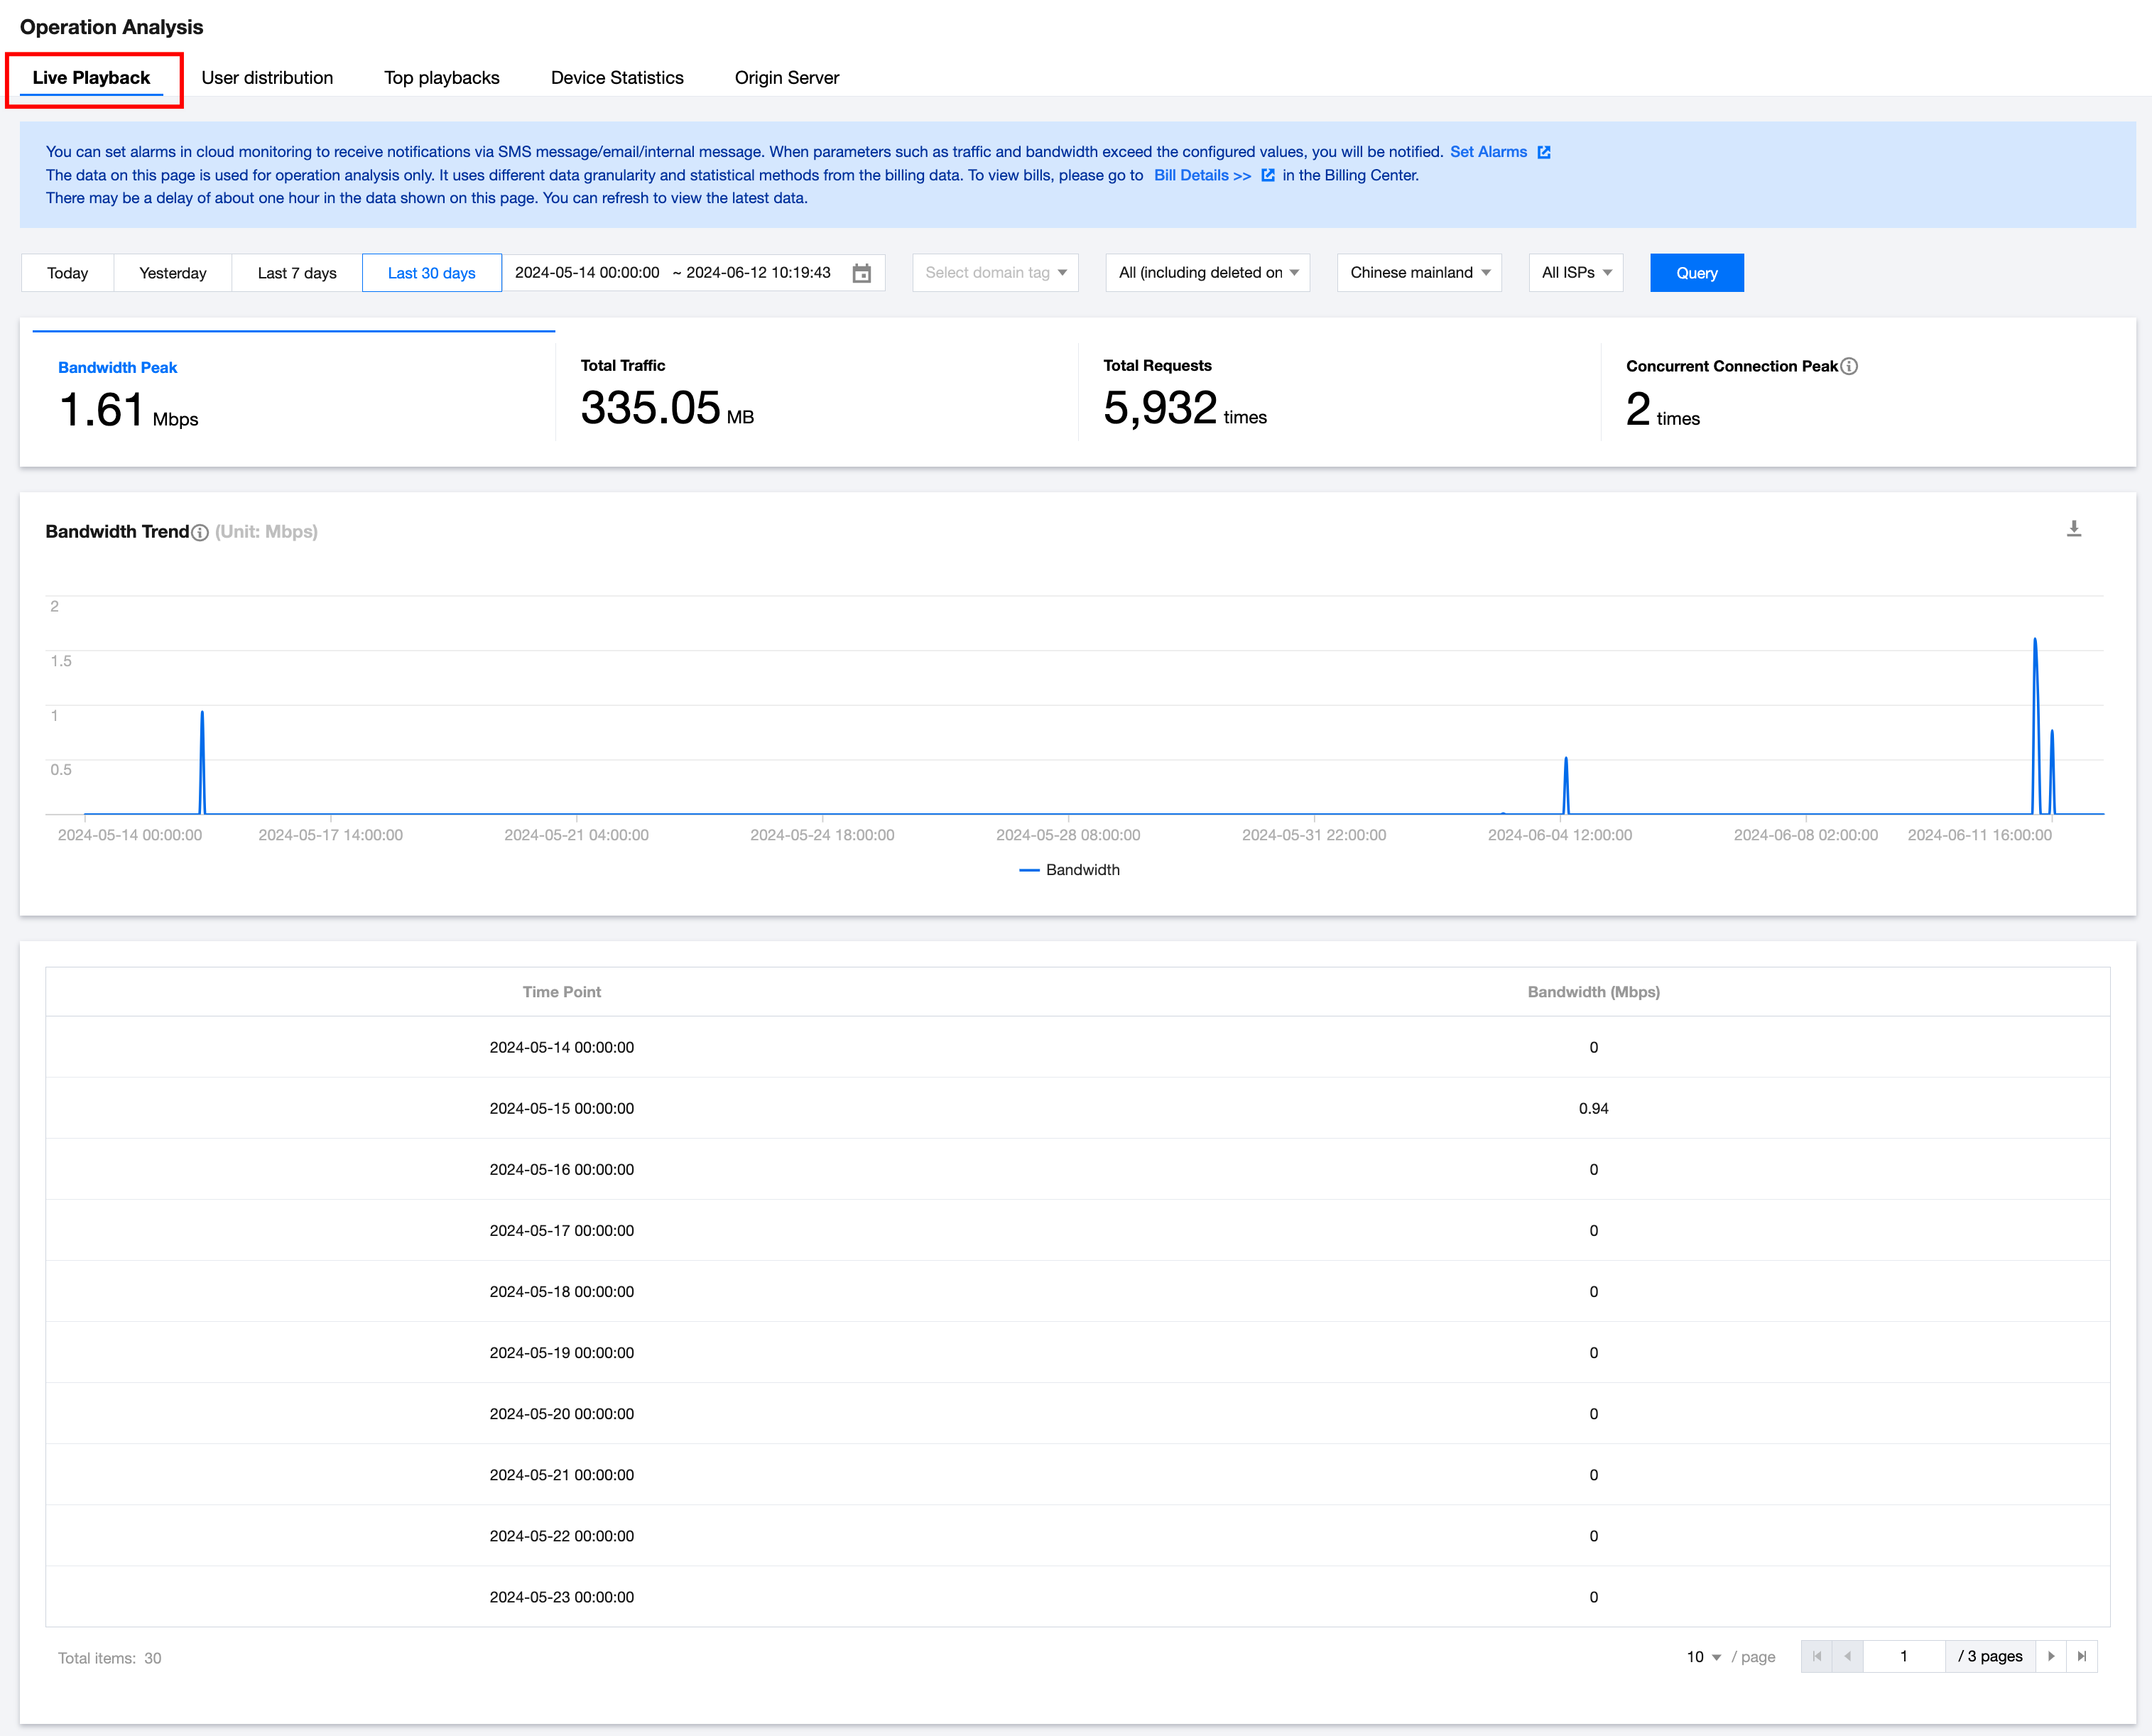
Live Playback
Under the Live Playback tab, you can view data on bandwidth peak, total traffic, total requests, and concurrent connection peak. It supports querying data at the domain name granularity and allows you to select regions and ISPs. You can query data for the last three months, and the maximum time span for each query is one month.
Statistical Item
Description
Bandwidth Peak
Peak bandwidth data generated by downstream playback of live streaming.
Total Traffic
Total traffic data generated by downstream playback of live streaming.
Total Requests
Total number of requests between the player and CSS platform during live streaming.
Concurrent Connection Peak
Peak concurrent connection data between players and the CSS platform during live streaming.
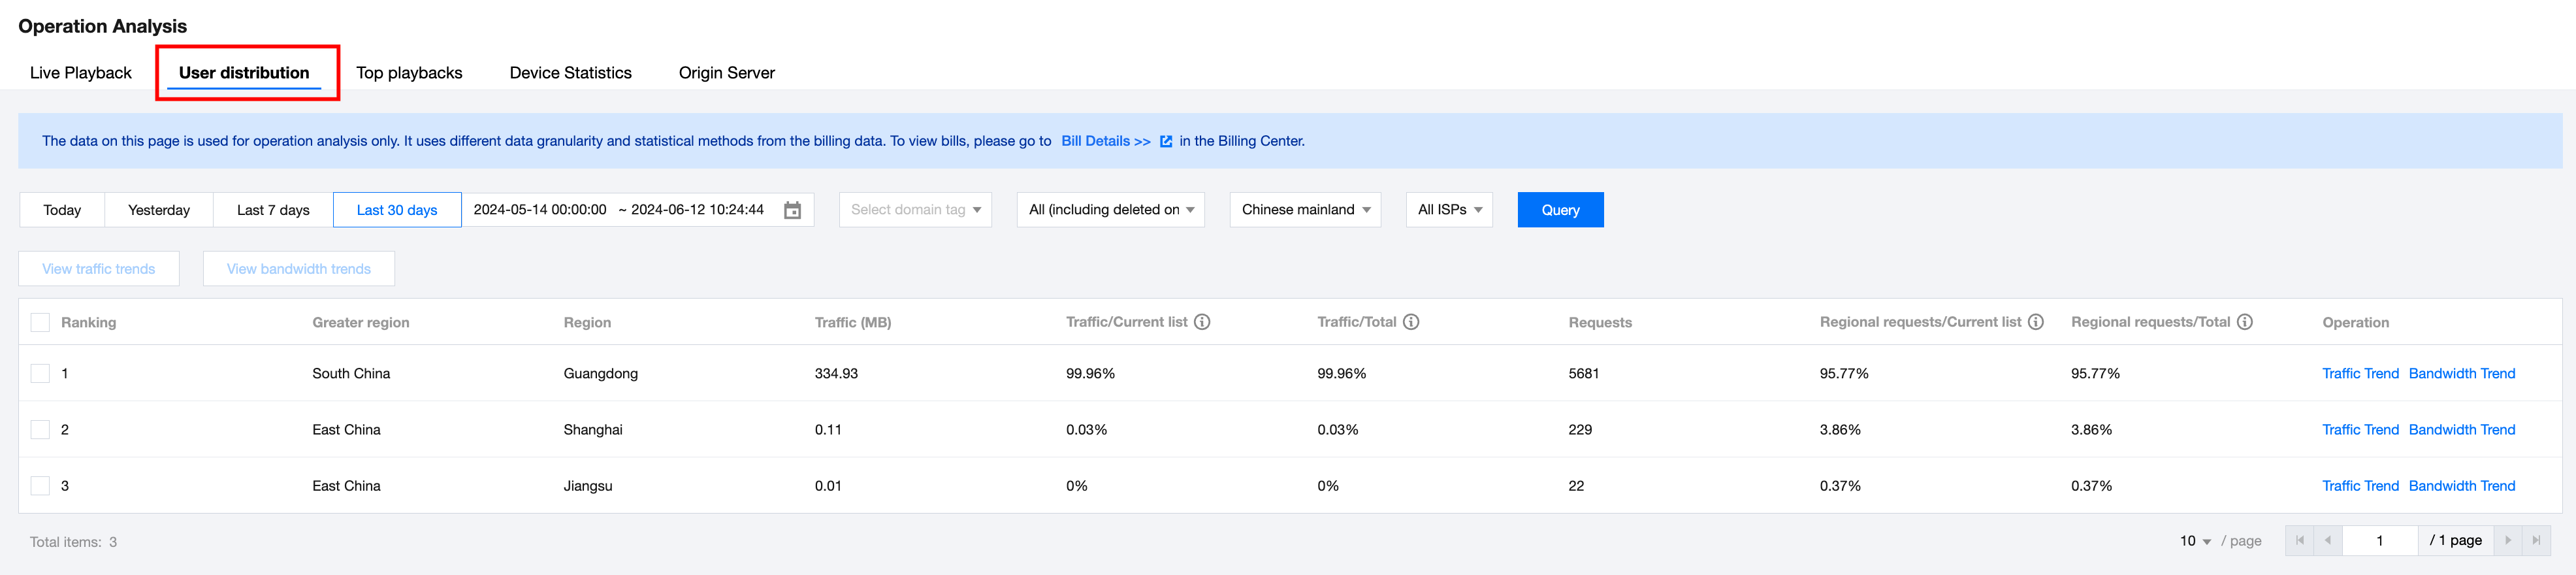
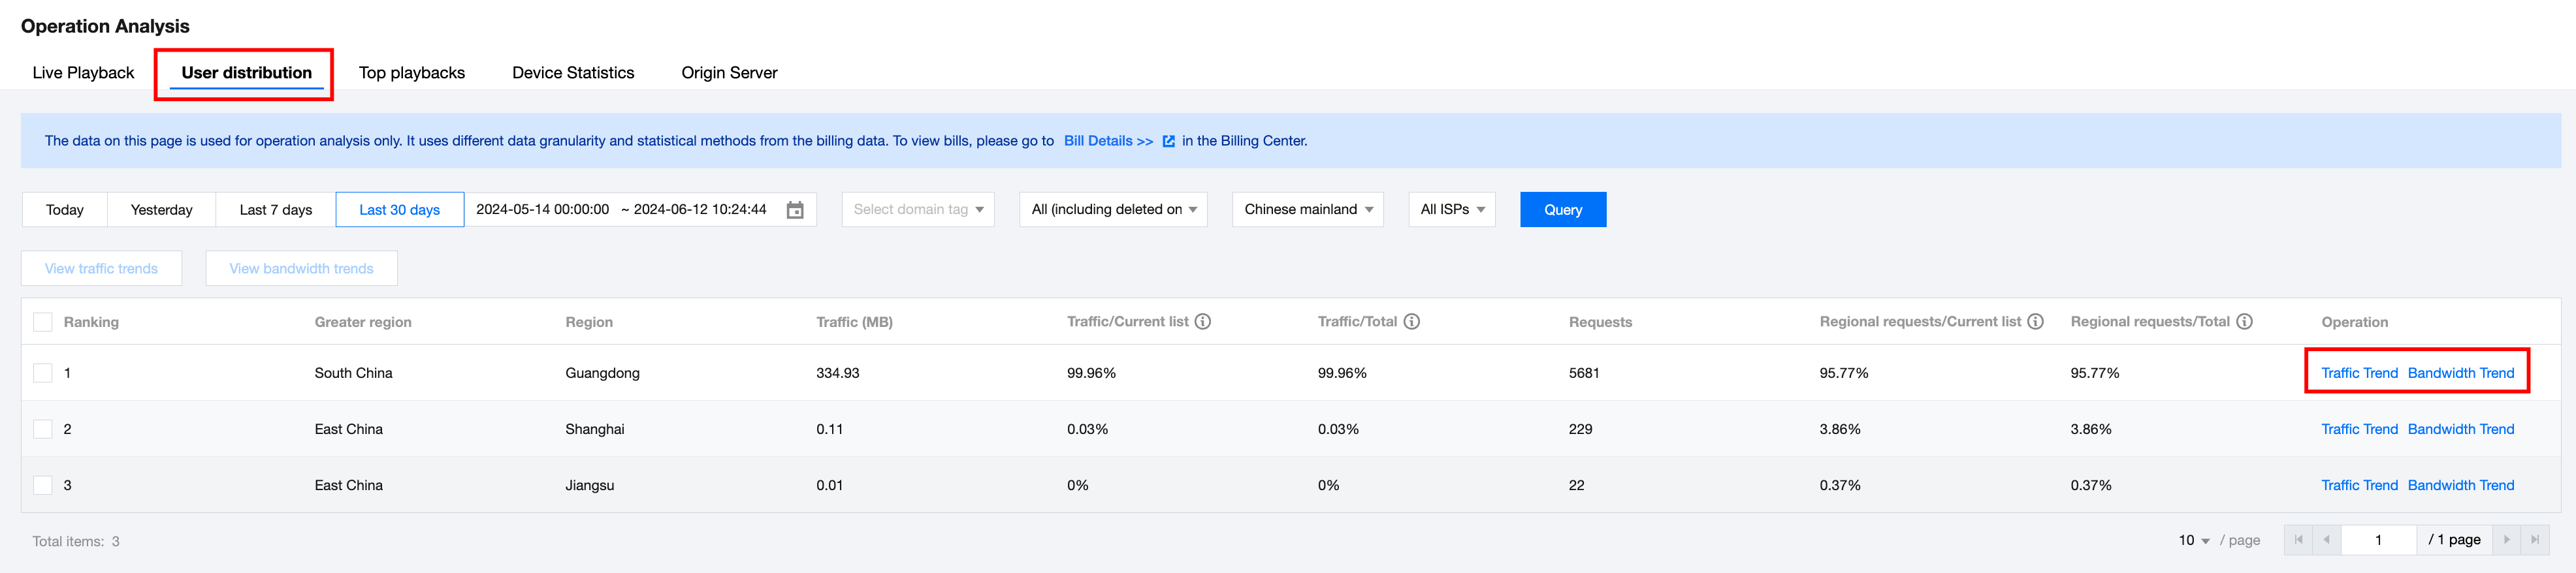
User Distribution
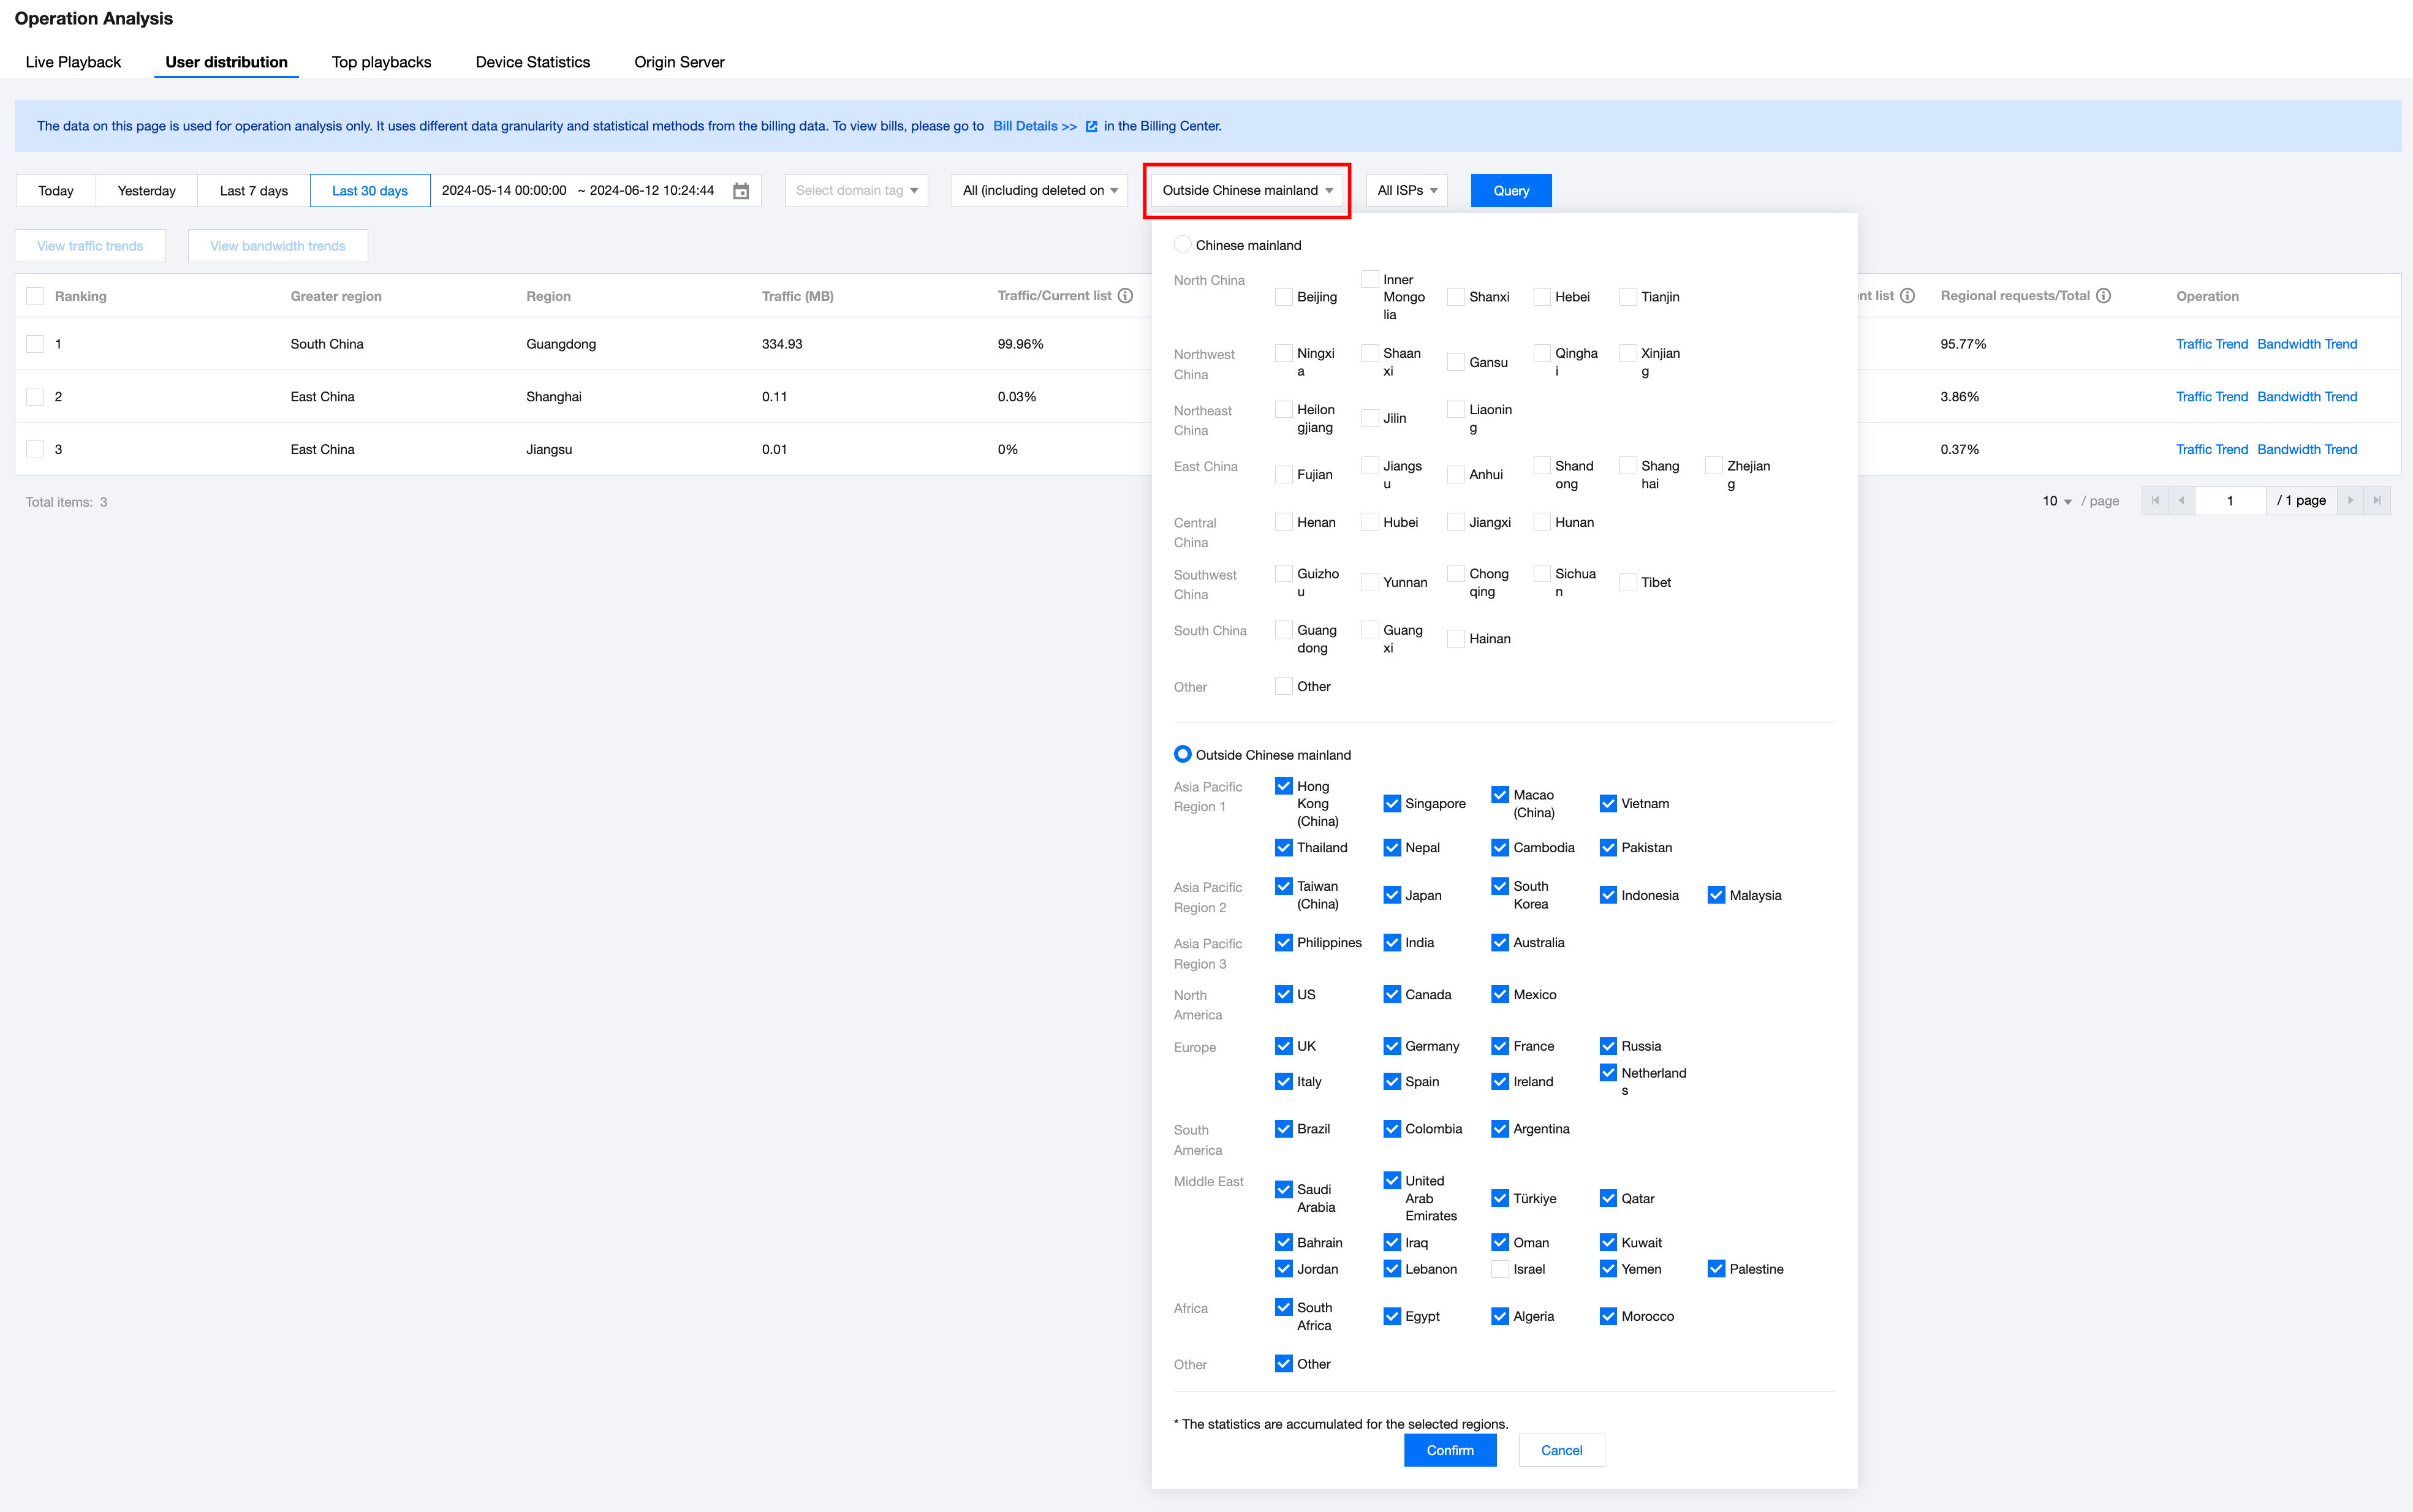
Under the User distribution tab, you can view the geographic location, traffic, and request data of live streaming users. It supports querying data at the domain name granularity and allows you to select regions and ISPs. You can query data for the last three months, and the maximum time span for each query is one month. The data is classified by Greater region and Region and sorted by the ratio of traffic in this region to the total traffic of all regions in the list.
When querying data in the Chinese mainland, the Greater region includes North China, Northwest China, Northeast China, East China, Central China, Southwest China, South China, and Other. The Region are specific province under each Greater region.
When querying data outside of the Chinese mainland, the Greater region includes Asia Pacific Region 1, Asia Pacific Region 2, Asia Pacific Region 3, North America, Europe, South America, Middle East, Africa, and Other. The Region is specific country or region under each Greater region.
Statistical Item
Description
Traffic (MB)
Total traffic of each region.
Traffic/Current list
Ratio of traffic in this region to the total traffic of all regions in the list.
Traffic/Total
Ratio of traffic in this region to all other regions within or outside Chinese mainland. For example, when the user query data within Chinese mainland, this statistical item indicates the ratio of traffic in this region to the total traffic of the Chinese mainland.
Requests
Total number of requests for each region.
Regional requests/Current list
Ratio of requests in this region to the total requests of all regions in the list.
Regional requests/Total
Ratio of requests in this region to all other regions within or outside the Chinese mainland. For example, when the user query data within Chinese mainland, this statistical item indicates the ratio of requests in this region to the total requests of the Chinese mainland.
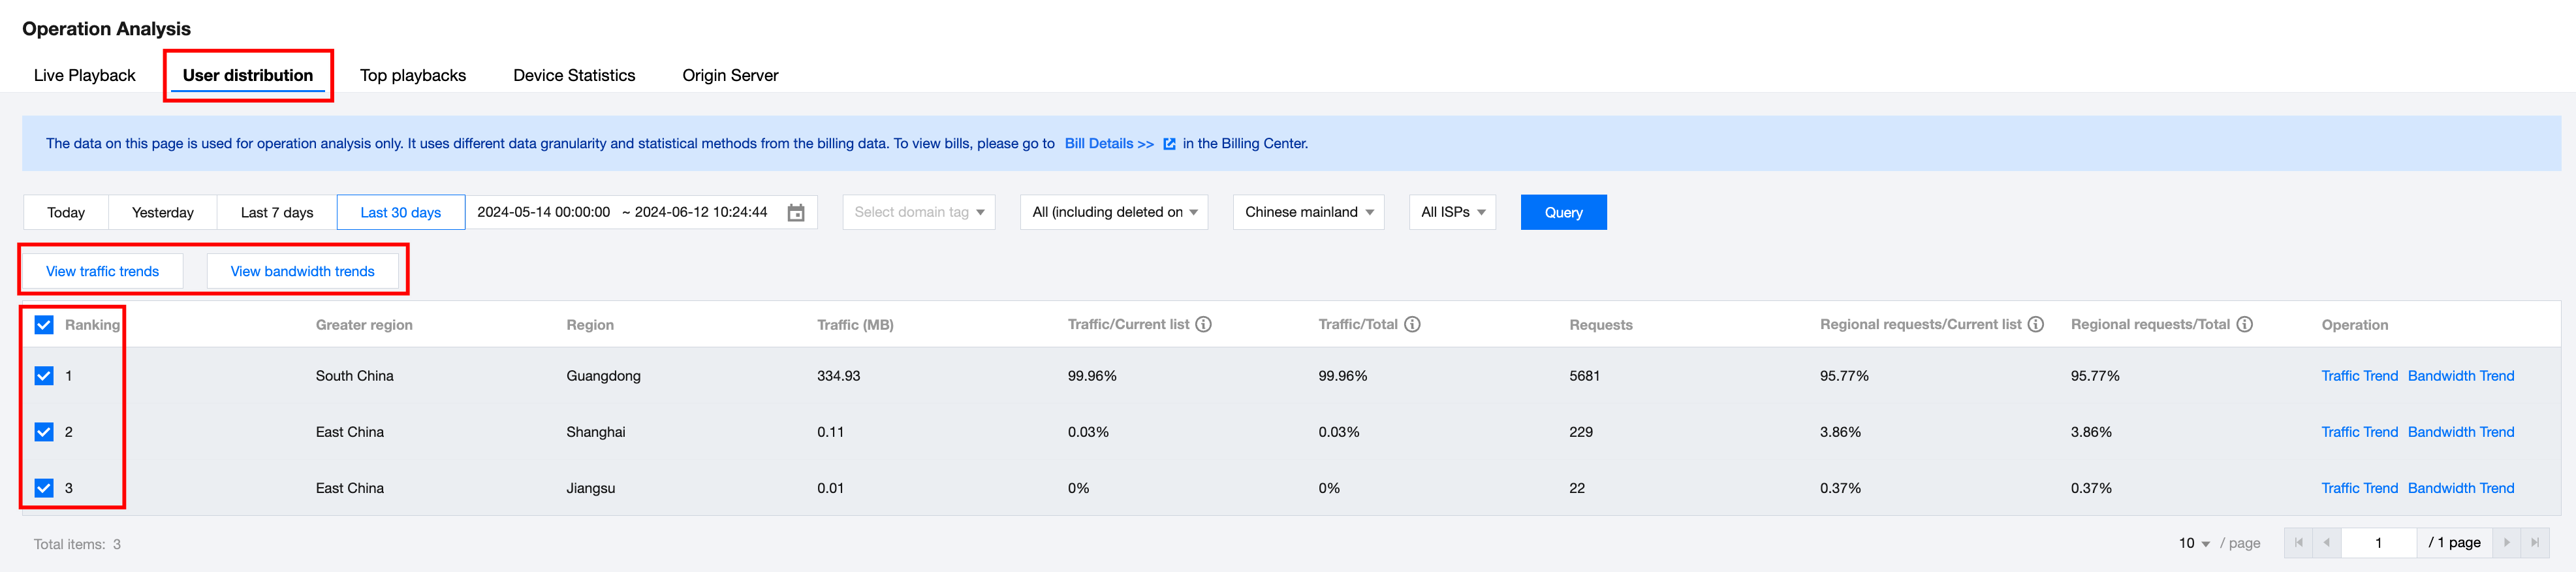
To view the traffic and bandwidth trends for one or more regions, you can select the desired regions and click on Traffic Trend and Bandwidth Trend.
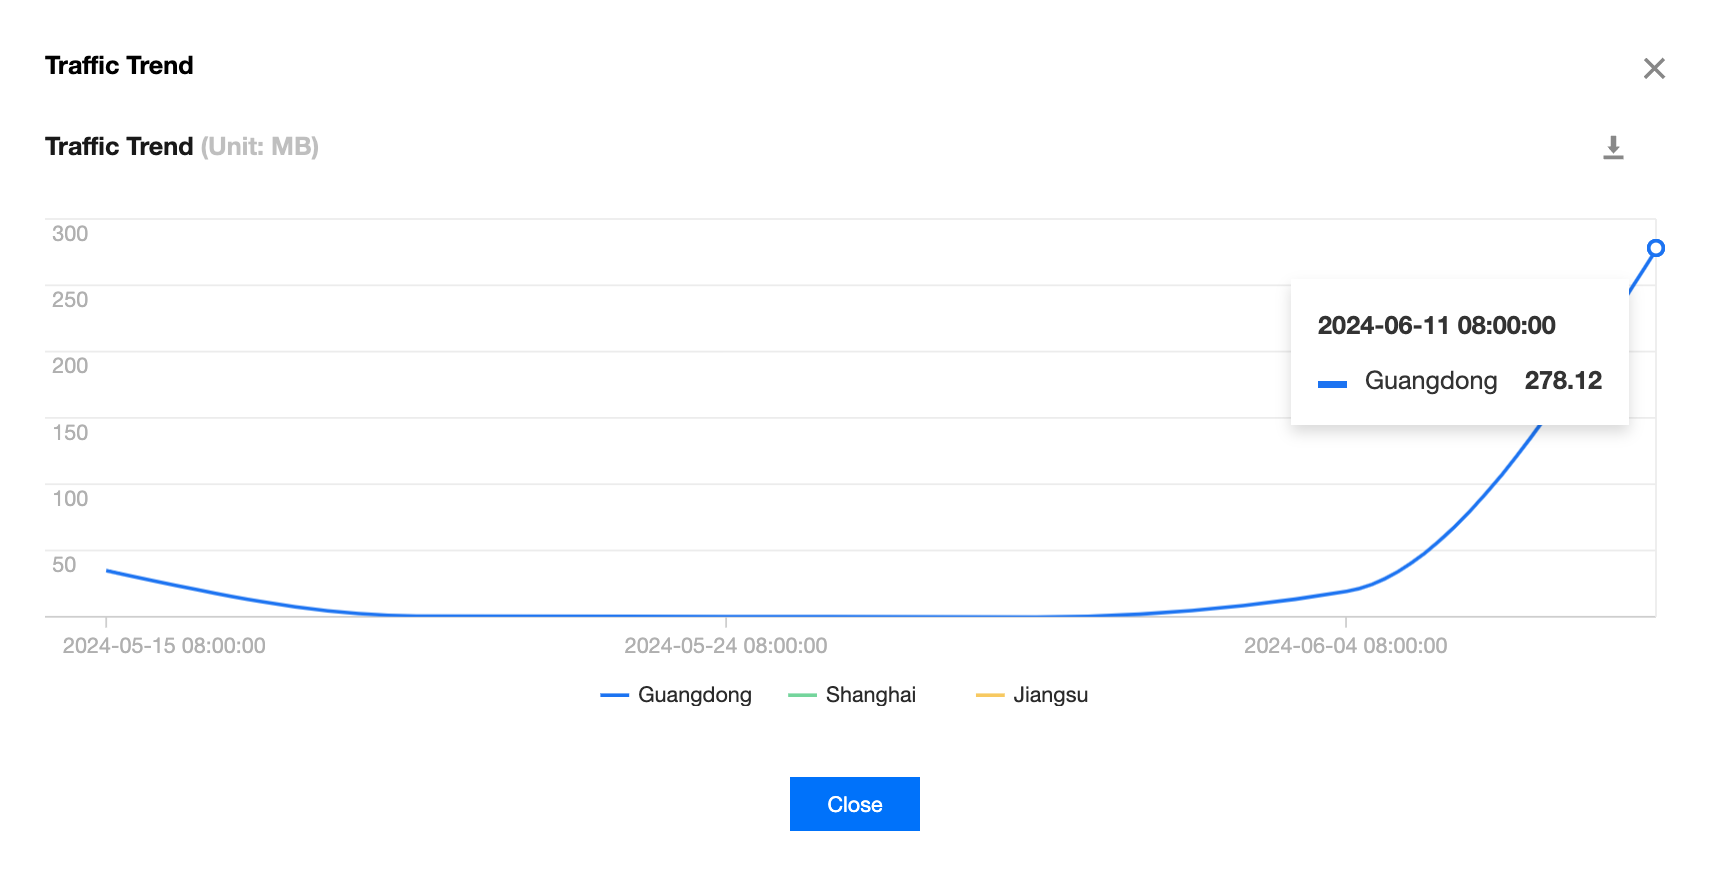
Taking the example of selecting multiple regions simultaneously, the displayed traffic trend chart is as follows:
Taking the example of selecting multiple regions simultaneously, the displayed bandwidth trend chart is as follows:
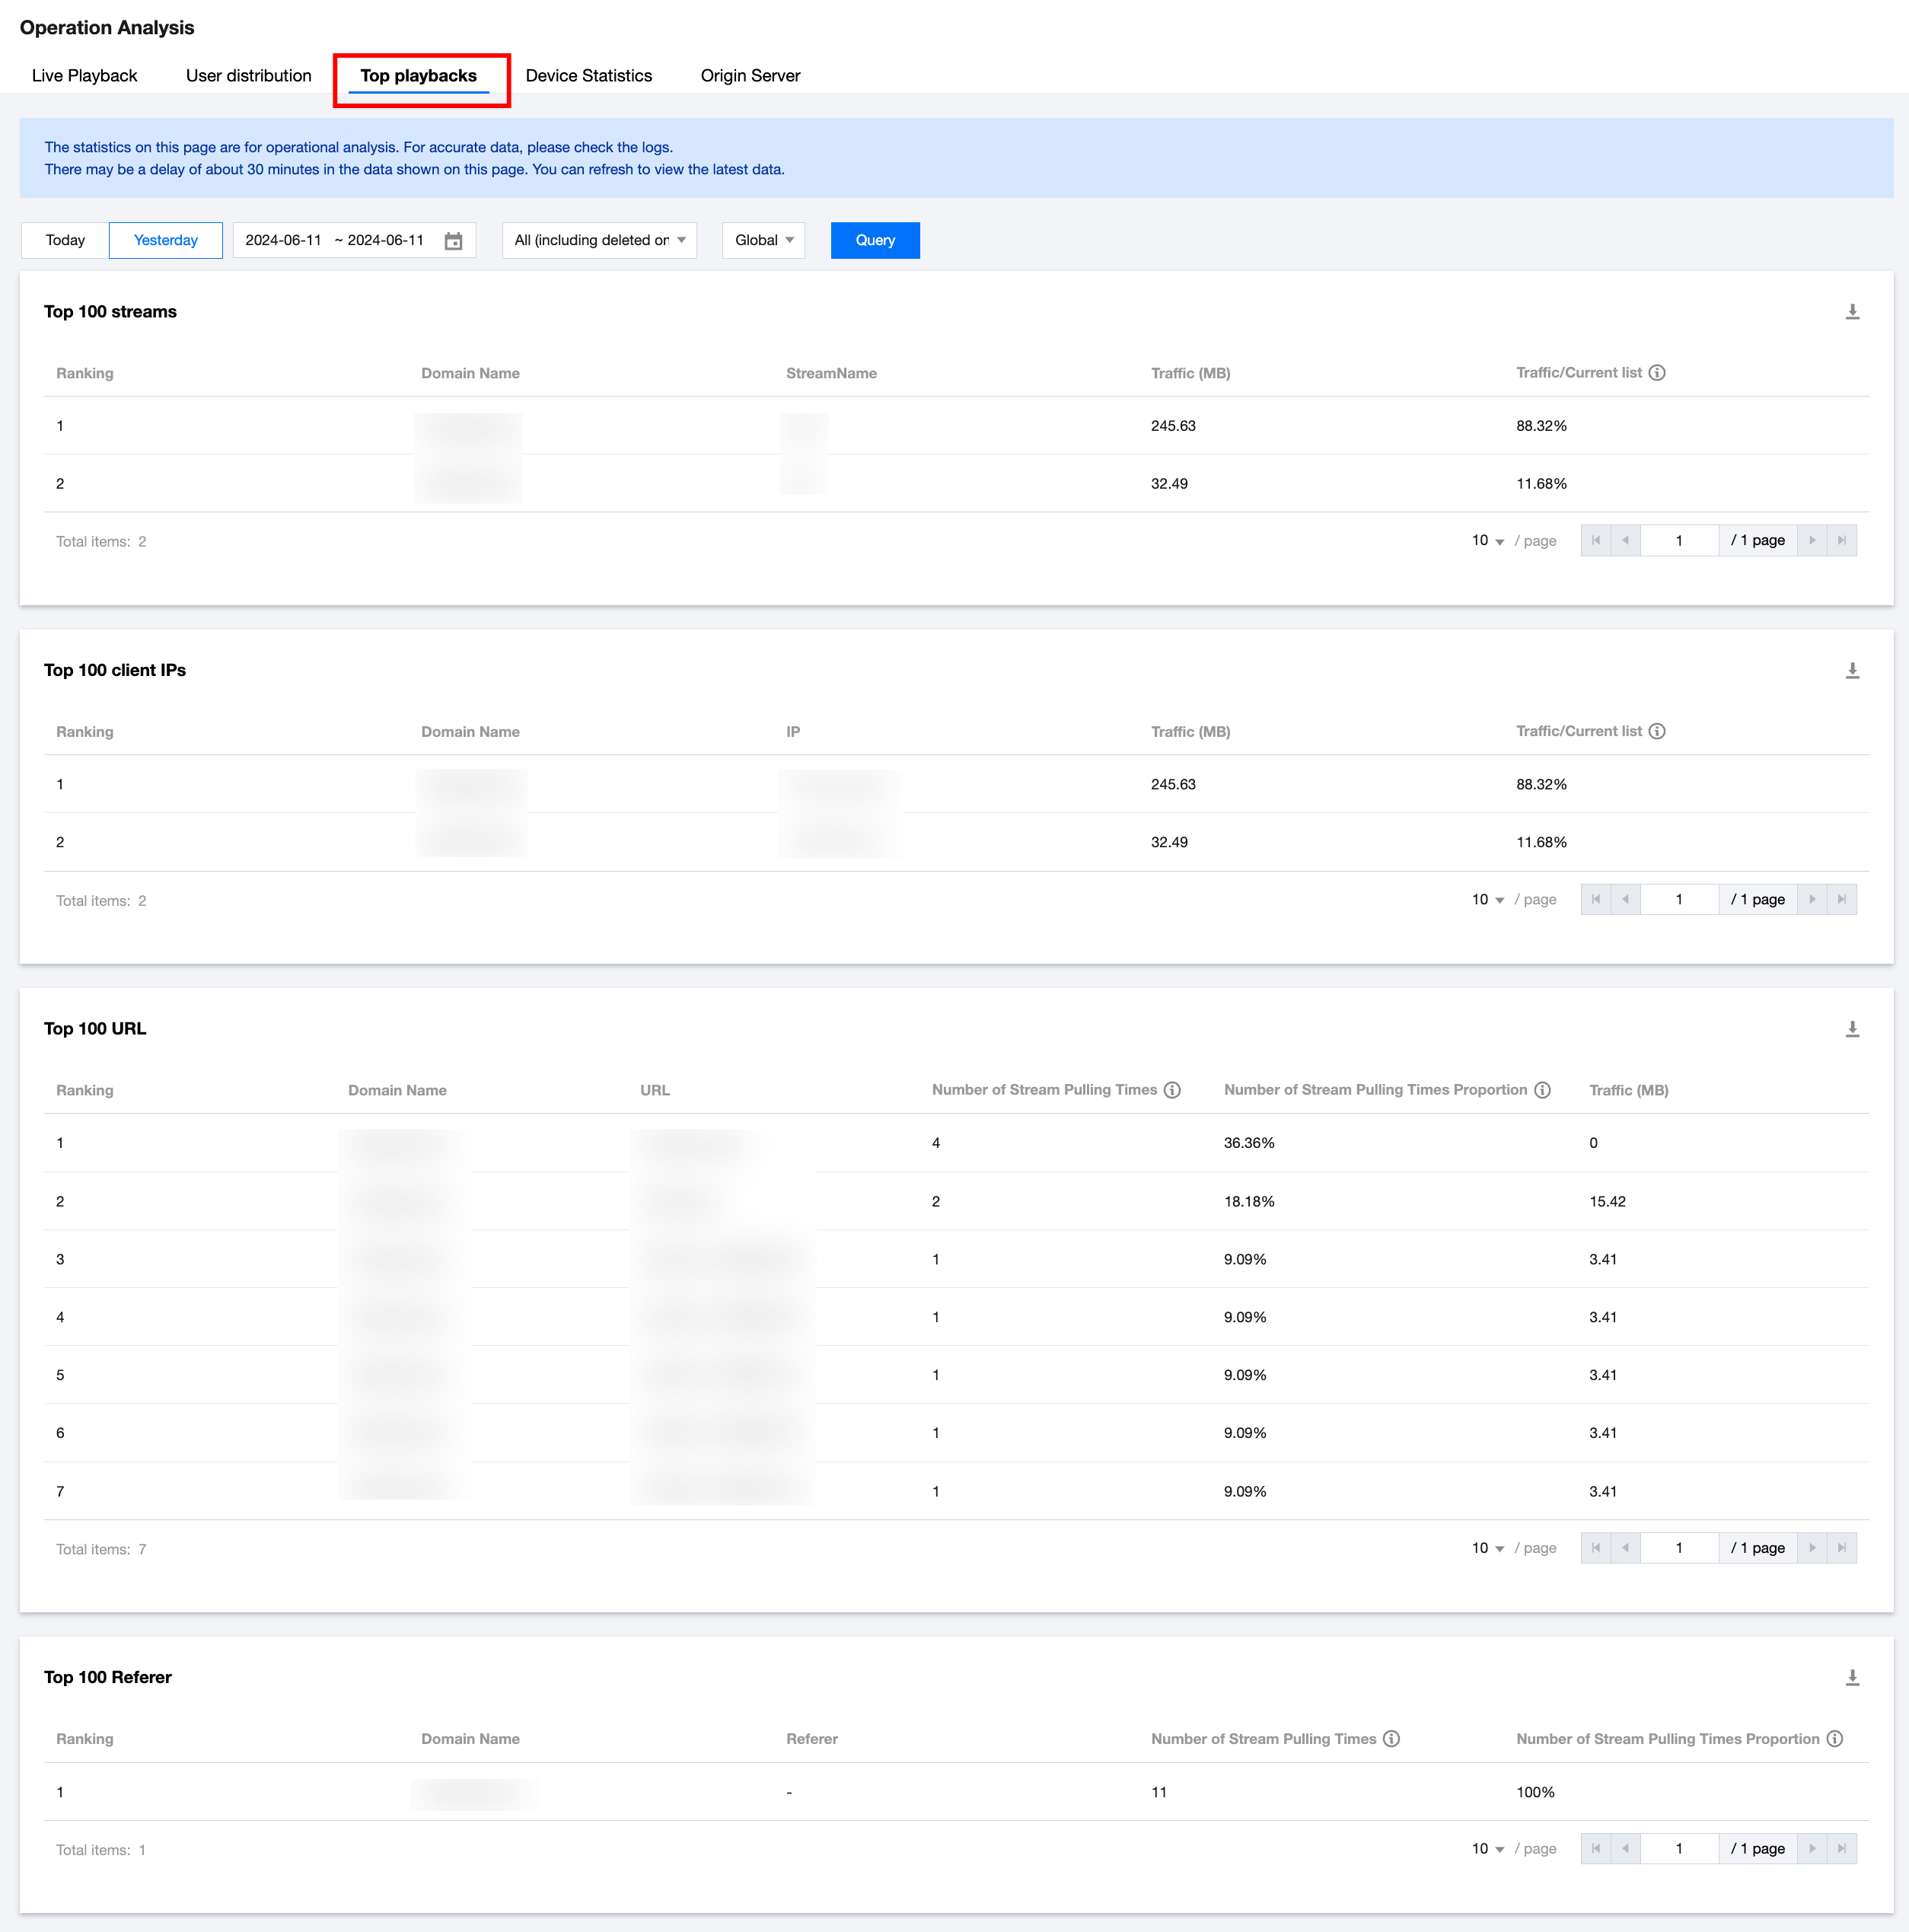
Top Playbacks
The Playback Ranking feature offers display and query capabilities for TOP 100 streams, TOP 100 client IPs, TOP 100 URL, and TOP 100 Referer, assisting you in understanding the popularity of live streams and the distribution of viewers. Additionally, this feature supports the query of various data indicators such as ranking, traffic, traffic ratio, frequency, and frequency ratio. It also supports data queries at the domain level (playback) and allows for the selection of regions and the query of data from the most recent three months, The maximum time span supported for each query is one day.
Key Features
Top 100 streams: This feature allows you to query and view the top 100 live streams with the highest viewership, including the ranking, traffic, and traffic proportion.
Top 100 client IPs: This feature allows you to query and view the top 100 client IP addresses that watch the most live broadcasts, helping you understand the audience distribution.
TOP 100 URL: You can inquire and display the top 100 URLs (request paths) ranked by frequency, including information such as ranking, domain, URL, frequency, and frequency ratio. This facilitates your understanding of the audience's access to different URLs.
TOP 100 Referer: You can inquire and display the top 100 Referers (request sources) ranked by frequency, including information such as ranking, domain, Referer, and frequency ratio. This facilitates your understanding of the audience's access situation from different Referers.
Note:
The top-ranking data of streams, IP, URL, and Referer on the current page is only used for operation analysis, and the specific result of the data analysis is subject to the actual log data.
Statistical Item
Description
Top 100 streams: Traffic/Current list
TOP 100 Streams - Proportional Traffic Distribution
Ratio of the traffic of this stream to the total traffic of all streams in the list.
Top 100 client IPs: Traffic/Current list
Ratio of the traffic of this IP address to the total traffic of all IP addresses in the list.
Top 100 URL - Frequency Ratio
Ratio of the traffic of this stream to the total traffic of all streams in the list.
Top 100 Referer - Frequency Ratio
Ratio of the traffic of this stream to the total traffic of all streams in the list.
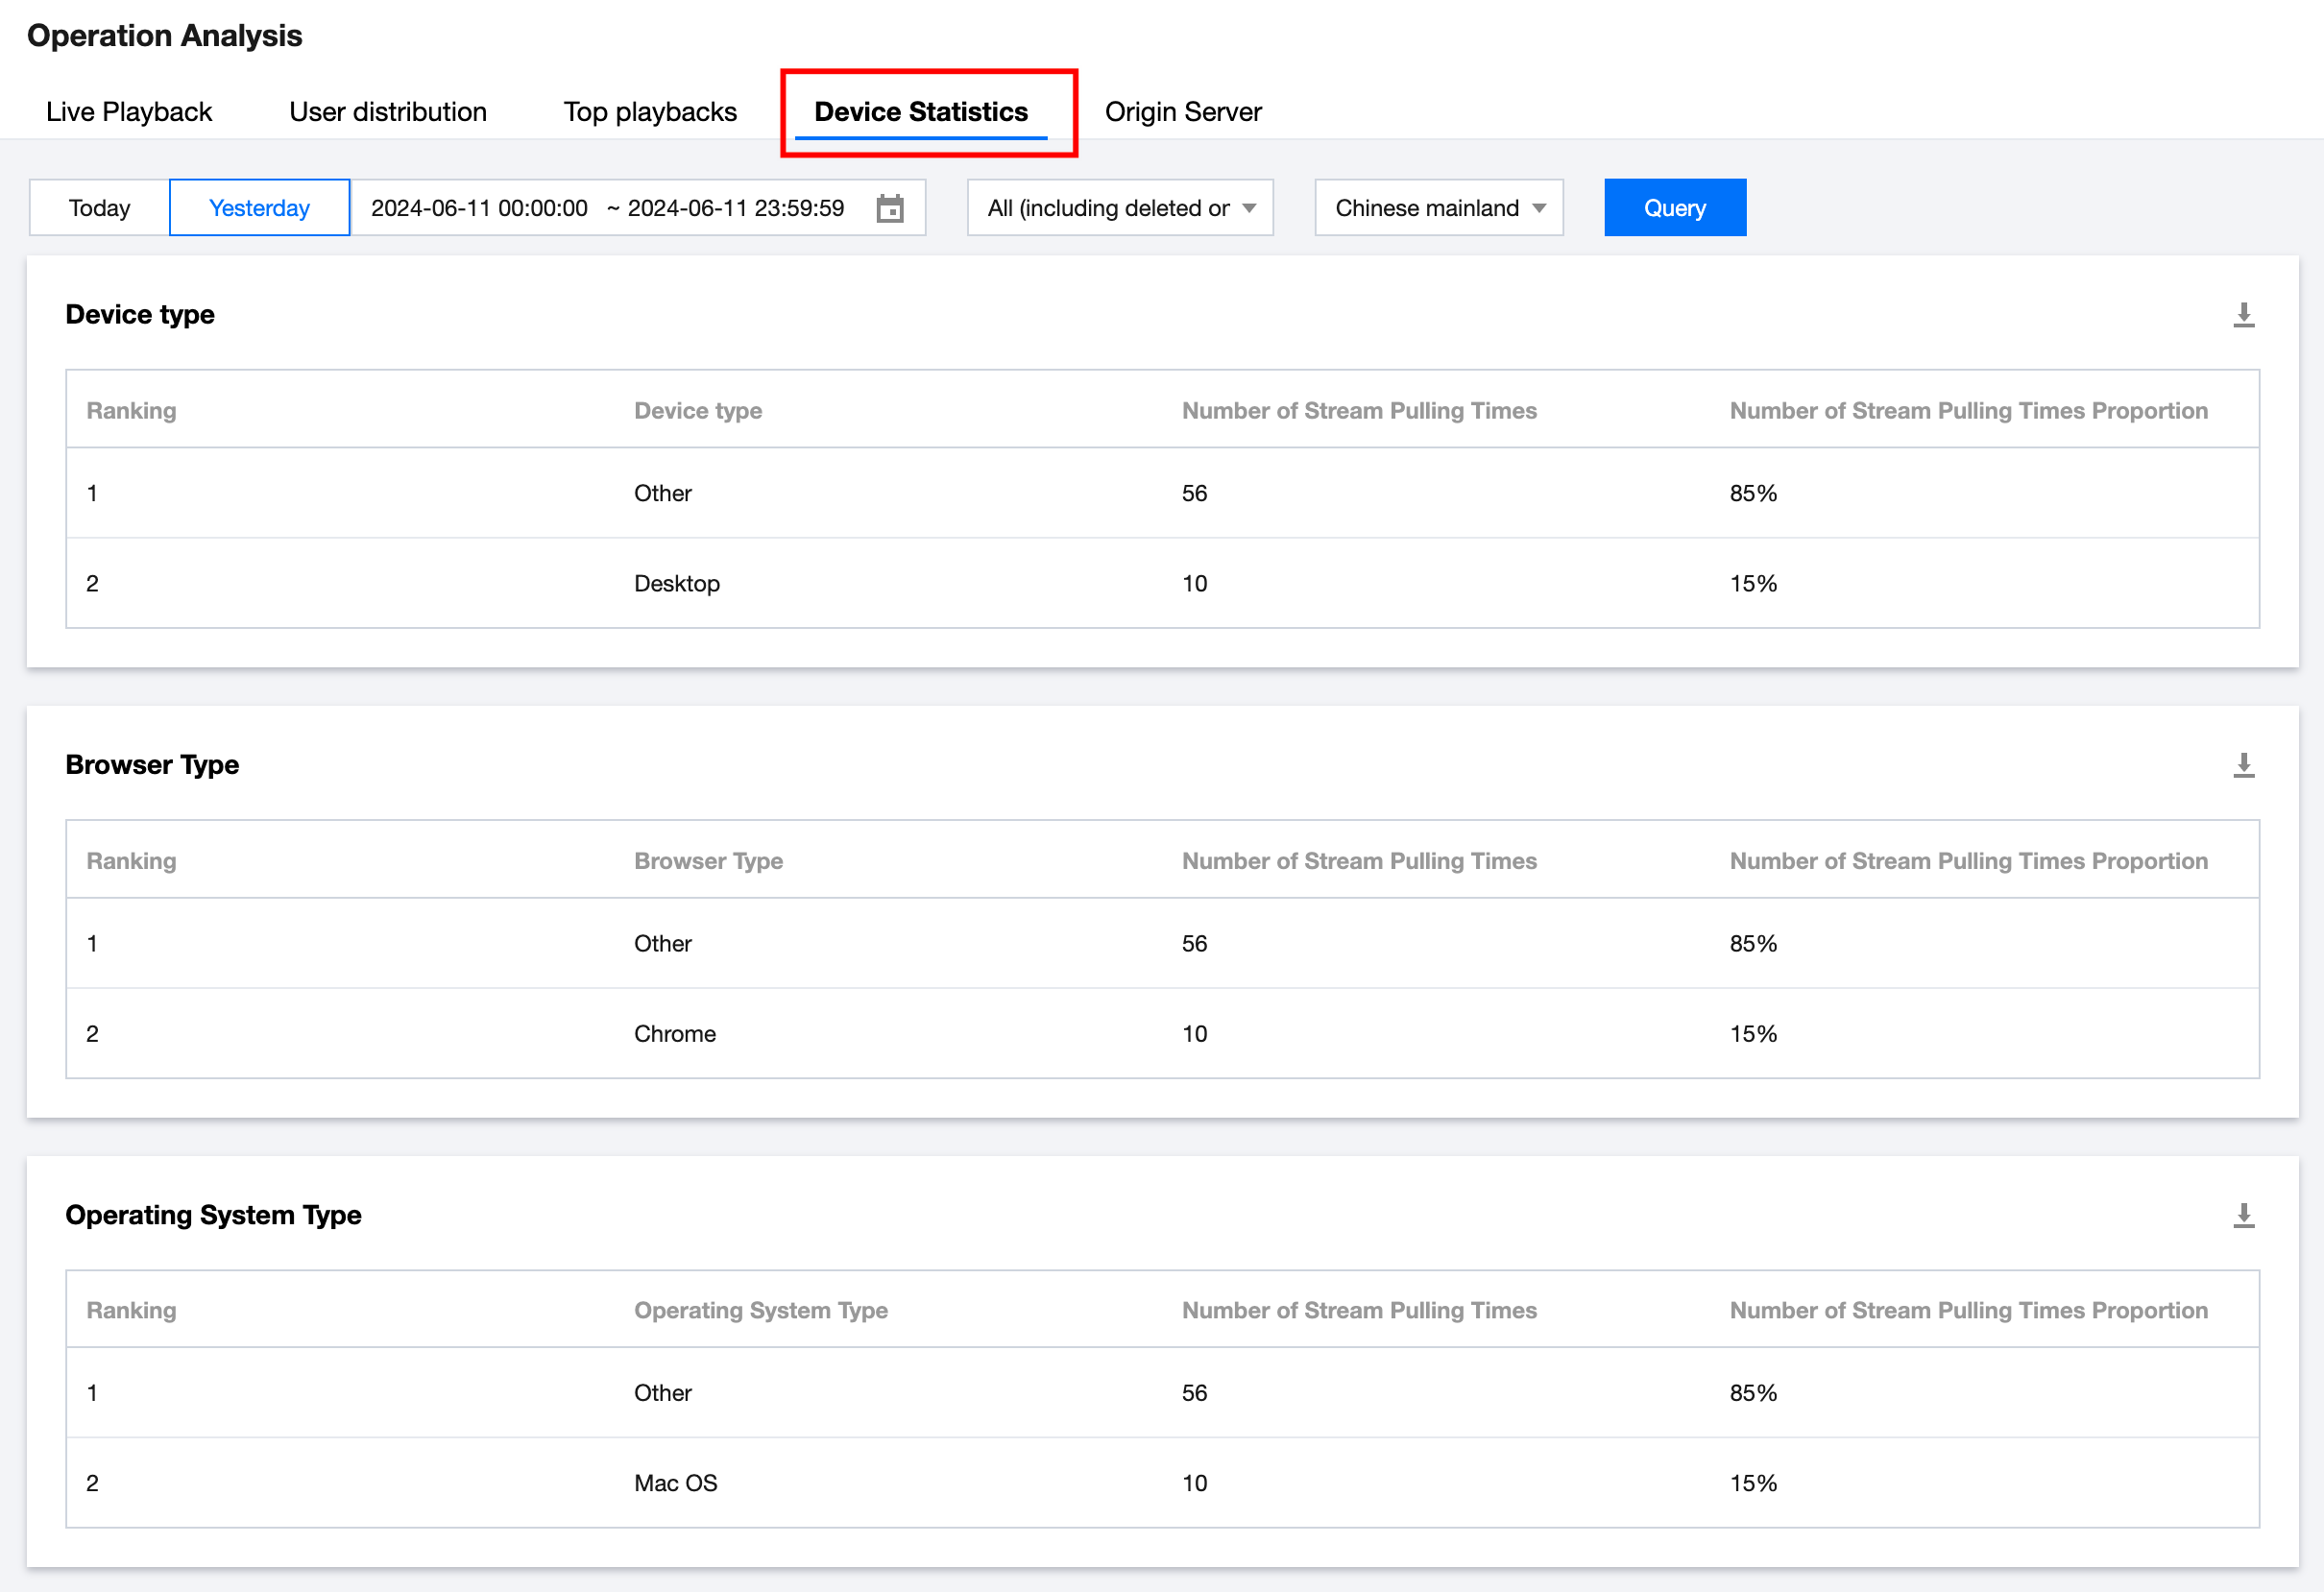
Device Statistics
The Device Statistics feature provides queries and displays for device type, browser type, and operating system type. It supports data queries (playback) at the domain name granularity level and allows the selection of regions. It supports queries for data from the past 3 months.
Statistics Item
Description
Device Type
Device types include: Tablet, Mobile, Desktop, TV, and Other.
Browser Type
Browser types include: Empty, Chrome, Safari, Opera, QQBrowser, LBBrowser, MaxthonBrowser, SouGouBrowser, BIDUBrowser, TaoBrowser, UBrowser, IE, Microsoft Edge, Bot, and Other.
Operating System Type
Operating system types include: Empty, Android, IOS, Mac OS, Windows, Linux, Chromium OS, NetBSD, Bot, and Other.
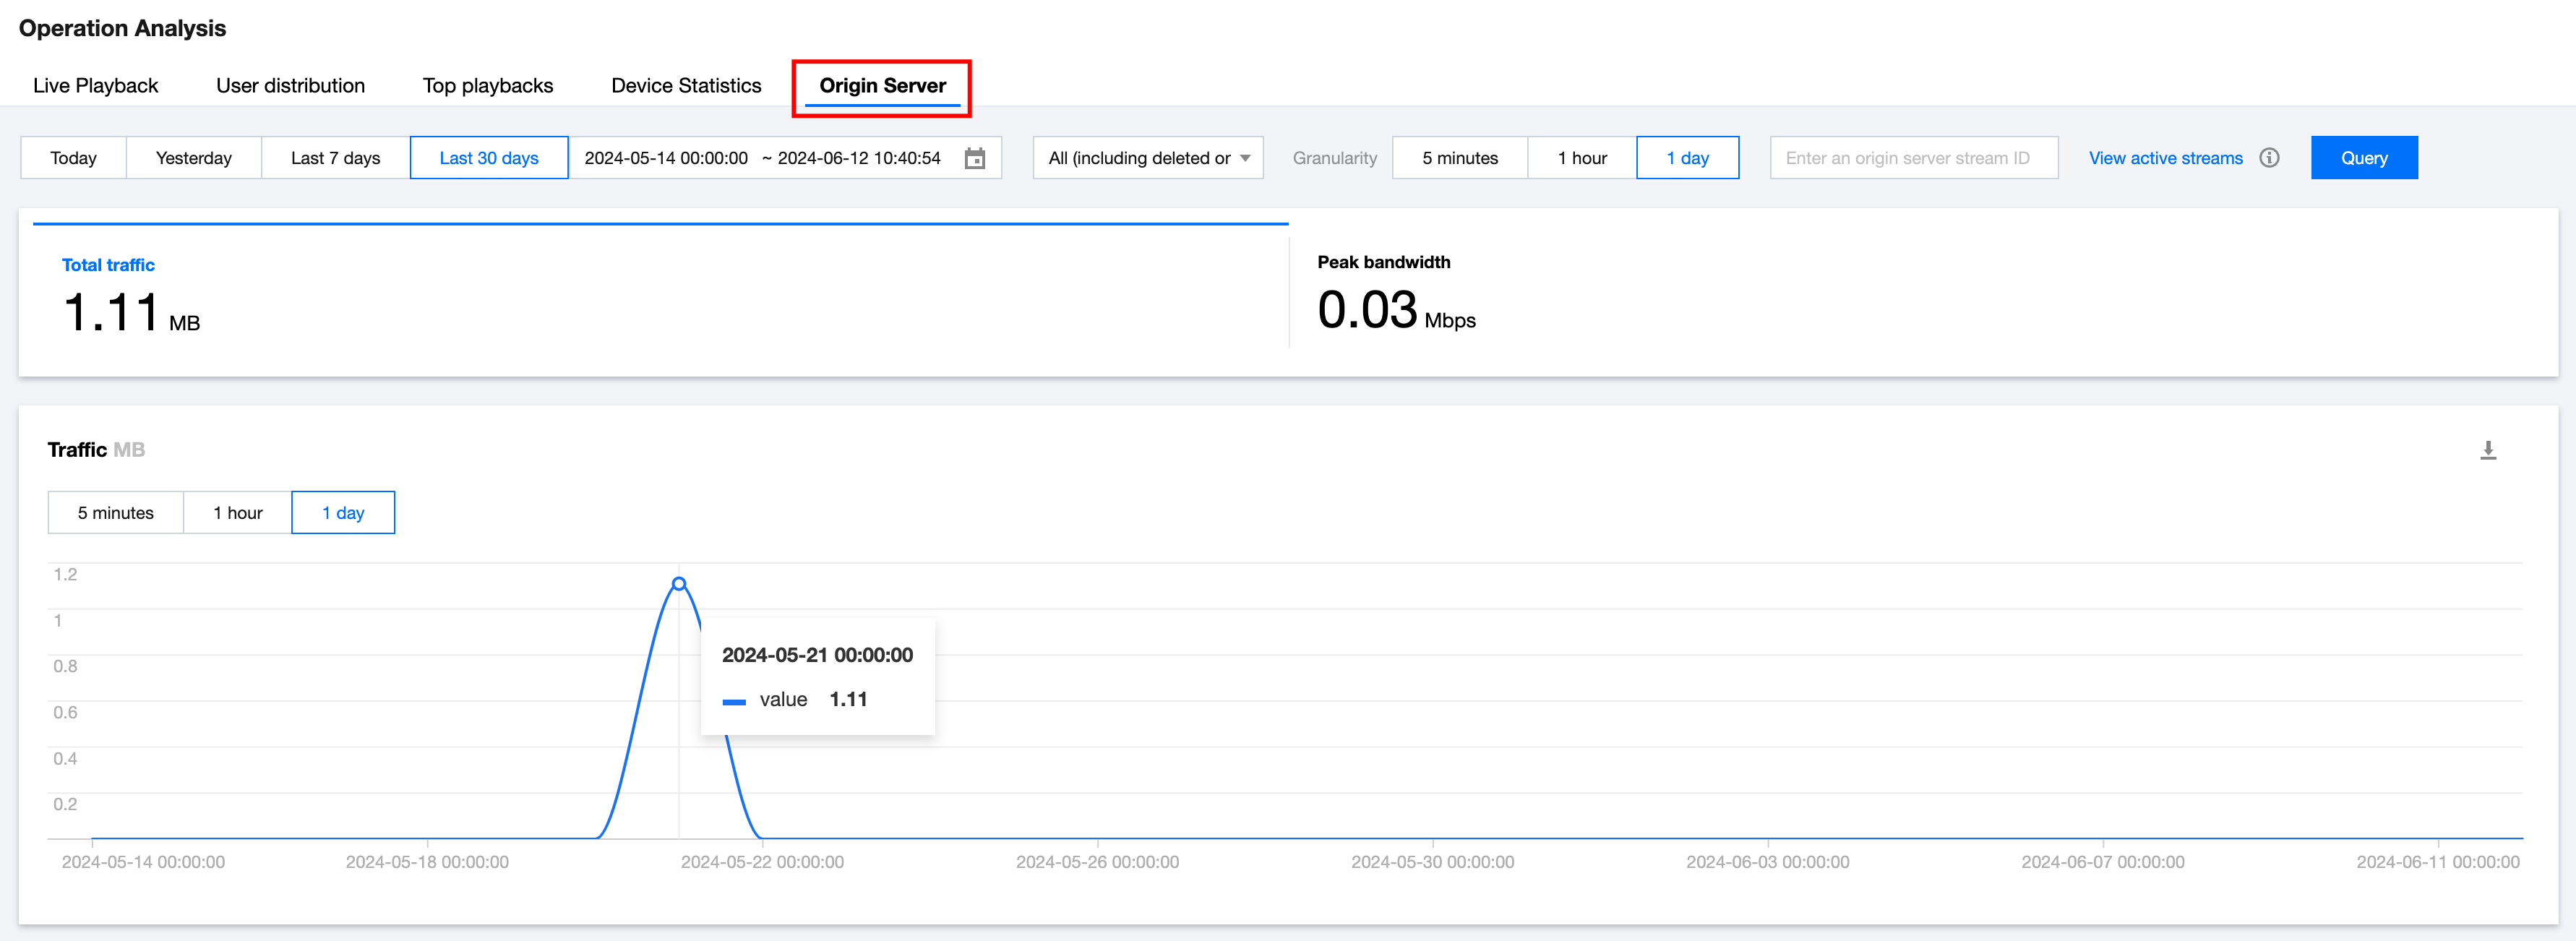
Origin Server
The Origin Server tab provides the traffic and peak bandwidth from origin server. It supports querying data at the domain name granularity and allows you to select regions and ISPs. You can query data for the last three months, and the maximum time span for each query is one month.