tencent cloud

Feedback

Monitoring

Last updated: 2024-11-06 18:42:06
    To make it easier for you to view and stay up to date with how instances work, TencentDB for MySQL provides a wide variety of performance monitoring metrics and convenient monitoring features (custom view, time comparison, merged monitoring metrics, etc). You can log in to the TencentDB for MySQL console, and view them in Instance Monitoring on the instance management page.
    Note:
    You can get instance monitoring metrics by calling the GetMonitorData API or using the TencentDB for MySQL monitoring metrics in Tencent Cloud Observability Platform (TCOP).
    You can create dashboards for monitoring metrics to analyze monitored data dynamically.
    If the number of tables in a single instance exceeds one million, database monitoring may be affected. Make sure that the number of tables in a single instance is below one million.

    Types of Instances for Monitoring

    TencentDB for MySQL source, read-only, and disaster recovery instances as well as database proxy nodes can be monitored, and each instance is provided with a separate monitoring view for easy query.

    Monitoring Types

    Four types of monitoring are available for TencentDB for MySQL: resource monitoring, engine monitoring (general), engine monitoring (extended), and deployment monitoring. You can view the metrics of different monitoring types to gain a quick and accurate understanding of how instances perform and operate.
    Note:
    TencentDB for MySQL single-node instances of cloud disk edition currently support resource monitoring and engine monitoring (general) but not engine monitoring (extended) and deployment monitoring.
    Resource monitoring provides monitoring data of CPU, memory, disk, and network.
    Engine monitoring (general) provides monitoring data of the number of connections, locks, hotspot tables, and slow queries, helping you troubleshoot issues and optimize the performance.
    Engine monitoring (extended) provides a wider variety of engine-related monitoring metrics so as to assist you in identifying existing or potential database problems as much as possible.
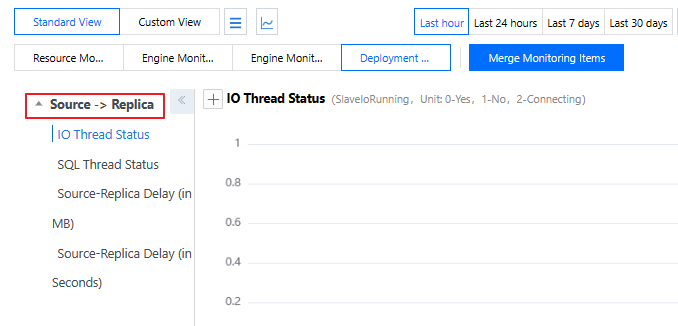
    Deployment monitoring provides monitoring metrics with regard to source-replica delay. It divides into source monitoring and replica monitoring:
    If the instance is a source instance, the object of instance deployment monitoring is the linkage between the source instance and its hidden replica. Deployment monitoring displays the IO and SQL thread status of the hidden replica. The source-replica delay (in MB or in seconds) refers to the delay between the source instance and its hidden replica.
    
    If the instance is a read-only instance, the object of instance deployment monitoring is the linkage between the source instance and the read-only instance. Deployment monitoring displays the IO and SQL thread status of the read-only instance. The source-replica delay (in MB or in seconds) refers to the delay between the read-only instance and the source instance.
    If the instance is a disaster recovery instance: a. The object of instance deployment monitoring (source) is the linkage between the disaster recovery instance and the source instance. Deployment monitoring displays the IO and SQL thread status of the disaster recovery instance. The source-replica delay (in MB or in seconds) refers to the delay between the disaster recovery instance and the source instance. b. The object of instance deployment monitoring (replica) is the linkage between the disaster recovery instance and its hidden replica. Deployment monitoring displays the IO and SQL thread status of the hidden replica. The source-replica delay (in MB or in seconds) refers to the delay between the disaster recovery instance and its hidden replica.

    Monitoring Granularity

    TencentDB for MySQL has adopted an adaptive policy for monitoring granularity since August 11, 2018, which means that you cannot select a monitoring granularity as desired for the time being. The adaptive policy is as follows:
    Time Span
    Monitoring Granularity
    Adaptation Description
    Retention Period
    (0h, 4h]
    5 seconds
    The time span is below 4 hours, and the monitoring granularity is 5 seconds.
    1 day
    (4h, 2d]
    1 minute
    The time span is above 4 hours but below 2 days, and the monitoring granularity is 1 minute.
    15 days
    (2d, 10d]
    5 minutes
    The time span is above 2 days but below 10 days, and the monitoring granularity is 5 minutes.
    31 days
    (10d, 30d]
    1 hour
    The time span is above 10 days but below 30 days, and the monitoring granularity is 1 hour.
    62 days
    (30d,180d]
    1 day
    The time span is above 30 days but within 180 days, the monitoring granularity is adjusted to 1 day.
    180 days
    Note:
    Currently, you can view monitoring data of TencentDB for MySQL in the past 180 days.

    Monitoring Metrics

    TCOP provides the following monitoring metrics for TencentDB for MySQL instances in the instance dimension:
    Note:
    For more information on how to use TencentDB monitoring metrics, see Introduction.
    Metric Name
    Parameter
    Unit
    Description
    Queries per Second
    qps
    Counts/second
    Number of SQL statements (INSERT, SELECT, UPDATE, DELETE, and REPLACE) executed by the database per second. This metric mainly represents the actual processing capability of the TencentDB instance.
    Transactions per Second
    tps
    Counts/second
    The number of transactions executed per second in the database
    Slow Queries
    slow_queries
    -
    The number of queries that take more than long_query_time second(s) to be executed
    Full-Table Scans
    select_scan
    Counts/sec
    The number of full-table scans executed per second
    SELECT Queries
    select_count
    Counts/sec
    The number of queries executed per second
    UPDATE Queries
    com_update
    Counts/sec
    The number of updates executed per second
    DELETE Queries
    com_delete
    Counts/sec
    The number of deletions executed per second
    INSERT Queries
    com_insert
    Counts/sec
    The number of insertions executed per second
    REPLACE Queries
    com_replace
    Counts/sec
    The number of replacements executed per second
    Total Queries
    queries
    Counts/sec
    All executed SQL statements such as SET and SHOW
    Open Connections
    threads_connected
    -
    The number of currently open connections
    Connection Utilization
    connection_use_rate
    %
    The number of open connections/the maximum number of connections
    Query Utilization
    query_rate
    %
    Actual QPS/Recommended QPS
    Total Disk Usage
    capacity
    MB
    This includes MySQL's data directories and logs such as binlog, relaylog, undolog, errorlog, and slowlog.
    Disk Space Used by Data
    real_capacity
    MB
    This includes only MySQL's data directories.
    Disk Space Used by Logs
    log_capacity
    MB
    This includes only MySQL's logs binlog, relaylog, undolog, errorlog, and slowlog.
    Disk Space Used by Log Files
    disk_log_used
    MB
    This includes only MySQL's binlog, relaylog, and undolog.
    Disk Space Used by Temp Files
    disk_tmp_used
    MB
    This includes only MySQL's temp files.
    Disk Utilization
    volume_rate
    %
    Added to allowlist: disk utilization = data usage space/purchased instance space
    Not added to allowlist: disk utilization = total disk usage space (data usage space + log usage space)/purchased instance space
    Note:
    If you need to display disk utilization = total disk usage space (data usage space + log usage space)/purchased instance space, contact the after-sale personnel to enable this feature.
    Private Outbound Traffic
    bytes_sent
    Byte/sec
    The number of bytes sent per second
    Private Inbound Traffic
    bytes_received
    Byte/sec
    The number of bytes received per second
    Query Cache Hit Rate
    qcache_hit_rate
    %
    The query cache hit rate
    Query Cache Utilization
    qcache_use_rate
    %
    The query cache utilization
    Table Locks Awaited
    table_locks_waited
    Counts/second
    The number of times that a request for a table lock could not be granted immediately and a wait was needed
    Temp Tables
    created_tmp_tables
    Counts/second
    The number of internal temporary tables created by the server while executing statements
    InnoDB Cache Hit Rate
    innodb_cache_hit_rate
    %
    The InnoDB engine cache hit rate
    InnoDB Cache Utilization
    innodb_cache_use_rate
    %
    The InnoDB engine cache utilization
    InnoDB Disk Reads
    innodb_os_file_reads
    Counts/sec
    The total number of file reads performed by read threads within InnoDB
    InnoDB Disk Writes
    innodb_os_file_writes
    Counts/second
    The total number of file writes performed by write threads within InnoDB
    InnoDB fsync() Calls
    innodb_os_fsyncs
    Counts/second
    The number of calls of the fsync function by InnoDB per second
    Tables Opened by InnoDB
    innodb_num_open_files
    -
    The number of tables InnoDB currently holds open
    MyISAM Cache Hit Rate
    key_cache_hit_rate
    %
    The MyISAM engine cache hit rate
    MyISAM Cache Utilization
    key_cache_use_rate
    %
    The MyISAM engine cache utilization
    CPU Utilization
    cpu_use_rate
    %
    If overuse of idle resources is permitted, the CPU utilization may exceed 100%
    Memory Utilization
    memory use rate
    %
    If overuse of idle resources is permitted, the memory utilization may exceed 100%
    Memory Usage
    memory_use
    MB
    If overuse of idle resources is permitted, the used memory may exceed the purchased specification
    Temp Files
    created_tmp_files
    Counts/sec
    The number of temp files created per second
    Opened Tables
    opened_tables
    -
    The number of open tables
    COMMIT Statements
    com_commit
    Counts/sec
    The number of COMMIT statements per second
    ROLLBACK Statements
    com_rollback
    Counts/sec
    The number of ROLLBACK statements per second
    Created Threads
    threads_created
    -
    The number of threads created to handle connections
    Running Threads
    threads_running
    -
    The number of threads that are not sleeping
    Max Connections
    max_connections
    -
    The maximum number of connections
    Temp Disk Tables
    created_tmp_disk_tables
    Counts/sec
    The number of internal on-disk temporary tables created by the server while executing statements
    Requests to Read Next Row
    handler_read_rnd_next
    Counts/sec
    The number of requests to read the next row in the data file
    Rollbacks Performed in Storage Engine
    handler_rollback
    Counts/sec
    The number of requests for a storage engine to perform a rollback operation
    Internal COMMIT Statements
    handler_commit
    Counts/sec
    The number of internal COMMIT statements per second
    InnoDB Free Pages
    innodb_buffer_pool_pages_free
    -
    The number of free pages in the InnoDB buffer pool
    Total InnoDB Pages
    innodb_buffer_pool_pages_total
    -
    The total size of the InnoDB buffer pool in pages
    InnoDB Logical Reads
    innodb_buffer_pool_read_requests
    Counts/sec
    The number of logical read requests
    InnoDB Physical Reads
    innodb_buffer_pool_reads
    Counts/sec
    The number of logical reads that InnoDB could not satisfy from the buffer pool, and had to read directly from disk
    Data Read in InnoDB
    innodb_data_read
    Byte/sec
    The amount of data read per second
    Total InnoDB Reads
    innodb_data_reads
    Counts/sec
    The total number of data reads per second
    Total InnoDB Writes
    innodb_data_writes
    Counts/sec
    The total number of data writes per second
    Data Written in InnoDB
    innodb_data_written
    Byte/sec
    The amount of data written per second
    InnoDB Rows Deleted
    innodb_rows_deleted
    Counts/sec
    The number of rows deleted from InnoDB tables
    InnoDB Rows Inserted
    innodb_rows_inserted
    Counts/sec
    The number of rows inserted into InnoDB tables
    InnoDB Rows Updated
    innodb_rows_updated
    Counts/sec
    The number of rows updated in InnoDB tables
    InnoDB Rows Read
    innodb_rows_read
    Counts/sec
    The number of rows read from InnoDB tables
    Avg. Time to Acquire an InnoDB Row Lock
    innodb_row_lock_time_avg
    ms
    The average time to acquire a row lock for InnoDB tables
    InnoDB Row Lock Waits
    innodb_row_lock_waits
    Counts/sec
    The number of times operations on InnoDB tables had to wait for a row lock
    Unused Blocks in Key Cache
    key_blocks_unused
    -
    The number of key blocks unused by the MyISAM key cache
    Used Blocks in Key Cache
    key_blocks_used
    -
    The number of key blocks used by the MyISAM key cache
    Blocks Read from Key Cache
    key_read_requests
    Counts/sec
    The number of requests to read a key block from the MyISAM key cache
    Blocks Read from Disk
    key_reads
    Counts/sec
    The number of requests to read a disk data block from the MyISAM key cache
    Blocks Written into Key Cache
    key_write_requests
    Counts/sec
    The number of requests to write a key block to the MyISAM key cache
    Blocks Written into Disk
    key_writes
    Counts/sec
    The number of requests to write a disk data block to the MyISAM key cache
    Source-Replica Delay (in MB)
    master_slave_sync_distance
    MB
    The amount of data by which the replica has lagged behind the source
    Source-Replica Delay (in Seconds)
    seconds_behind_master
    Sec
    The source-replica delay (in seconds)
    IO Thread Status
    slave_io_running
    Status values: 0: Yes; 1: No; 2: Connecting
    The IO thread running status
    SQL Thread Status
    slave_sql_running
    Status value: 0: Yes; 1: No
    The SQL thread running status
    Contact Us

    Contact our sales team or business advisors to help your business.

    Technical Support

    Open a ticket if you're looking for further assistance. Our Ticket is 7x24 avaliable.

    7x24 Phone Support