TDSQL-C for MySQL provides a rich set of performance monitoring metrics to help you stay up to date with the detailed status and performance of your database. Generally, you can view monitoring metrics and data in the TDSQL-C for MySQL console by creating a dashboard in Tencent Cloud Observability Platform (TCOP) or through TencentCloud API. We recommend that you choose the console, where you can quickly obtain fine-grained monitoring data for the target time range and locate Ops problems accordingly.
This document describes how to view the monitoring data and perform visual operations on the monitoring page.
Viewing Monitoring Data
Option
Strengths
Operation
Viewing data in the TDSQL-C for MySQL console
The console is simple and visual, where you can quickly locate problems in a familiar way.
2. Select the region at the top, find the target cluster, and click the cluster ID or Manage in the Operation column to enter the cluster management page.
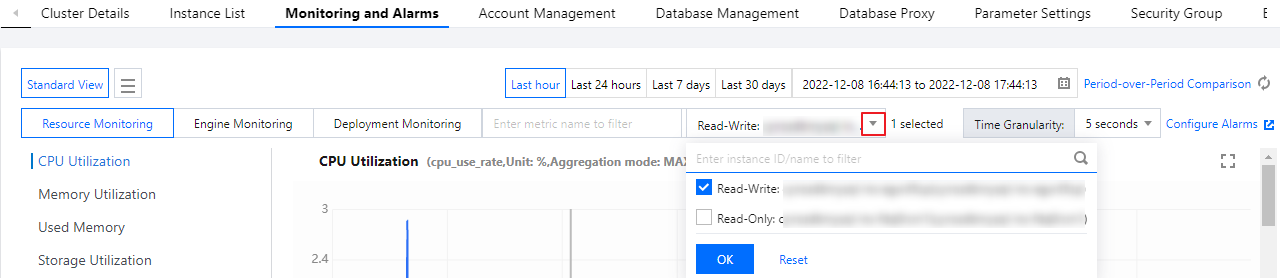
3. On the cluster management page, select Monitoring and Alarms, select one or multiple target instances in the drop-down list, and click OK.
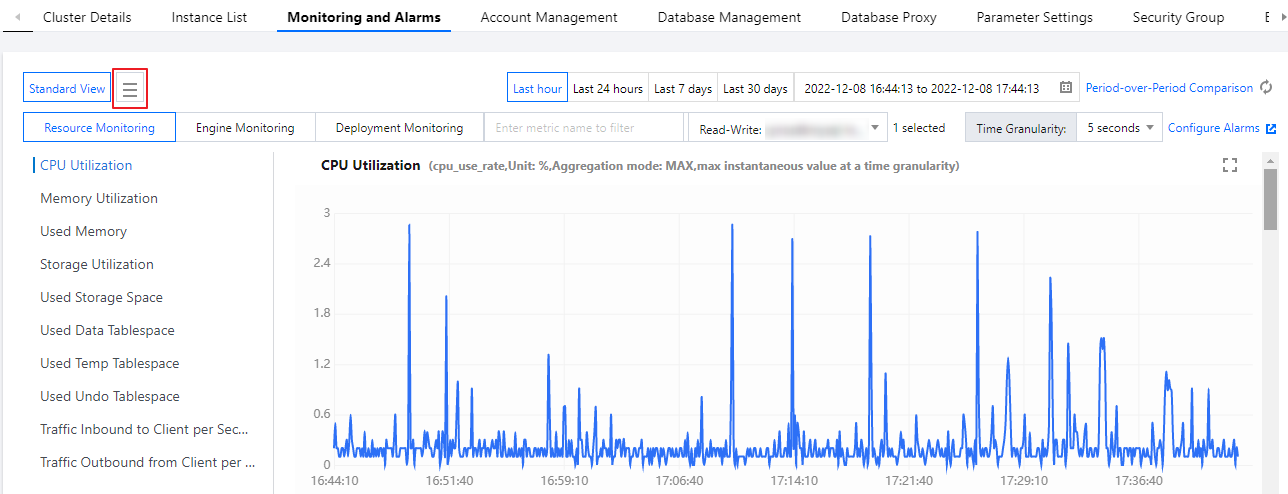
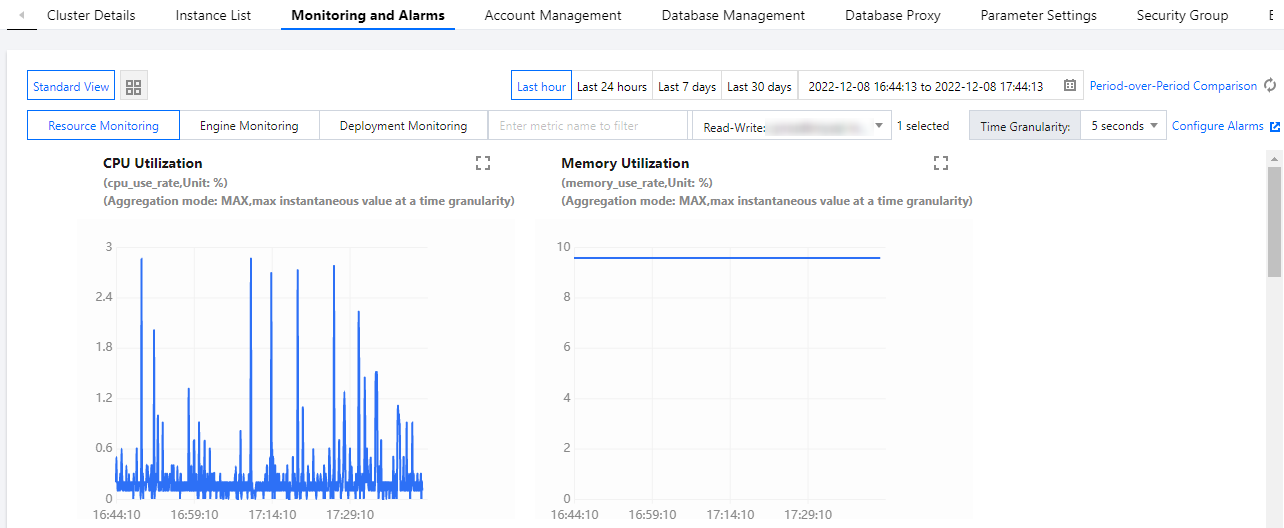
4. On the Monitoring and Alarms tab, click Standard View or Grid View to switch the layout of the monitoring view.
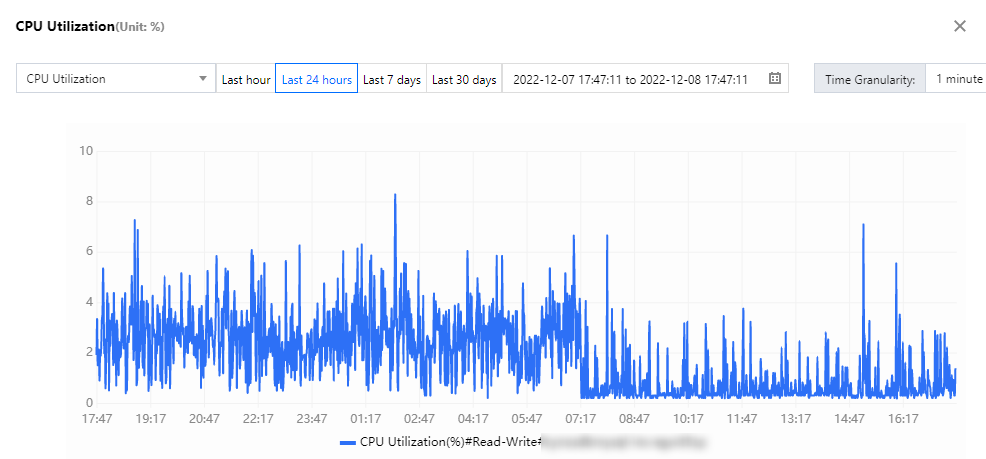
Displaying a chart in full screen
You can display a single metric in full screen for a clearer preview of metric data.
1. On the Monitoring and Alarms tab, click
on the right of the corresponding metric to display the metric in full screen.
2. After the data is displayed in full screen, you can filter the metric and select a time range and time granularity to view the metric data. You can click X in the top-right corner to close the full screen window.
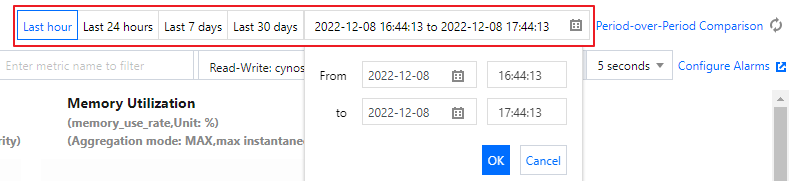
Selecting a monitoring time range
You can select or customize a time range to query the monitoring data over this time period.
On the Monitoring and Alarms tab, you can select Last hour, Last 24 hours, Last 7 days, or Last 30 days. You can also click the time picker to specify the start time and end time for monitoring data query.
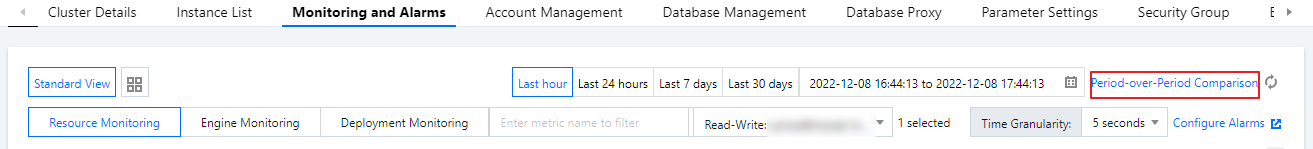
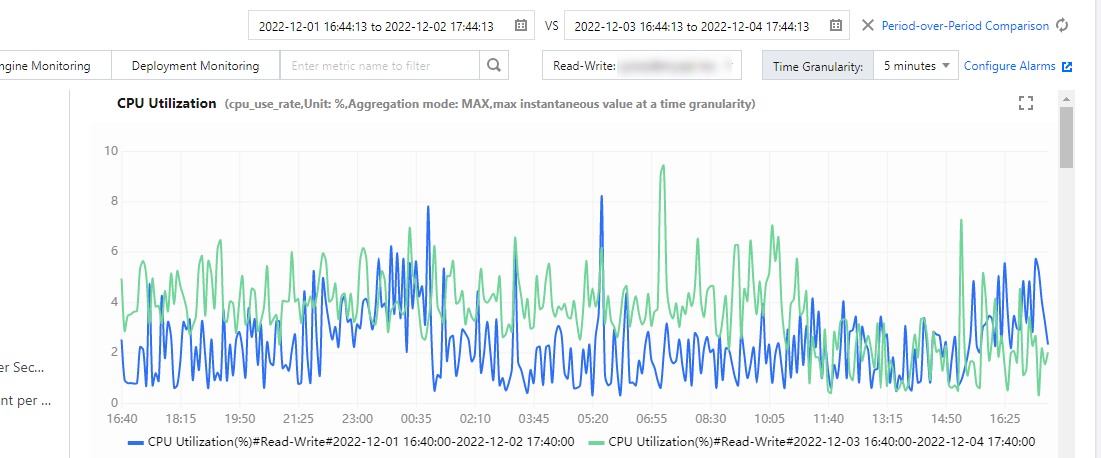
Adding period-over-period comparison
You can compare monitoring data from multiple time ranges by adding period-over-period comparison.
Note:
The time range in the first time picker determines the time ranges in new time pickers. For example, if it is 3 days in the first time picker, then you can select only the start time in a new time picker, and the end time will be 3 days later by default.
Use limits
If you select multiple instances to view monitoring data, the period-over-period comparison feature is not supported.
You can compare the data of an instance monitoring metric within up to three time ranges.
2. Select the region at the top, find the target cluster, and click the cluster ID or Manage in the Operation column to enter the cluster management page.
3. On the cluster management page, select the Monitoring and Alarms tab.
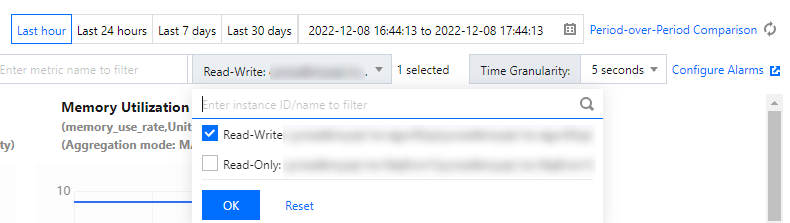
4. Select a target instance in the drop-down box and click OK.
5. On the Monitoring and Alarms tab, click Period-over-Period Comparison on the custom time picker
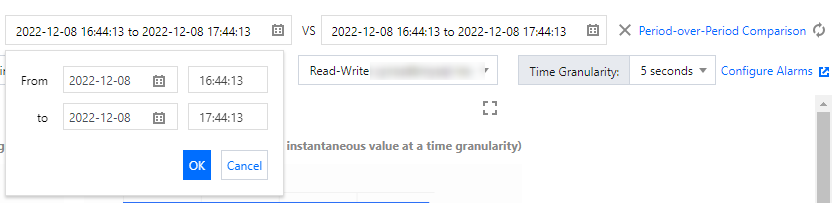
6. Select the time range for query in the first time picker and click OK. Then, select the start time of the second time range in the second time picker and click OK.
Note:
In new time pickers, you only need to select the start time, and the time range will be automatically aligned with that in the first time picker. For example, if the time range in the first time picker is 3 days, then all time ranges added subsequently will also be 3 days.
7. After you select the time ranges for comparison, you can query the monitoring metric details of the instance within the selected time ranges at the specified time granularity.
Setting a monitoring time granularity
You can select different time granularities for monitoring data query within the specified time range.
On the Monitoring and Alarms tab, select a time granularity in the Time Granularity drop-down list.
Time ranges and corresponding time granularities
Query time range
Range between query start time and current time
Default time granularity
Optional time granularities
(0h, 1h]
(0d, 1d]
5s
5s/1min/5min
(0h, 1h]
(1d, 15d]
1min
1min/5min
(0h, 1h]
(15d, 31d]
5min
5min
(1h, 24h]
(0d, 15d]
1min
1min/5min/1h
(1h, 24h]
(15d, 31d]
5min
5min/1h
(24h, 7d]
(0d, 31d]
5min
5min/1h/1d
(7d,31d]
(0d, 31d]
1h
1h/1d
Example:
Suppose the current time is 15:00, July 10, 2022, and the query time range is 15:00–16:00, June 29, 2022 (1 hour), then the query time range is 1 hour. As the time between the query start time and the current time is longer than 1 day but shorter than 15 days, the default time granularity is 1 minute. You can also select the option of 5 minutes.
Note:
Currently, you can view monitoring data of TDSQL-C for MySQL in the past 31 days.