
Excessive Number of Slow Queries

Last updated: 2025-01-23 17:01:24
Problem Description
When a slow query problem occurs, it is usually accompanied by the simultaneous surge in multiple monitoring metrics, such as CPU utilization and the number of slow queries.
Note:
You can view an instance's CPU utilization and the number of slow queries on the Monitoring and Alarms page.
Possible Causes
Generally, it is due to the low execution efficiency of SQL statements, causing a large number of requests to accumulate in TDSQL-C for MySQL. There are two common causes:
Cause 1: The SQL statements do not use indexes or use inefficient indexes.
Cause 2: The queries per second (QPS) stress exceeds the load limit of the current instance.
Solutions
There are different solutions for the two possible causes:
Solution 1: Optimize SQL statements to improve their execution efficiency. For details, see Measure 1.
Solution 2: Improve the configuration of TDSQL-C for MySQL. For details, see Measure 2.
Directions
Measure 1: Optimizing SQL Statements
You can directly use DBbrain to optimize slow queries, which will analyze the SQL statements and give advice for adding indexes.
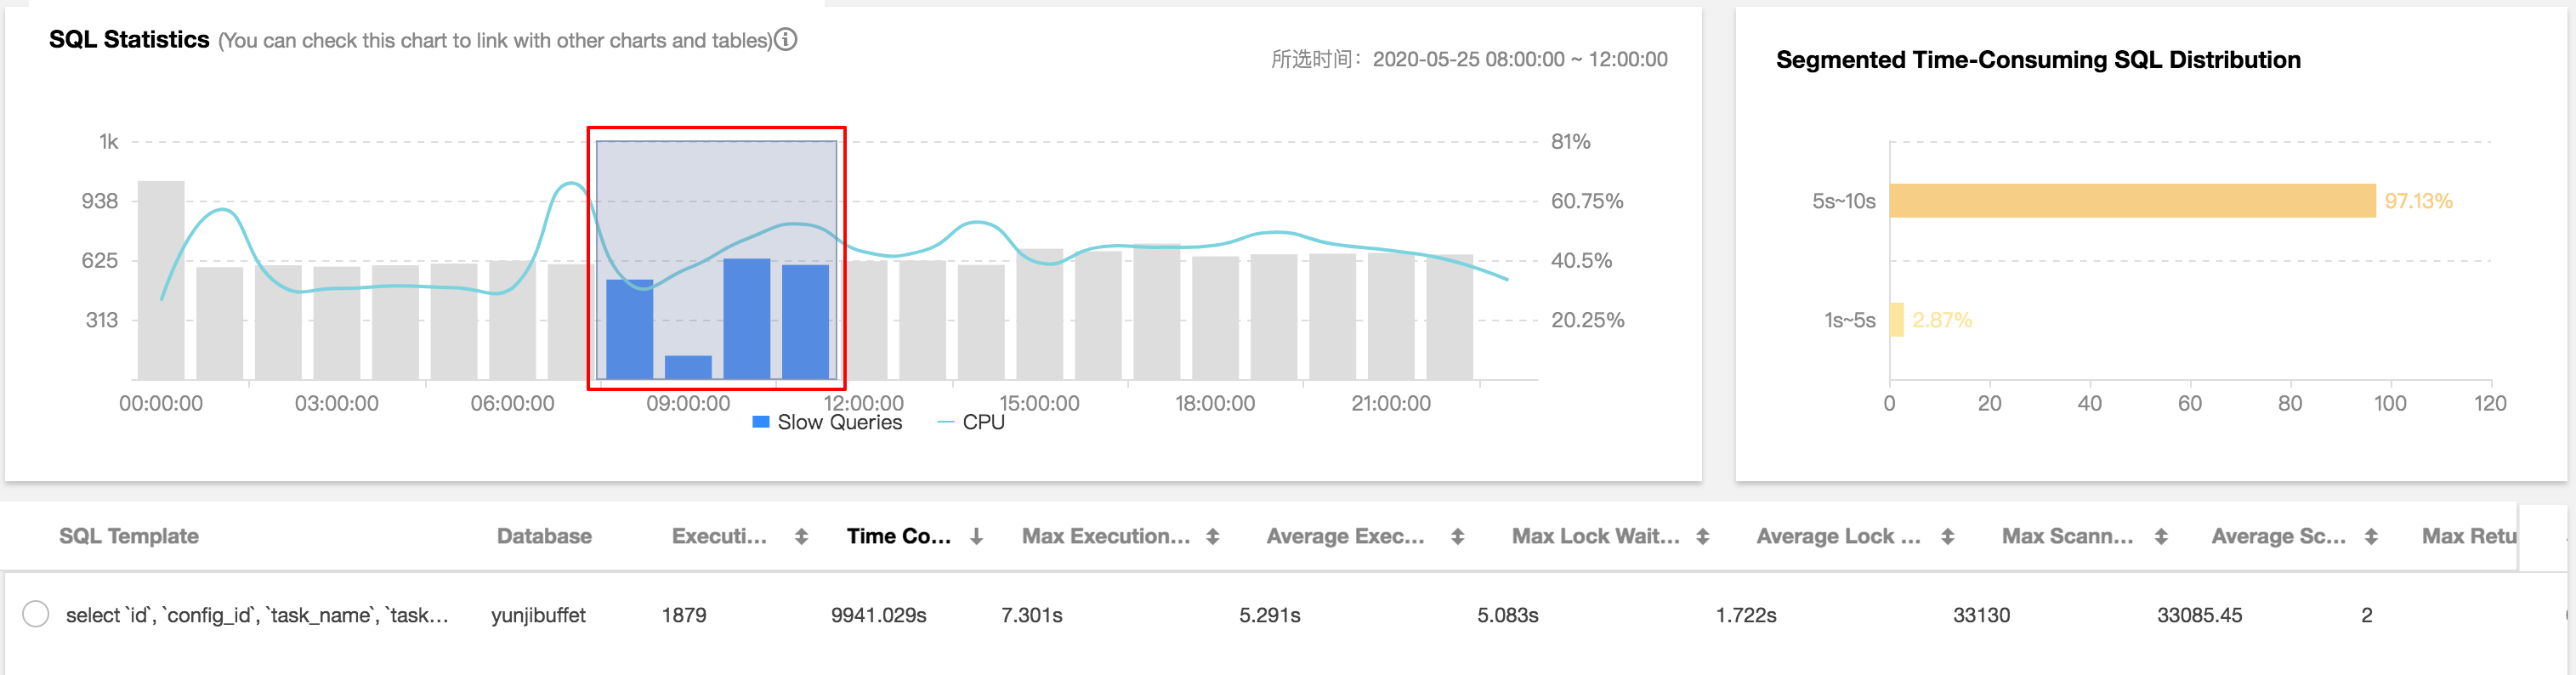
1. Log in to the DBbrain console, select Performance Optimization on the left sidebar, choose the corresponding database at the top, and then select the Slow SQL Analysis tab.
2. Click to select a single time period or drag to select multiple time periods for slow queries (bar chart) on the SQL Statistics chart. The aggregated SQL template and execution information (including the number of executions, total execution time, the number of scanned rows, the number of returned rows, and more) will be displayed below.
3. Click an aggregated SQL template, and specific SQL analysis and statistics will be displayed on the right. You can view the corresponding index advice.
Measure 2: Improving the Configuration of TDSQL-C for MySQL
View the QPS stress test data for each specification, compare it with the QPS data of the current instance, and adjust the corresponding compute configuration.
Was this page helpful?
You can also Contact Sales or Submit a Ticket for help.
Yes
No
Feedback