QAPM supports conditional filtering in multiple dimensions. After the conditions are selected, filtering will be performed.
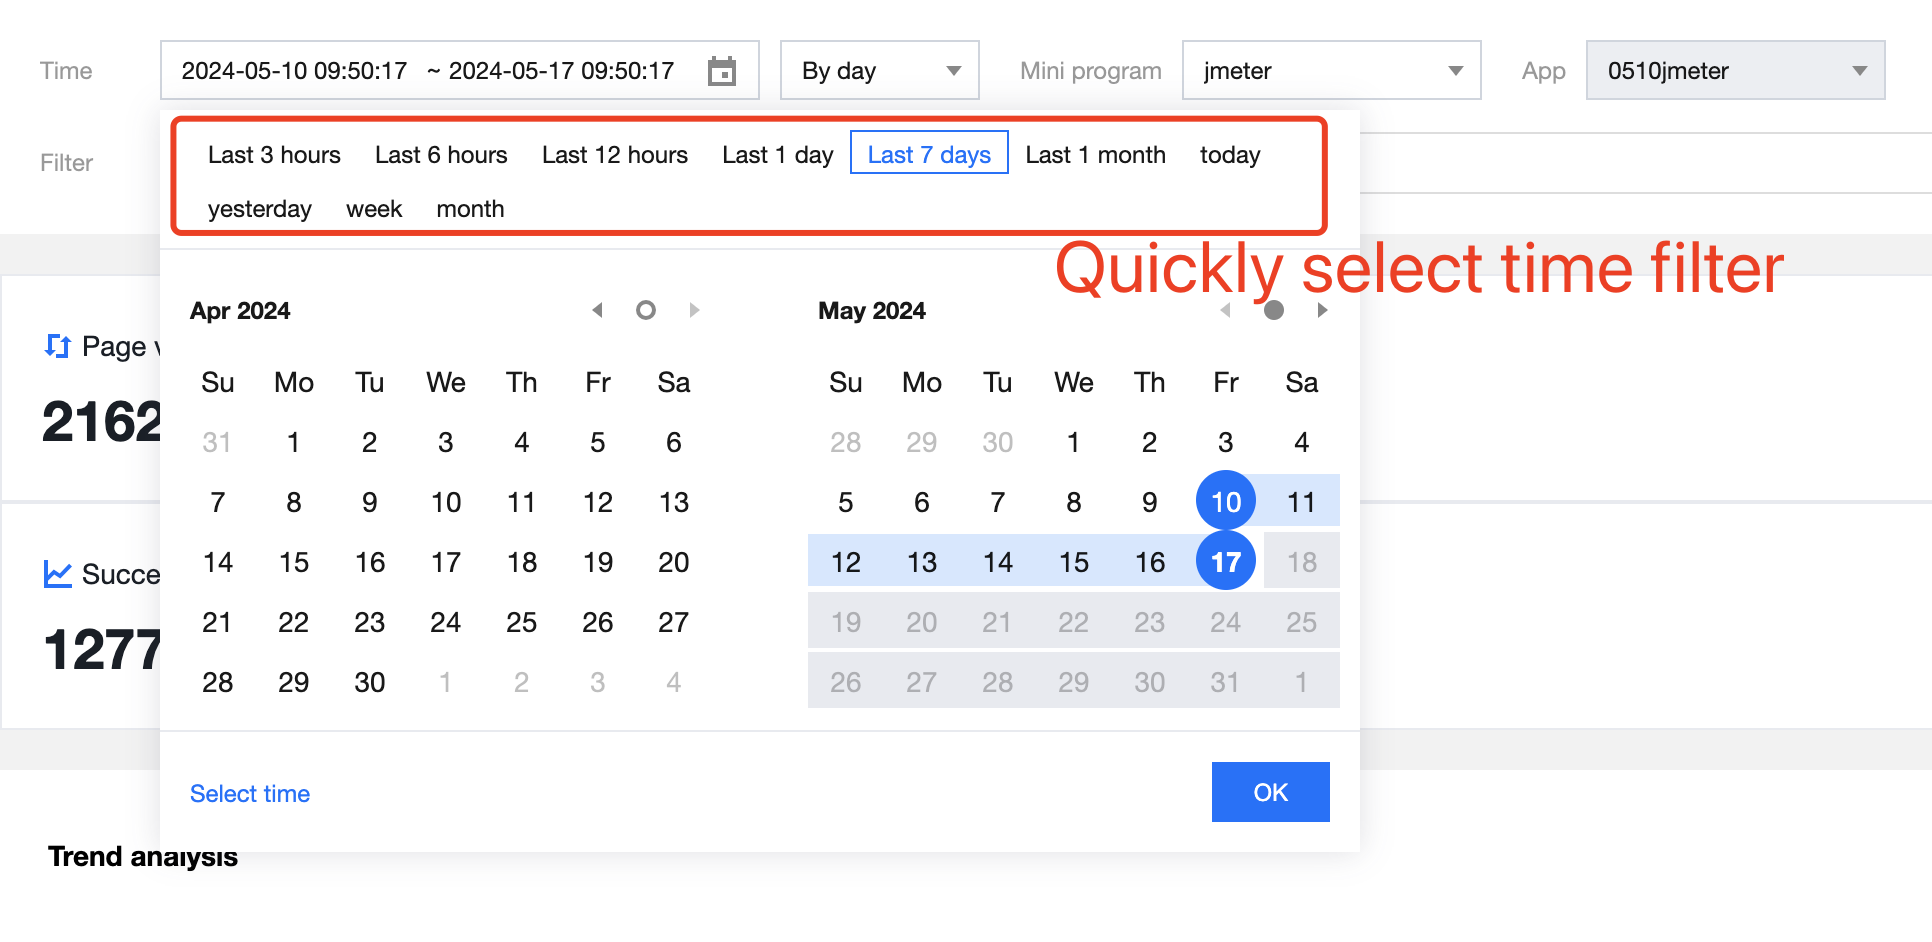
Data of the latest 30 days can be queried in QAPM. You can use the time picker at the top of the page to select a time range and specify a time granule for the selected time range. The time granule options and query conditions vary depending on the time range specified.
1.2 Metric analysis
This module allows you to view the overall trend of the specified metric and the trend of top values in the specified dimension, for example, crash rate trend of top 7 versions. For certain metrics, percentile analysis and distribution analysis are also supported.
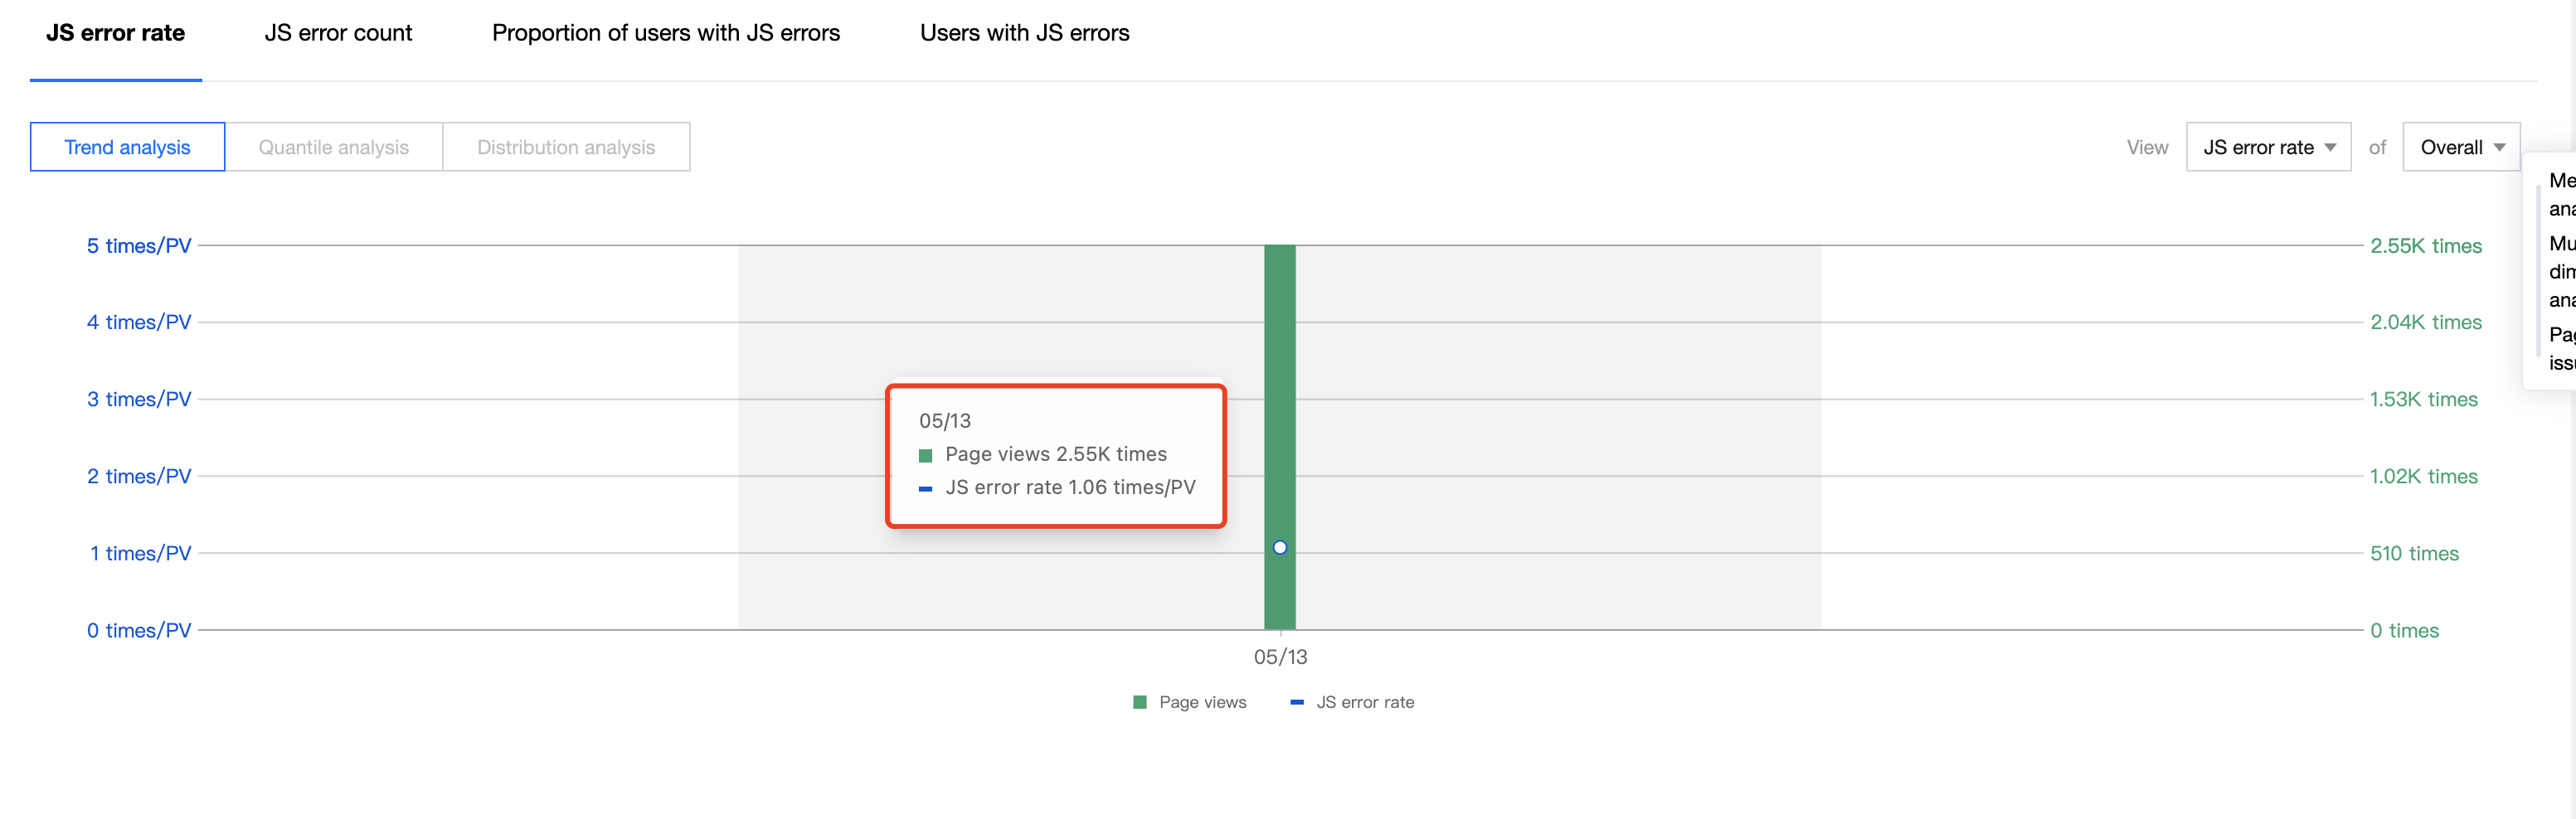
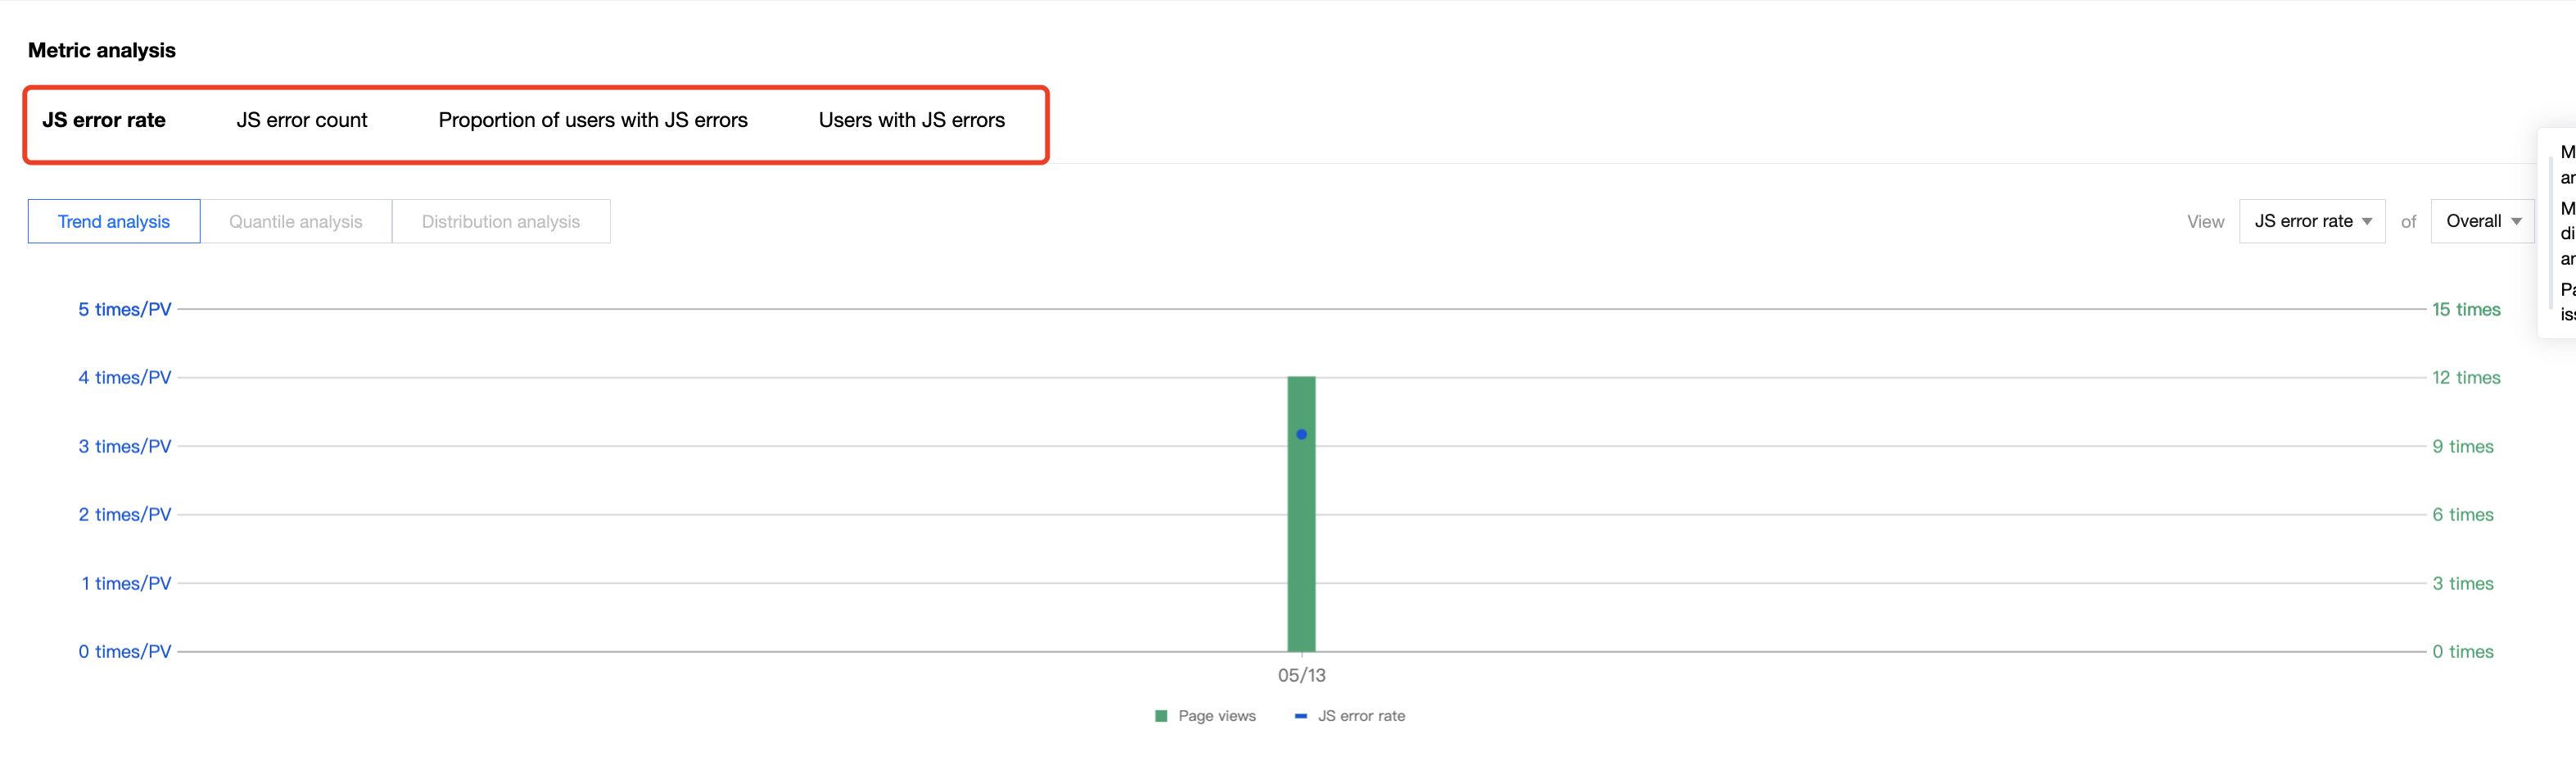
1.2.1 Trend analysis
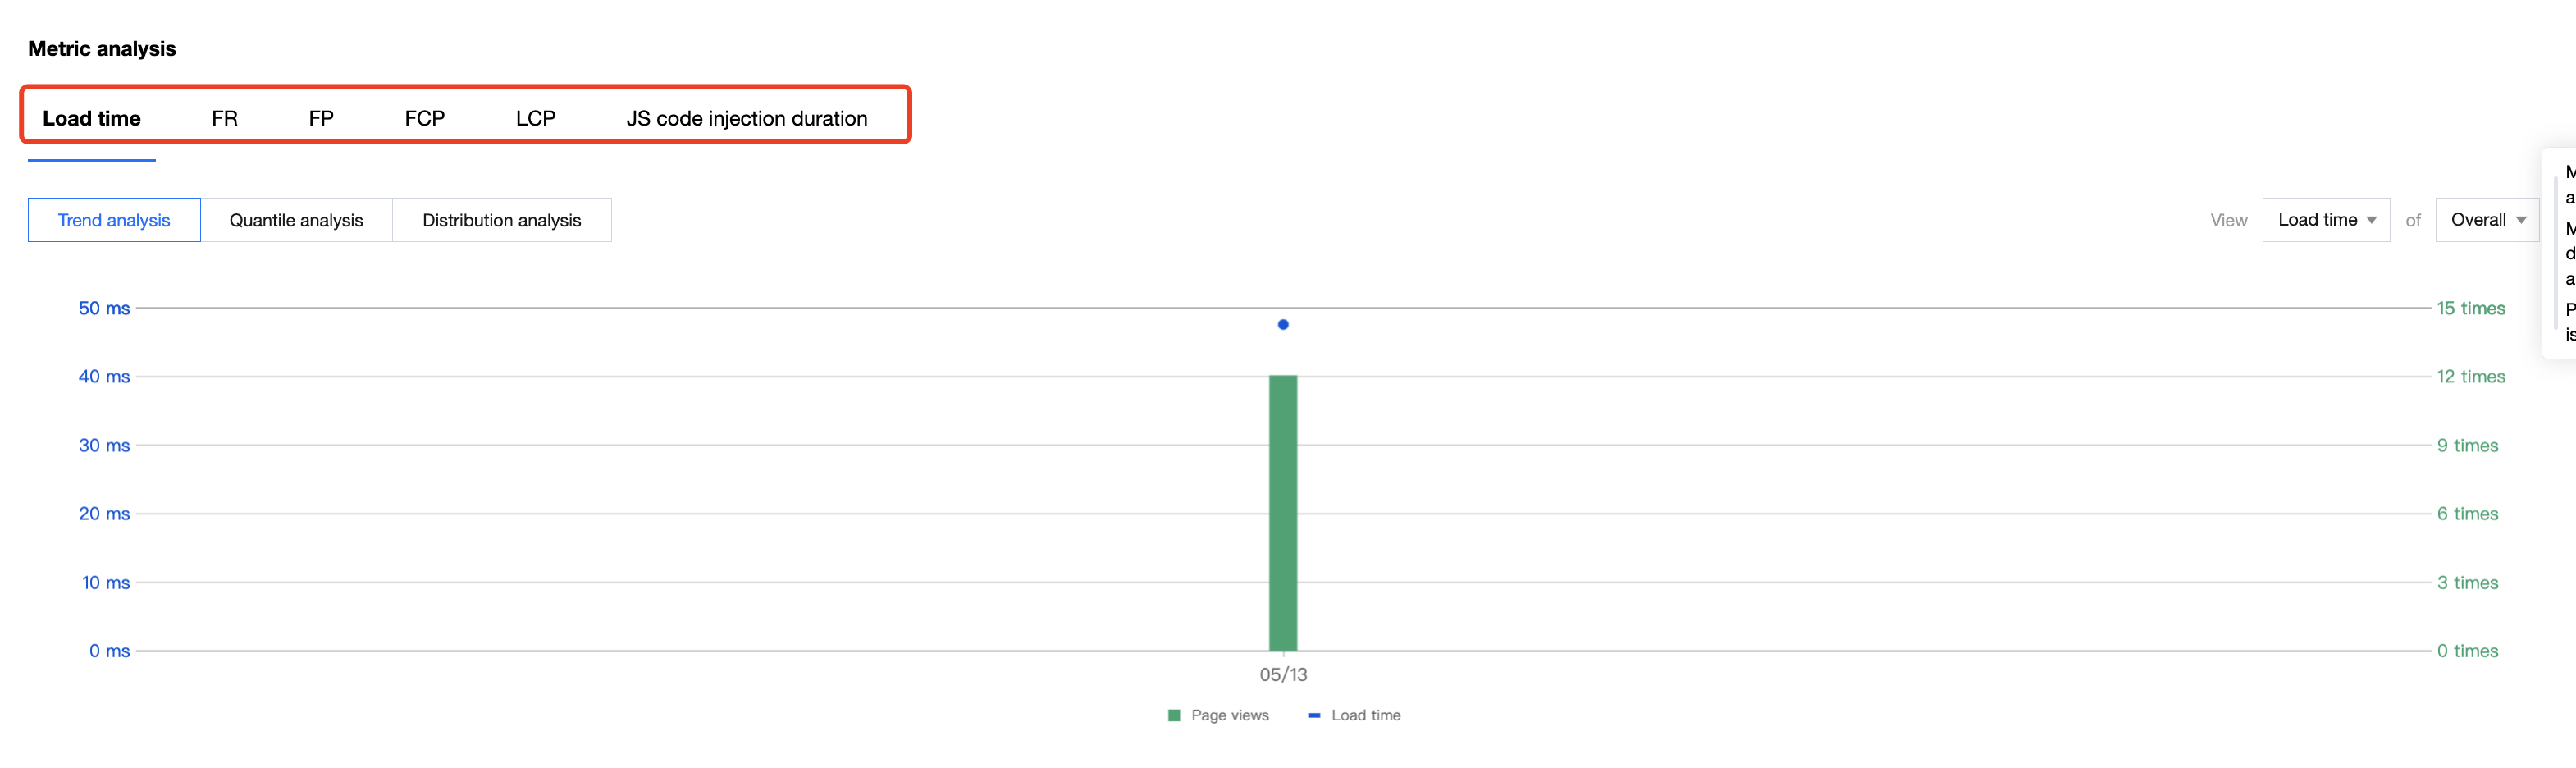
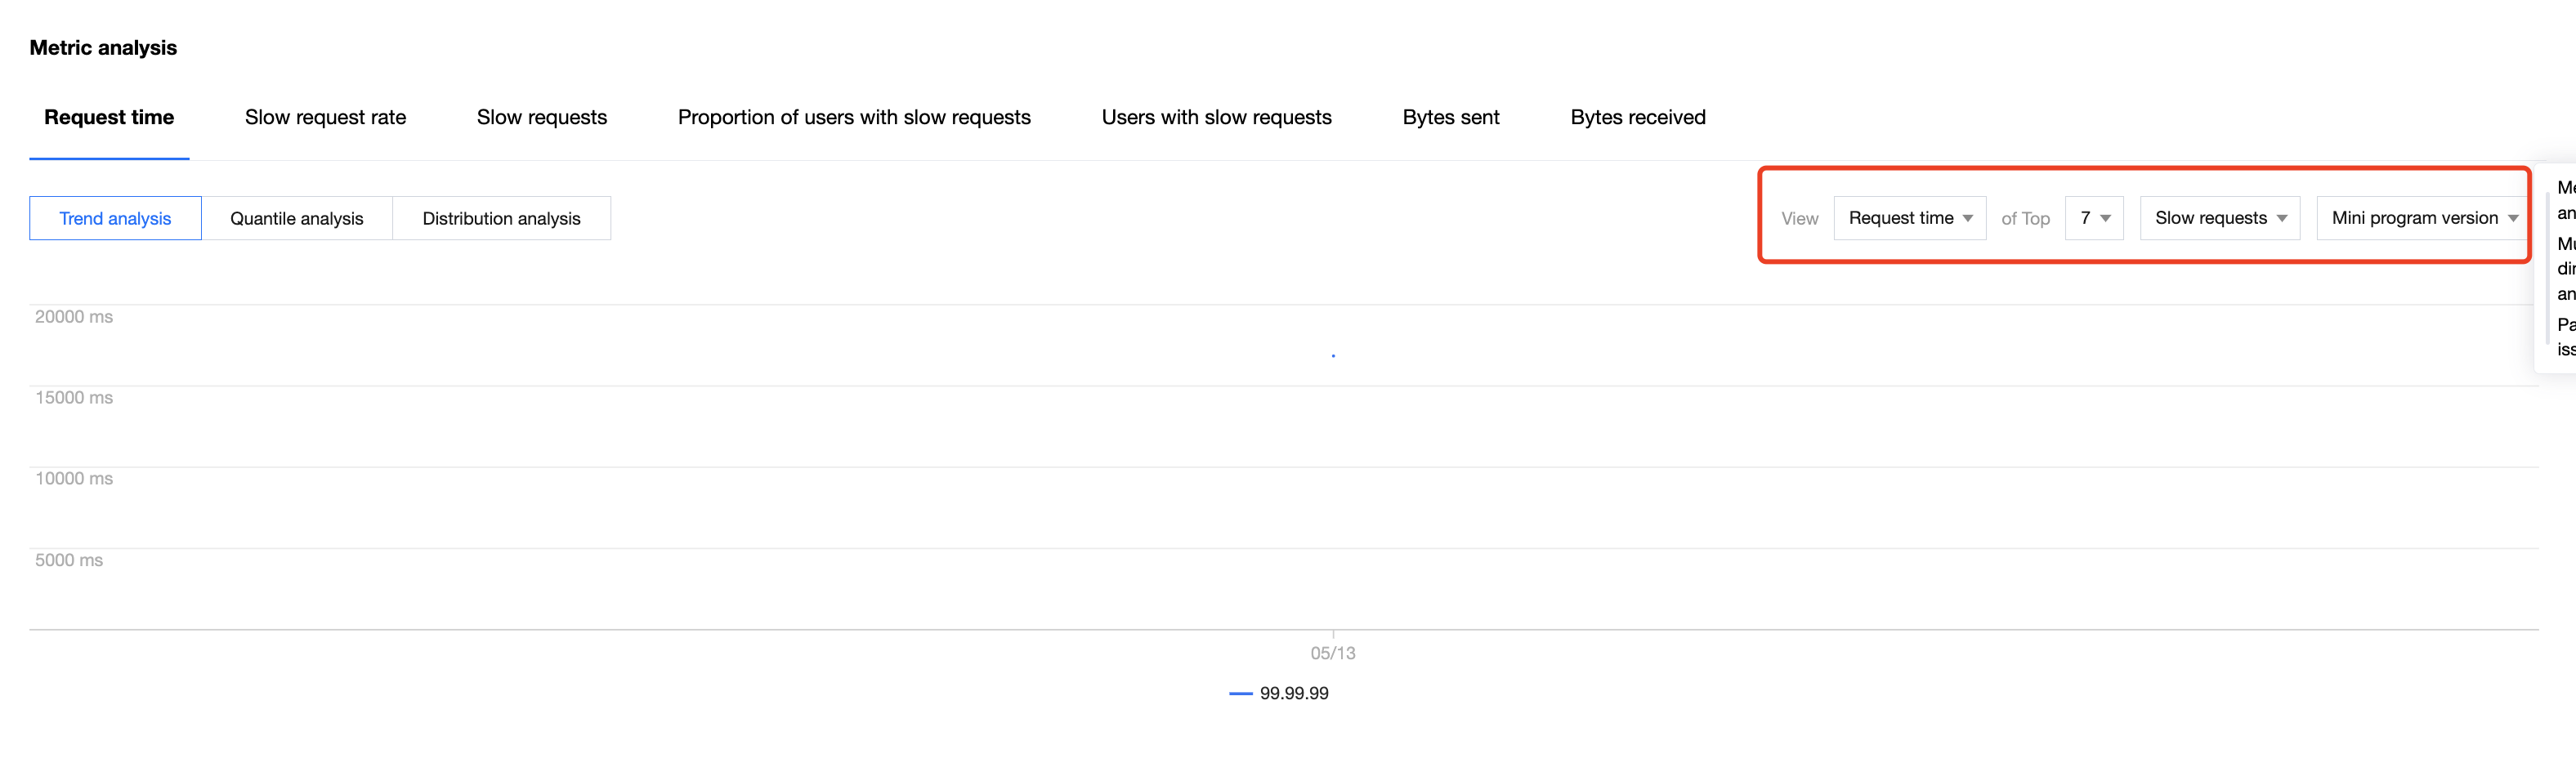
Trend analysis allows you to view the trend of the specified metric over time and hover over the point on the chart corresponding to a time point to view the data. Here, the line chart displays the trend of the specified metric, and the column chart displays the sample volume of the metric. You can combine the two to get more information.
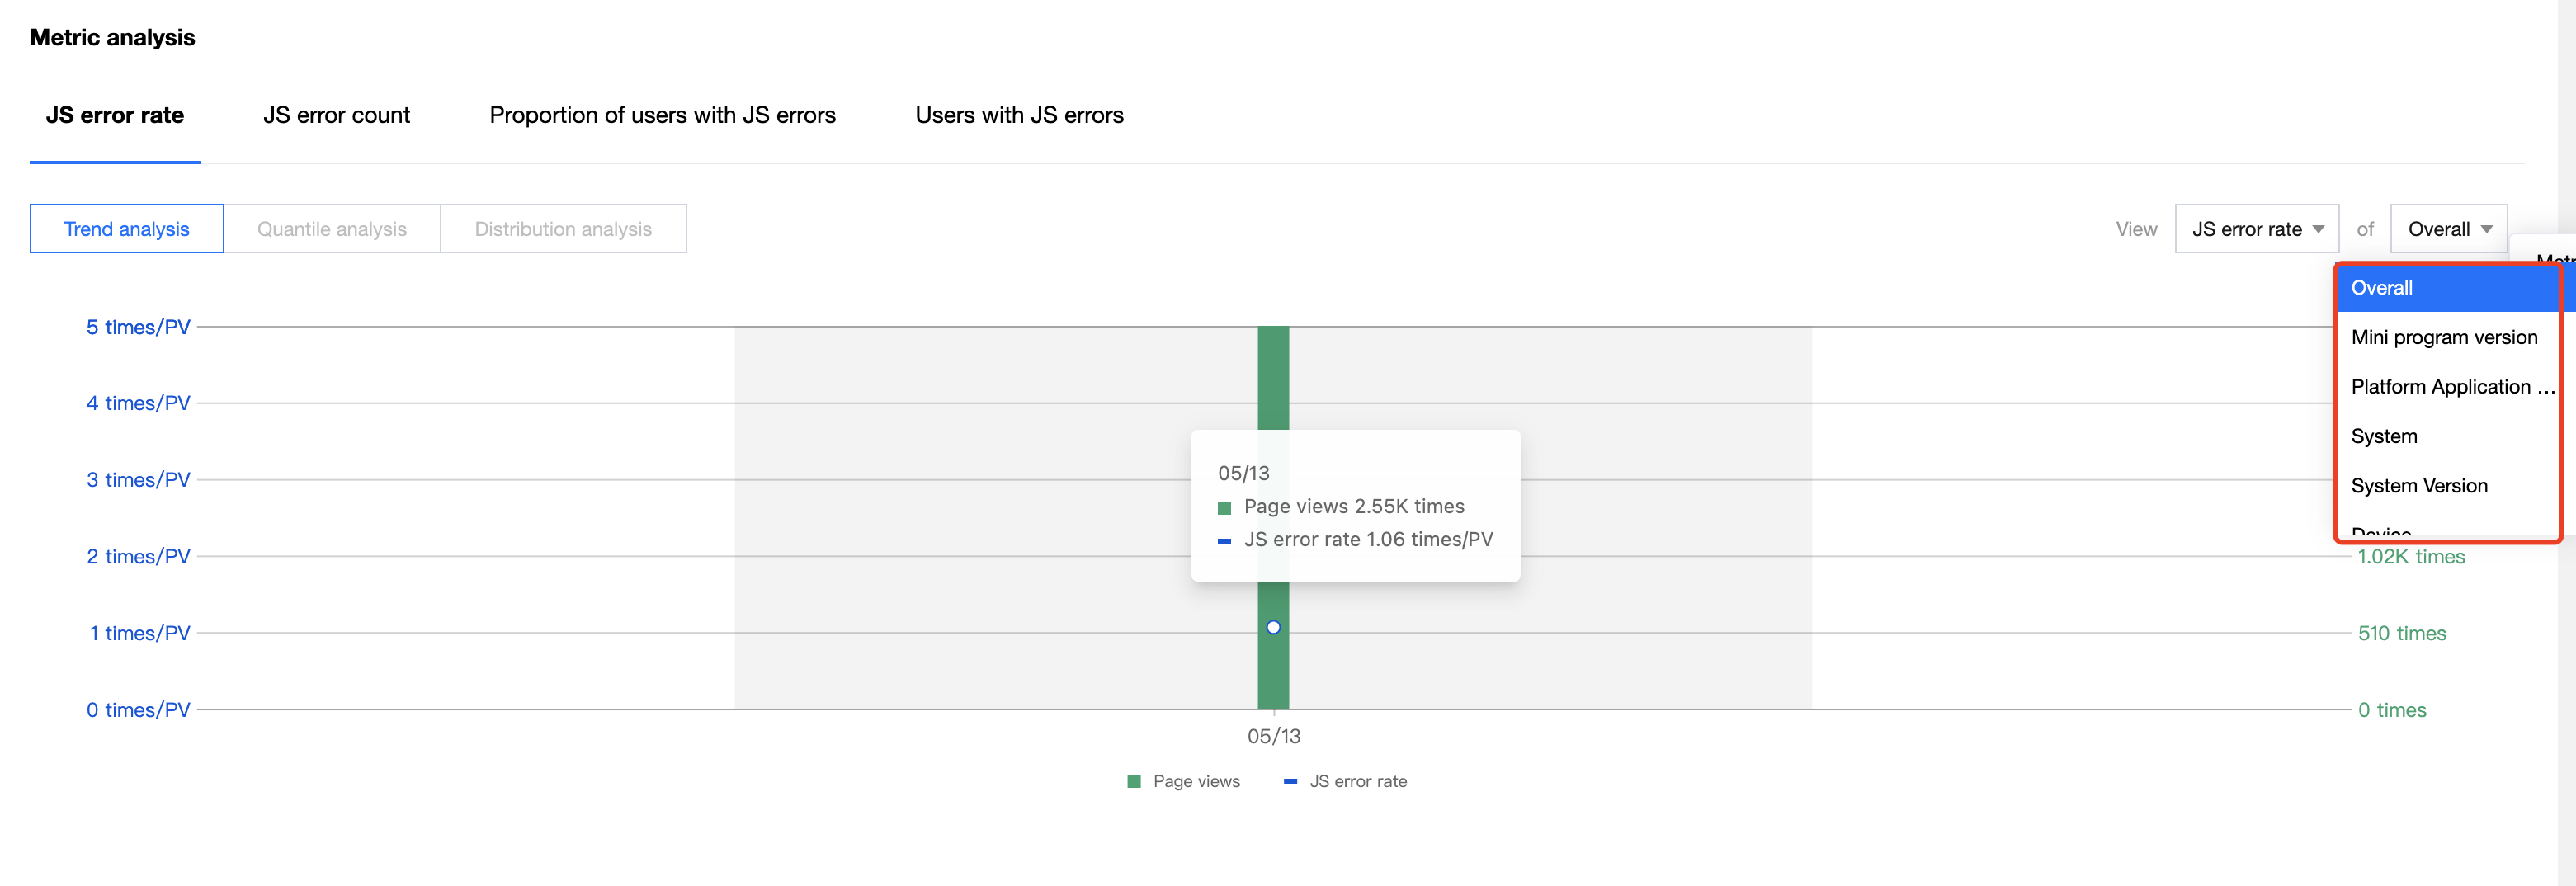
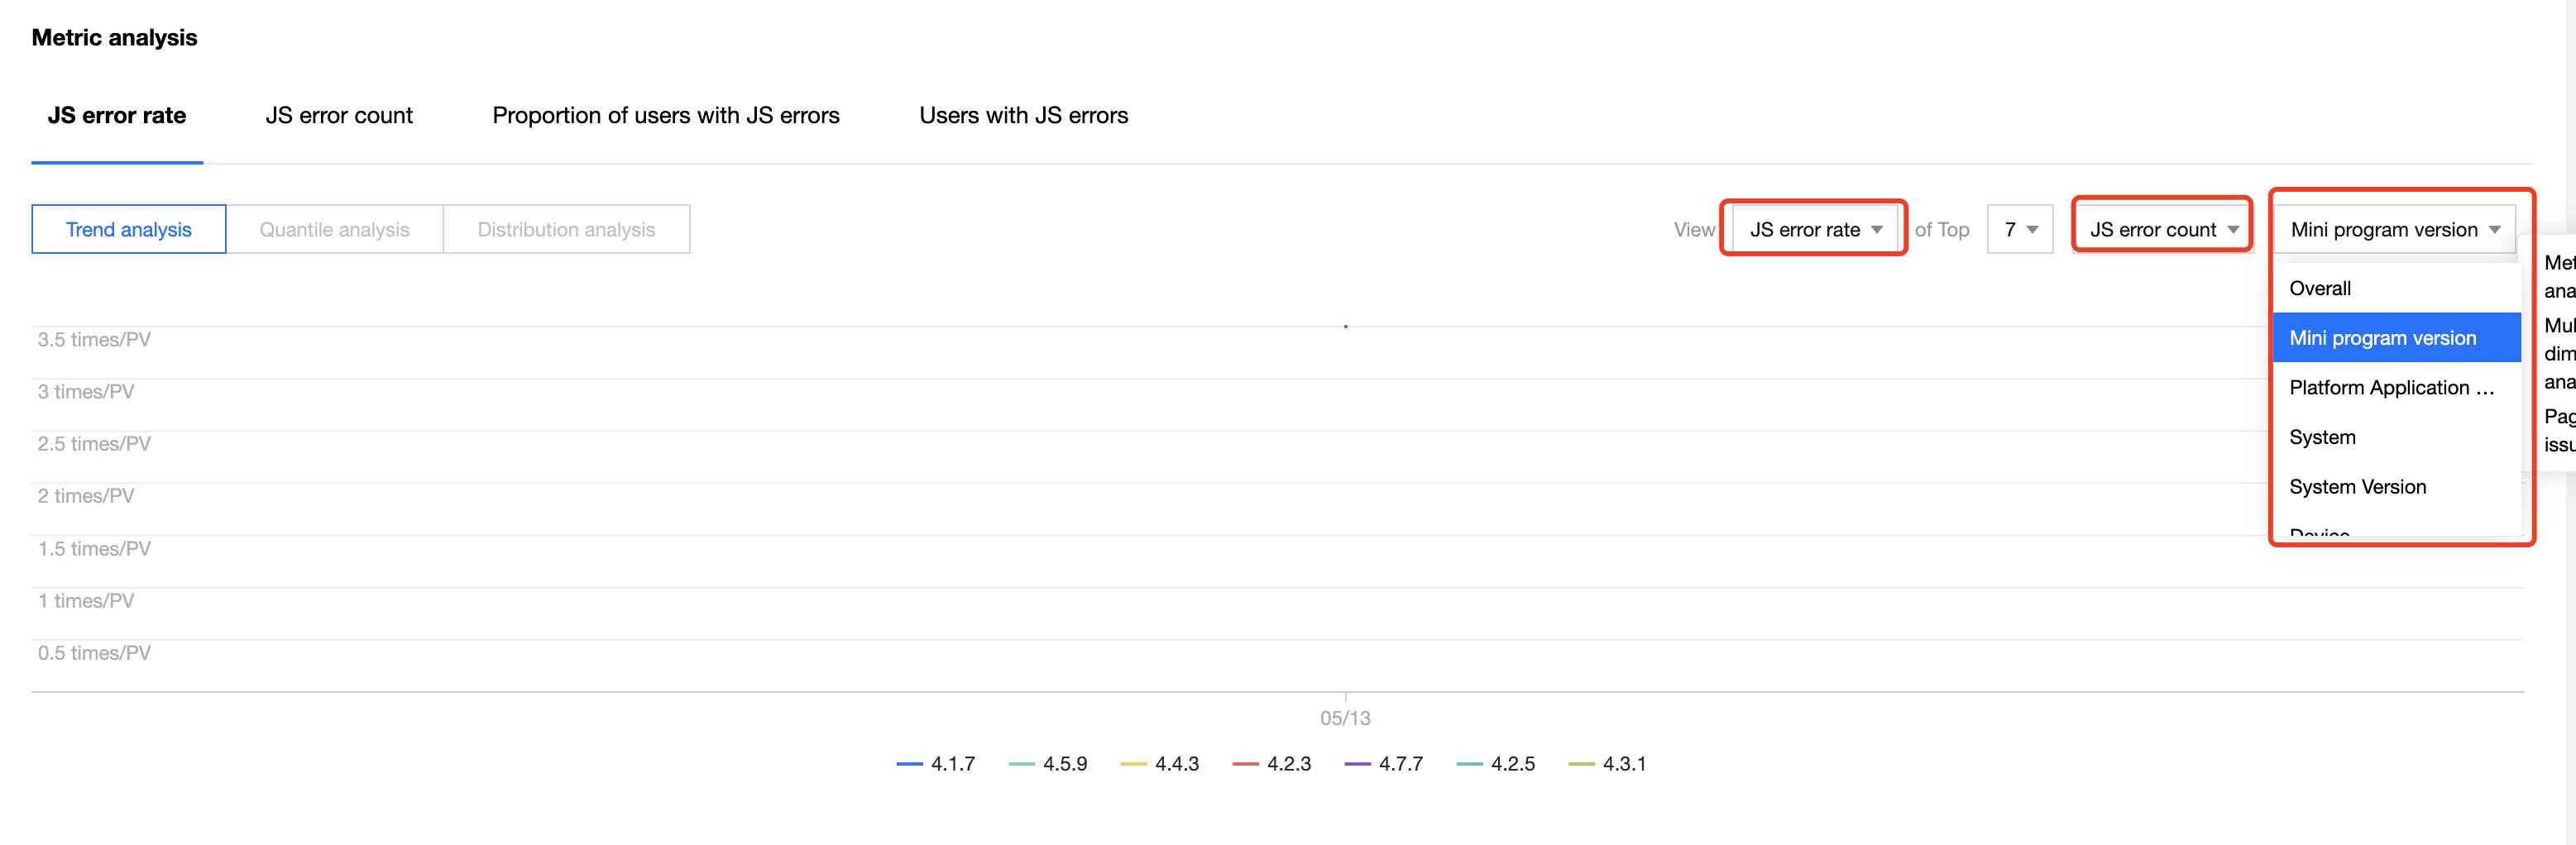
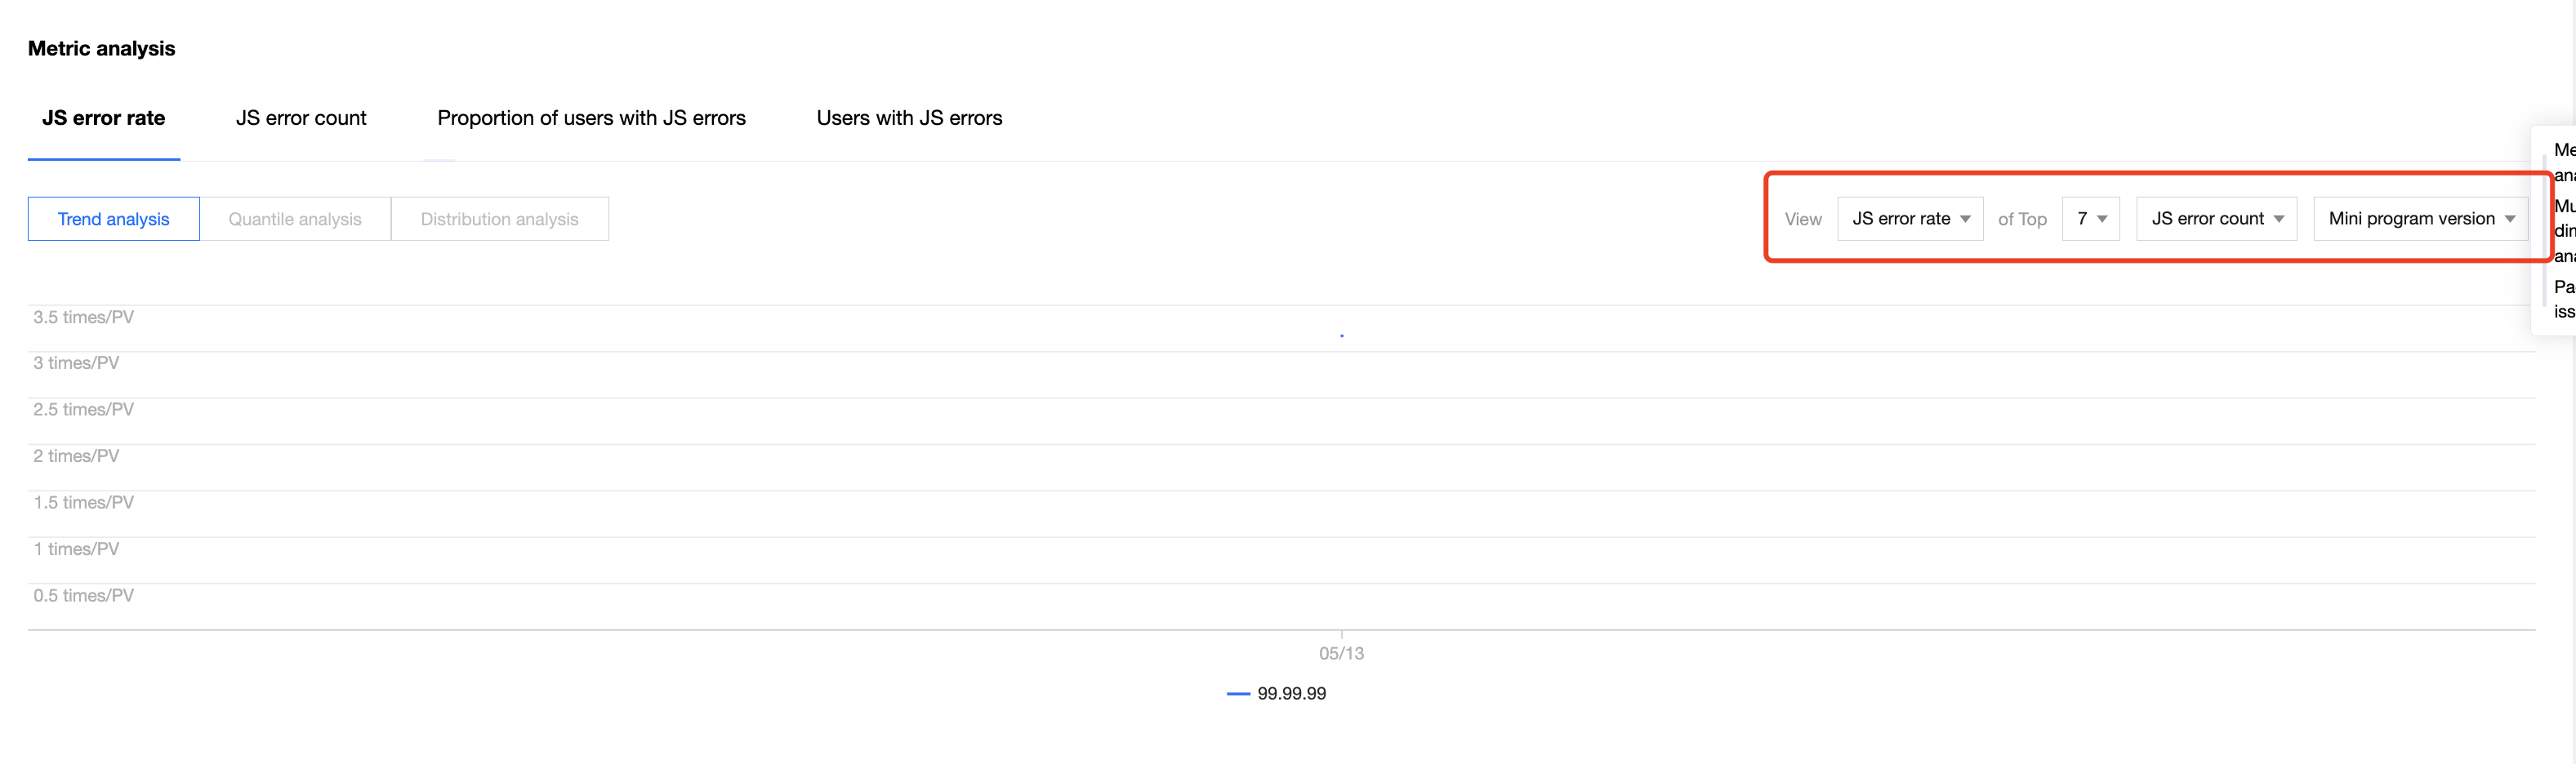
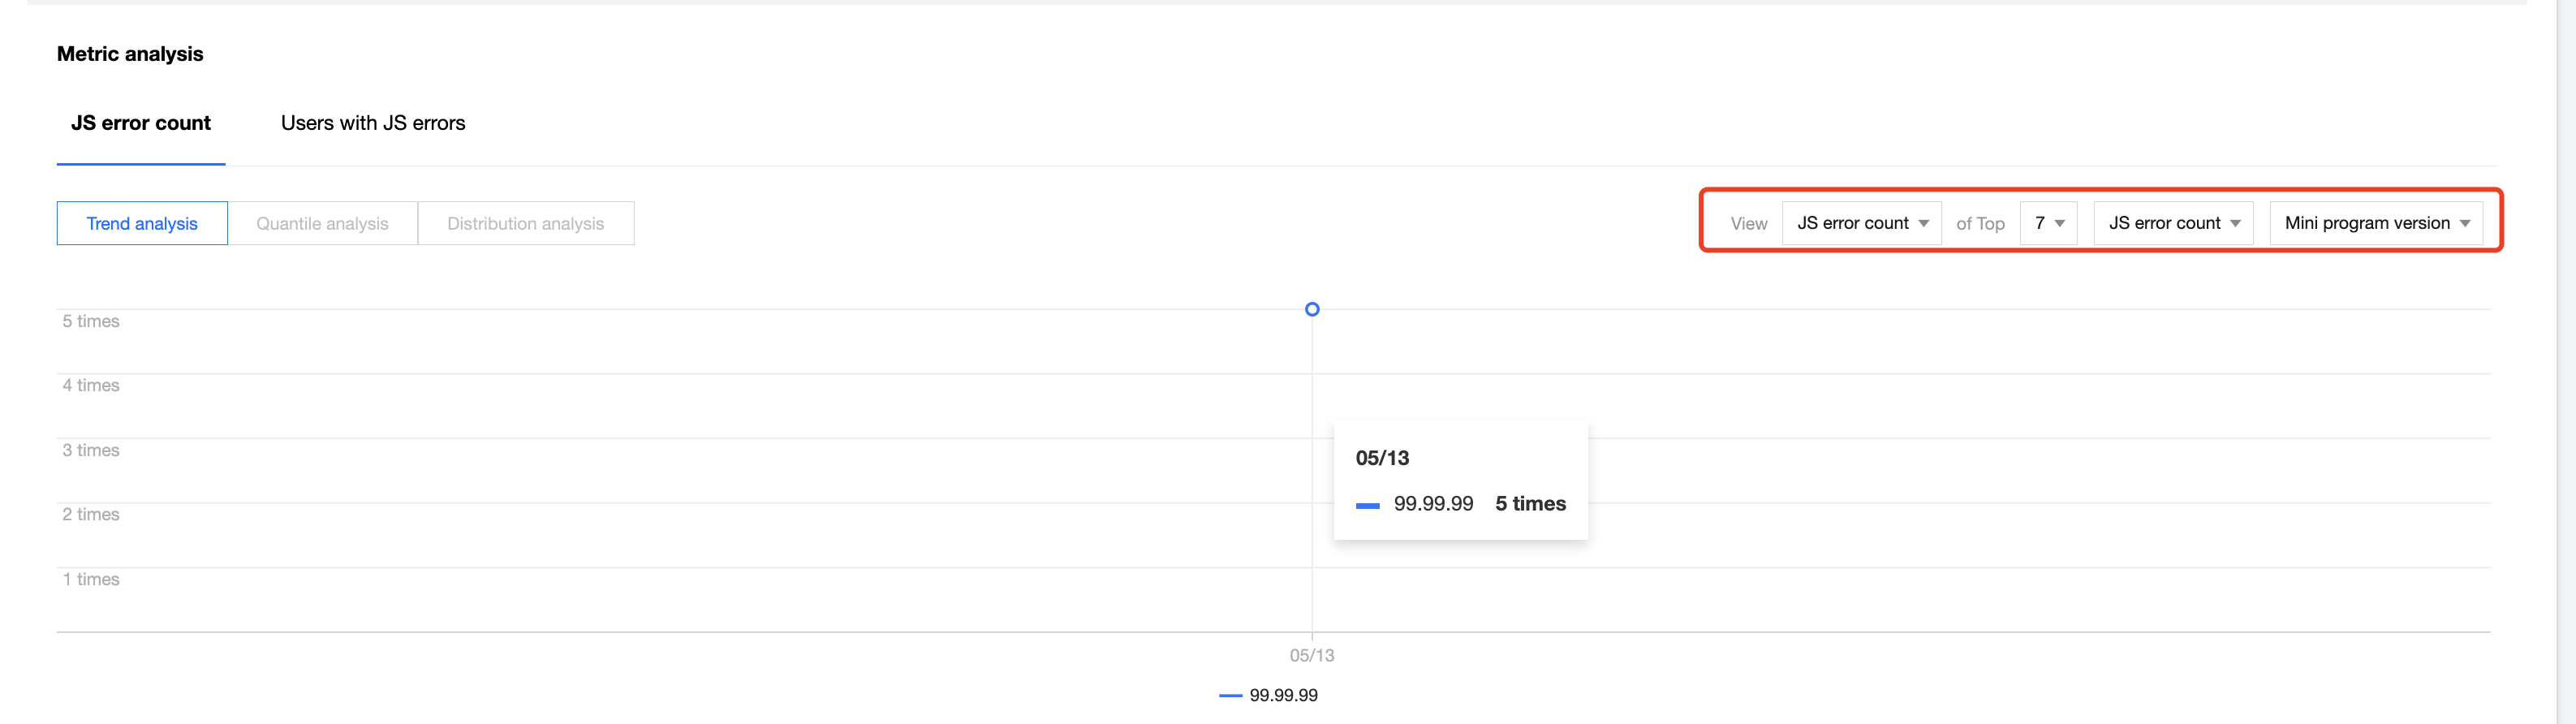
1.2.2 Group analysis
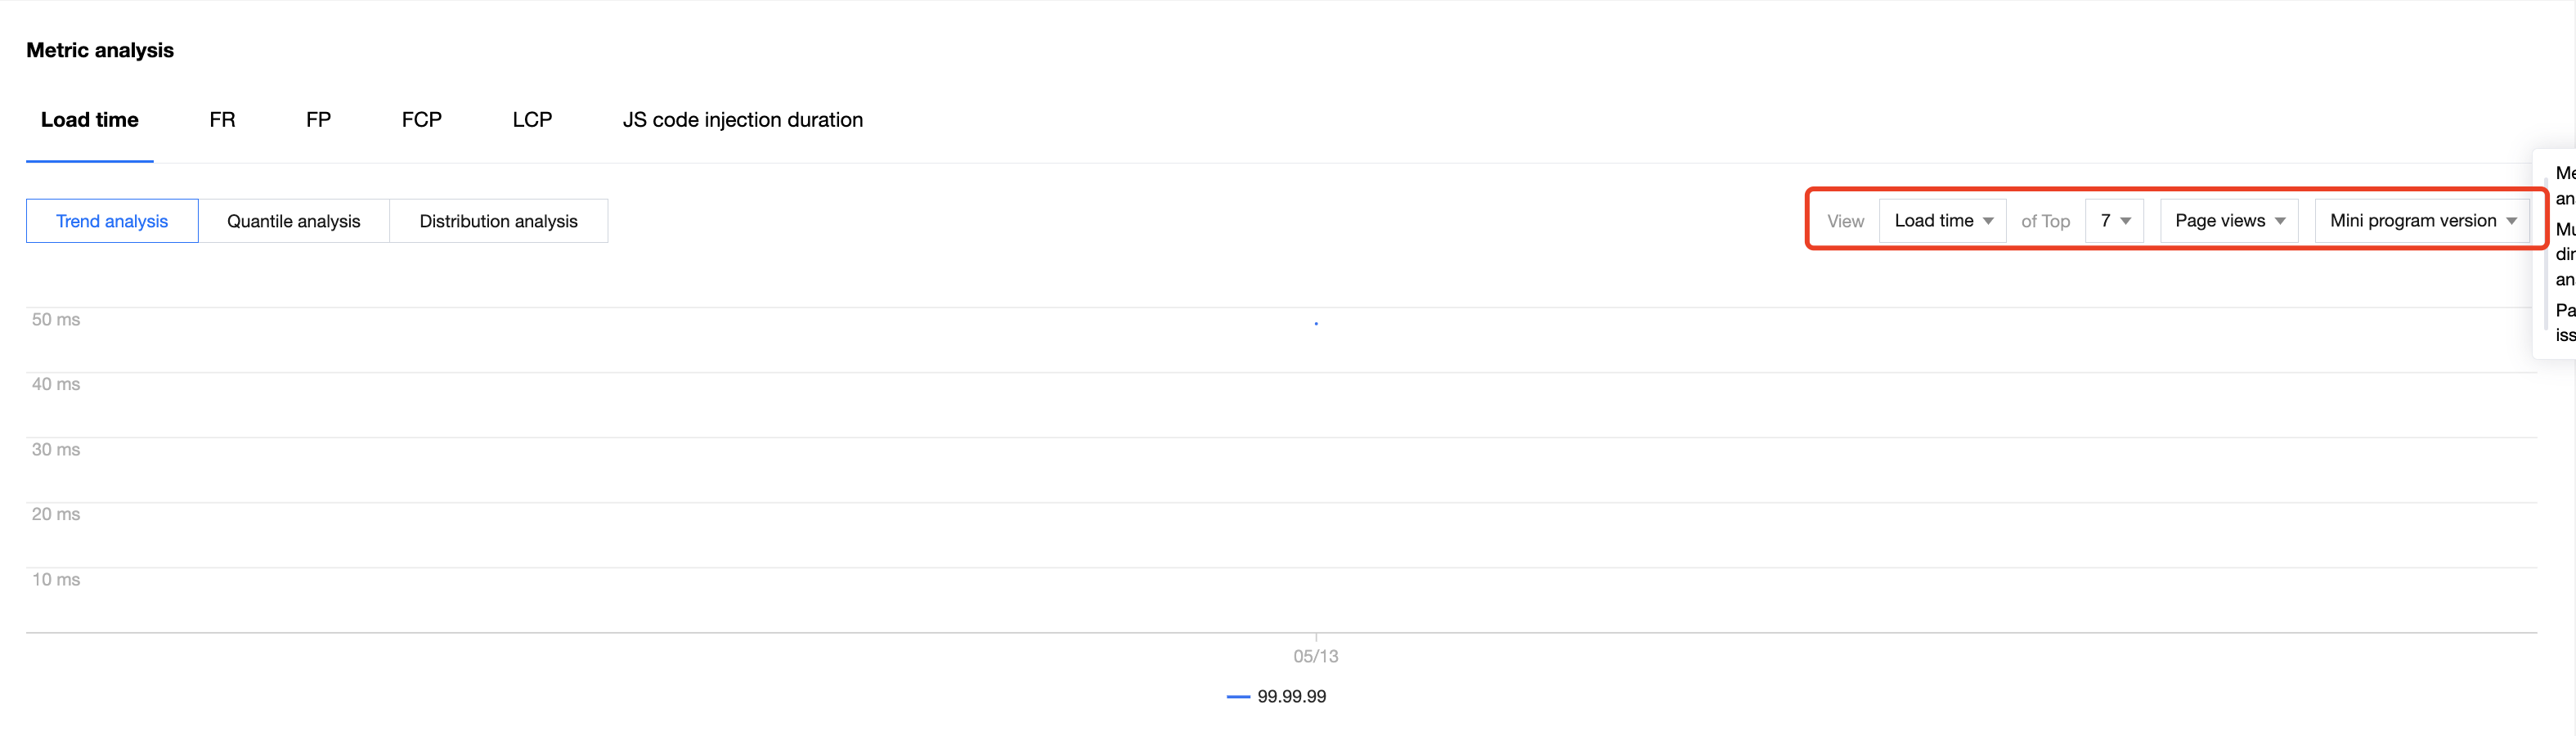
You can switch to the group analysis mode using the drop-down list on the right of the "Trend analysis" tab page.
In group analysis mode, you can specify a metric and a sorting order to view the top N value trend. You can also change the metric as needed to obtain more information.
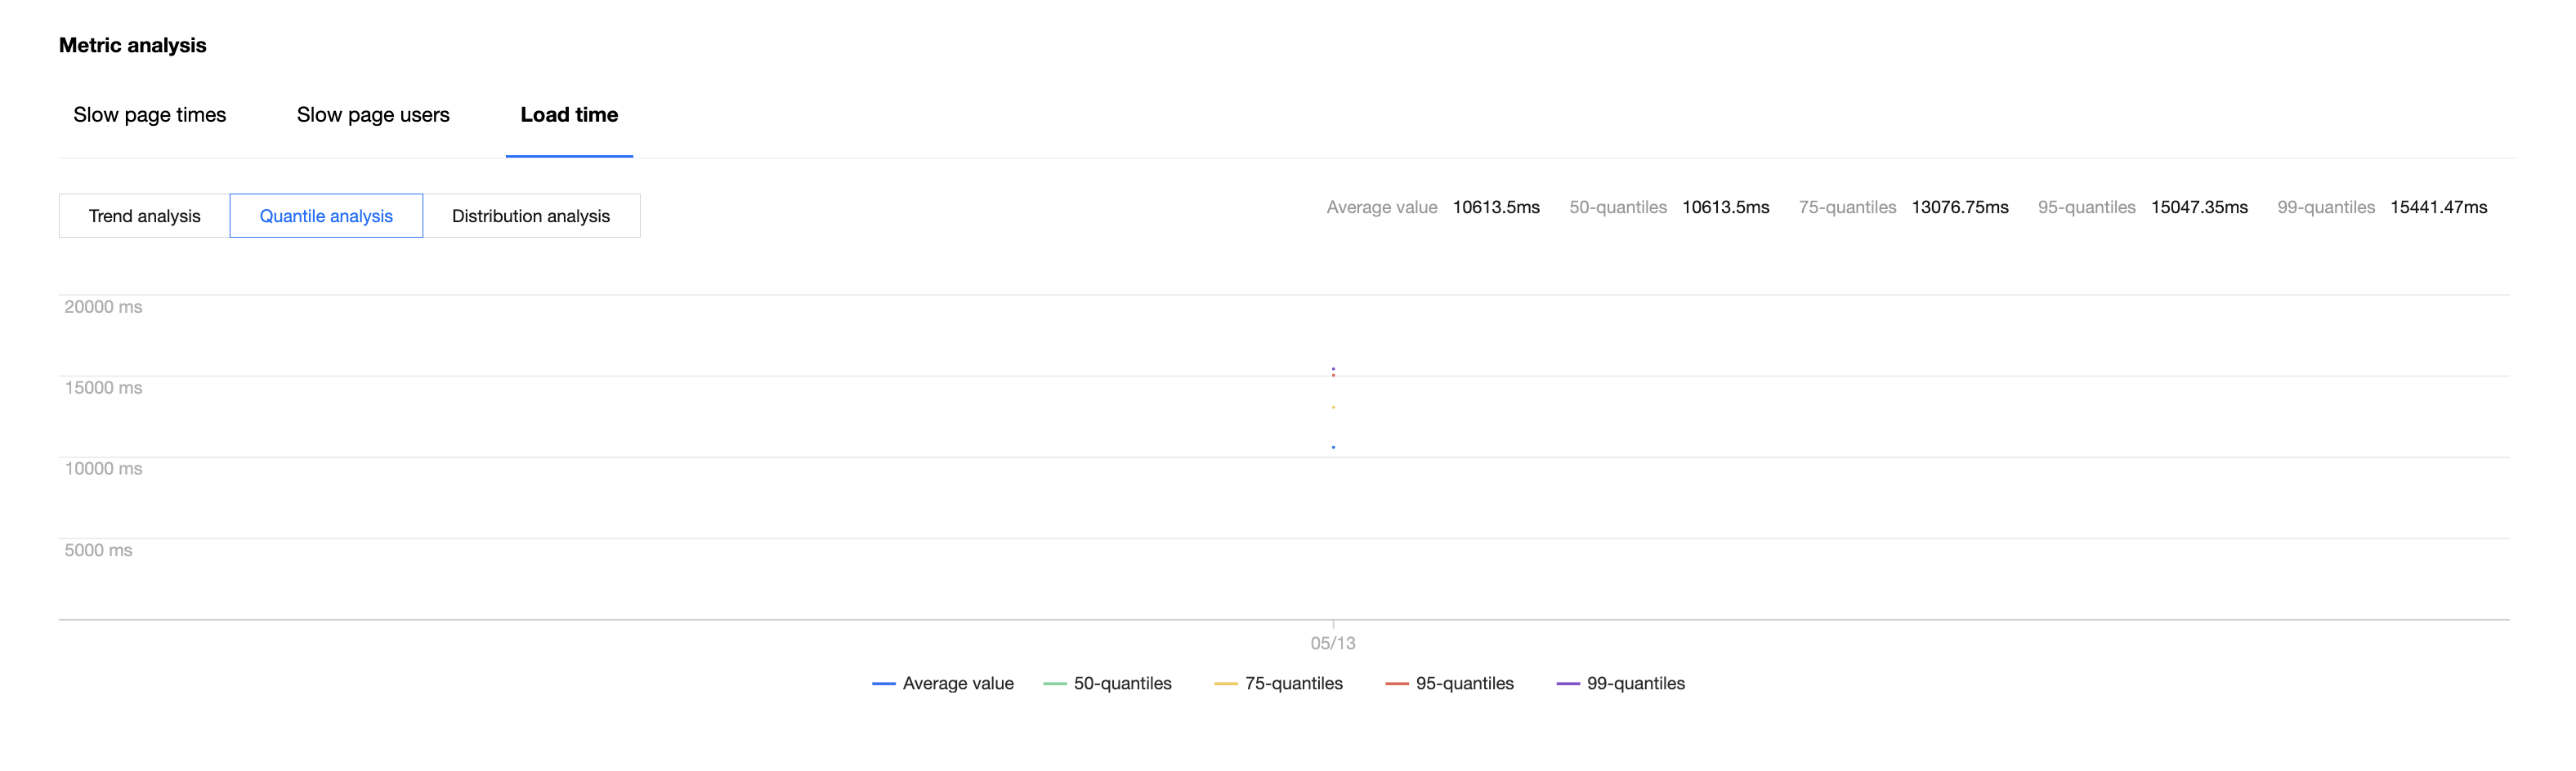
1.2.3 Percentile analysis
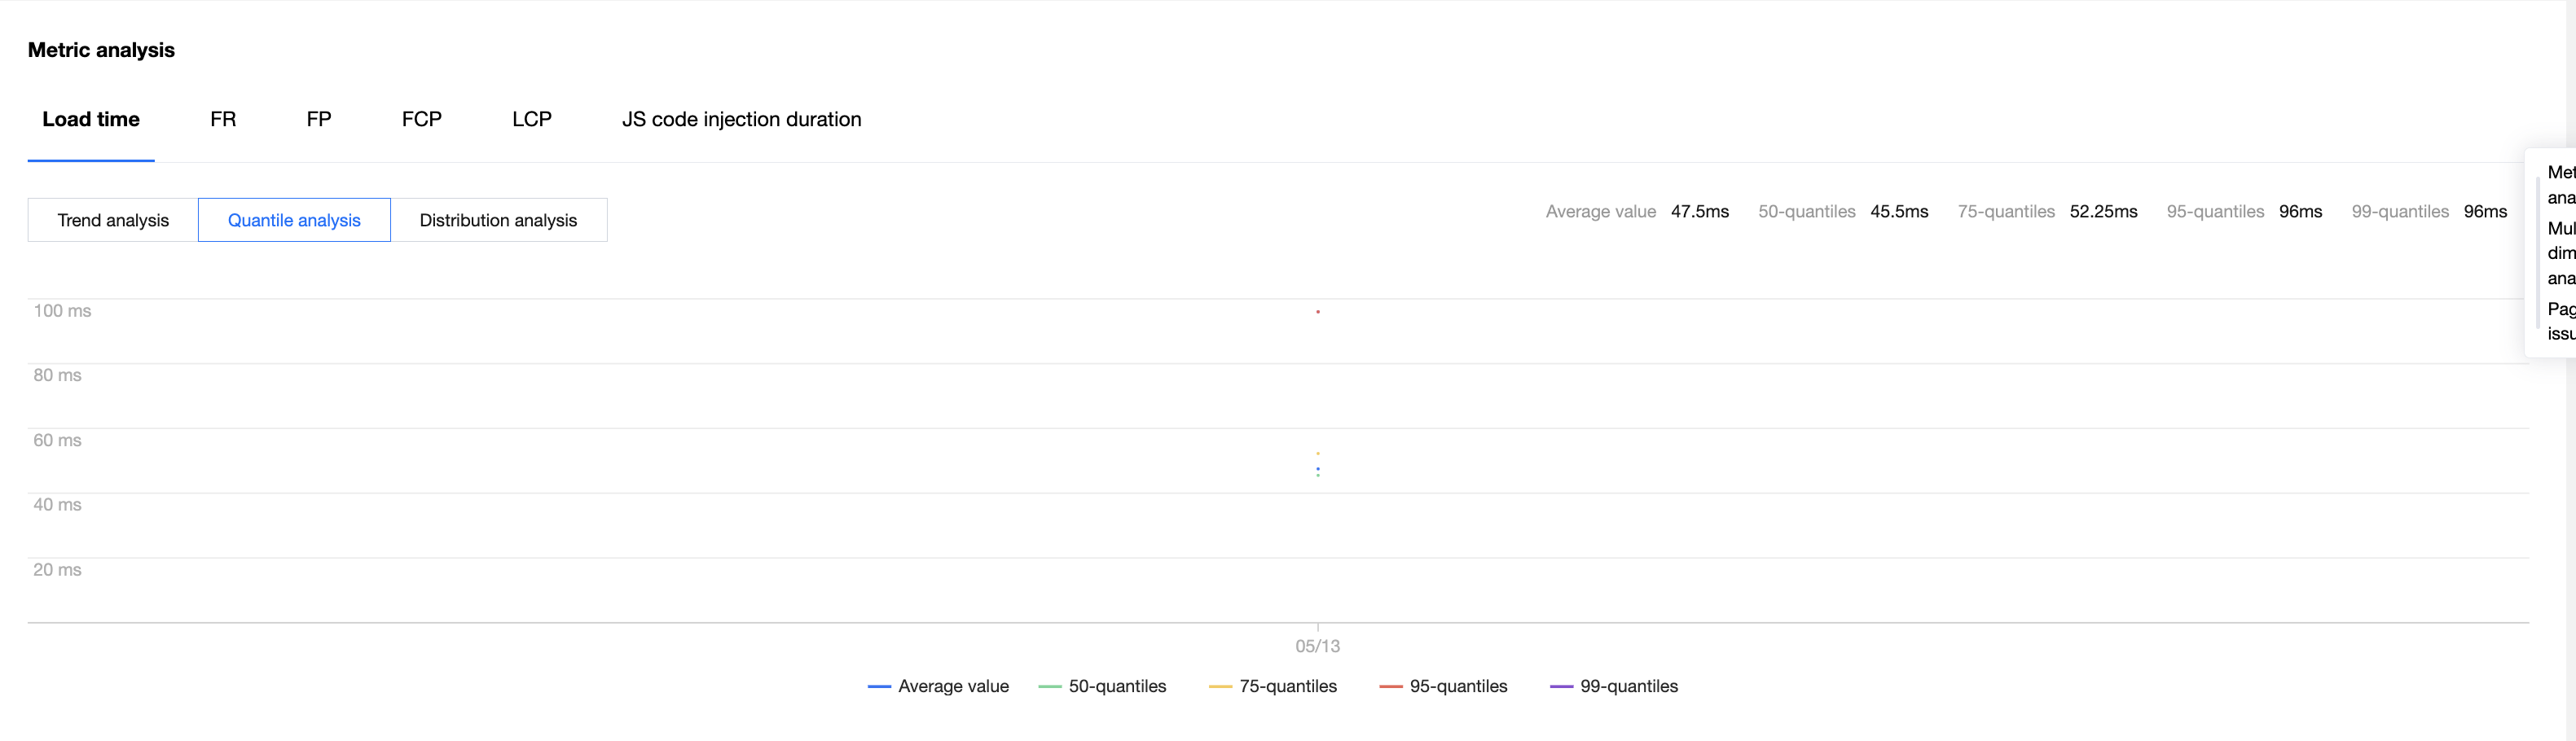
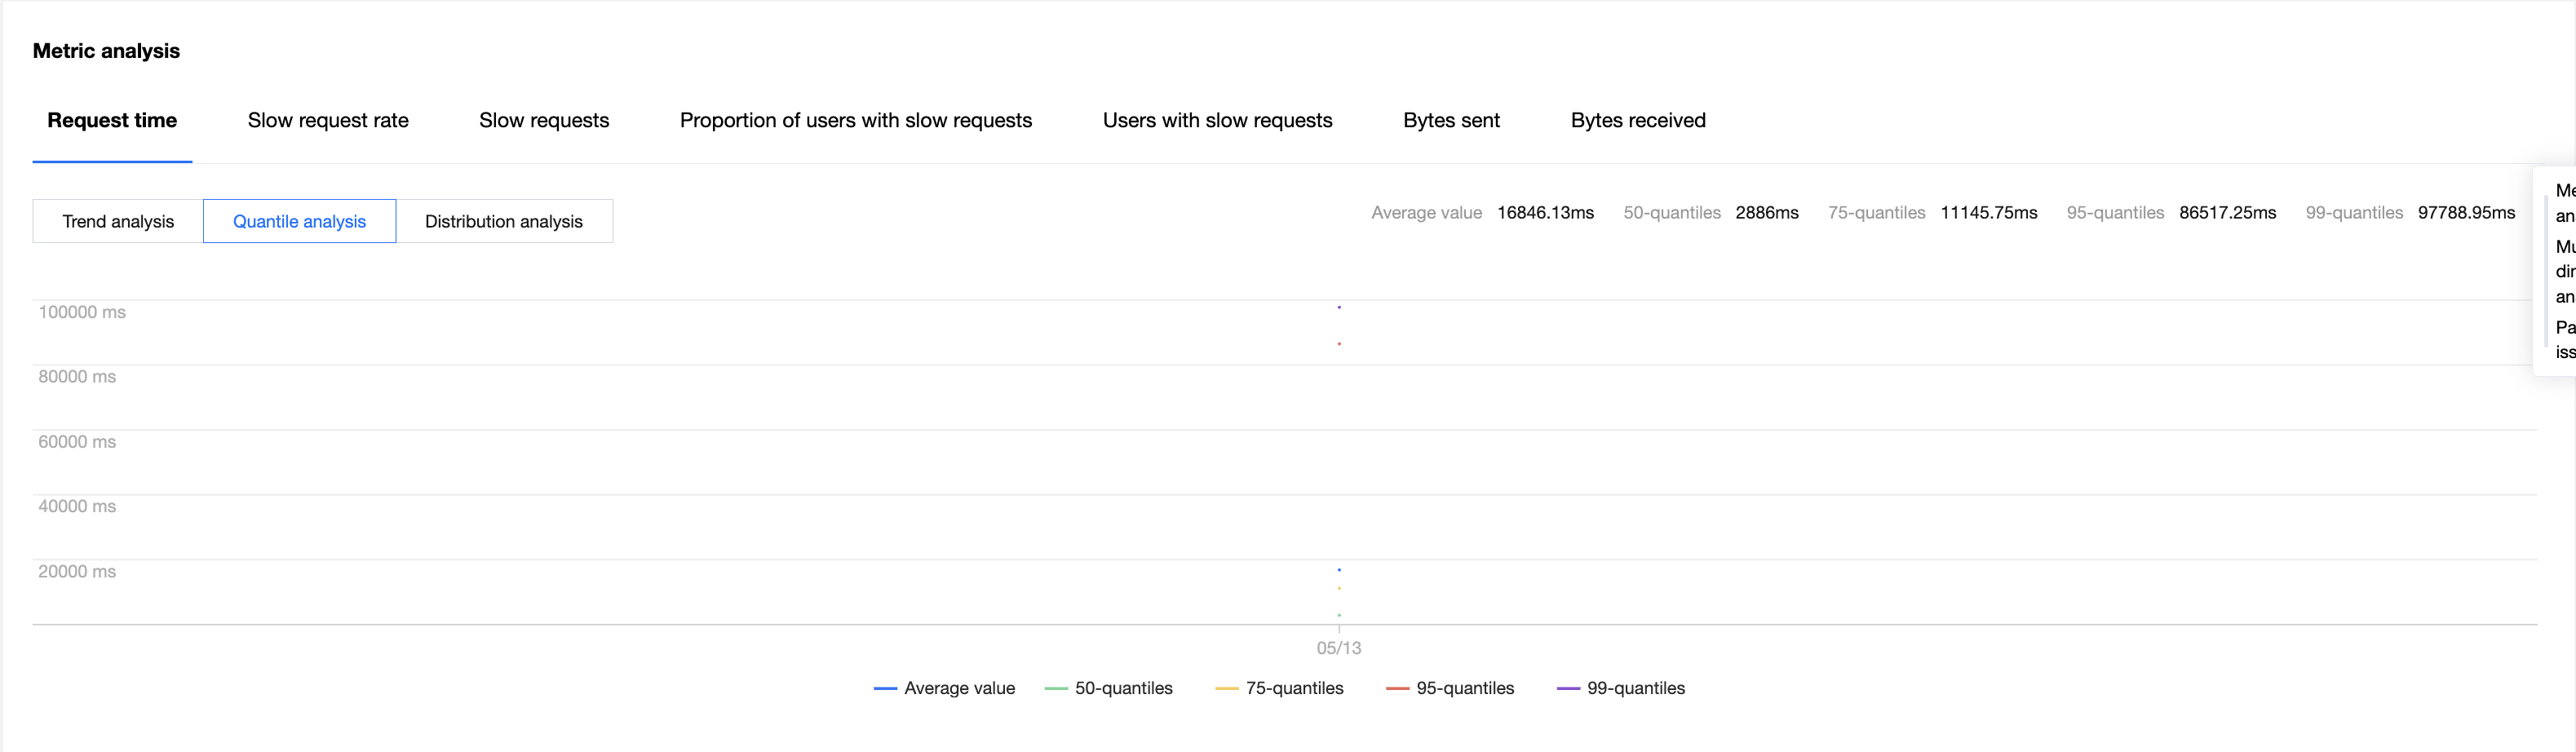
By default, the percentile analysis feature displays the trends of the mean value, 50th percentile, 75th percentile, 95th percentile, and 99th percentile of the specified metric, so that you can get a comprehensive picture of the layered trends of the sample data and locate the cause of abnormal fluctuations.
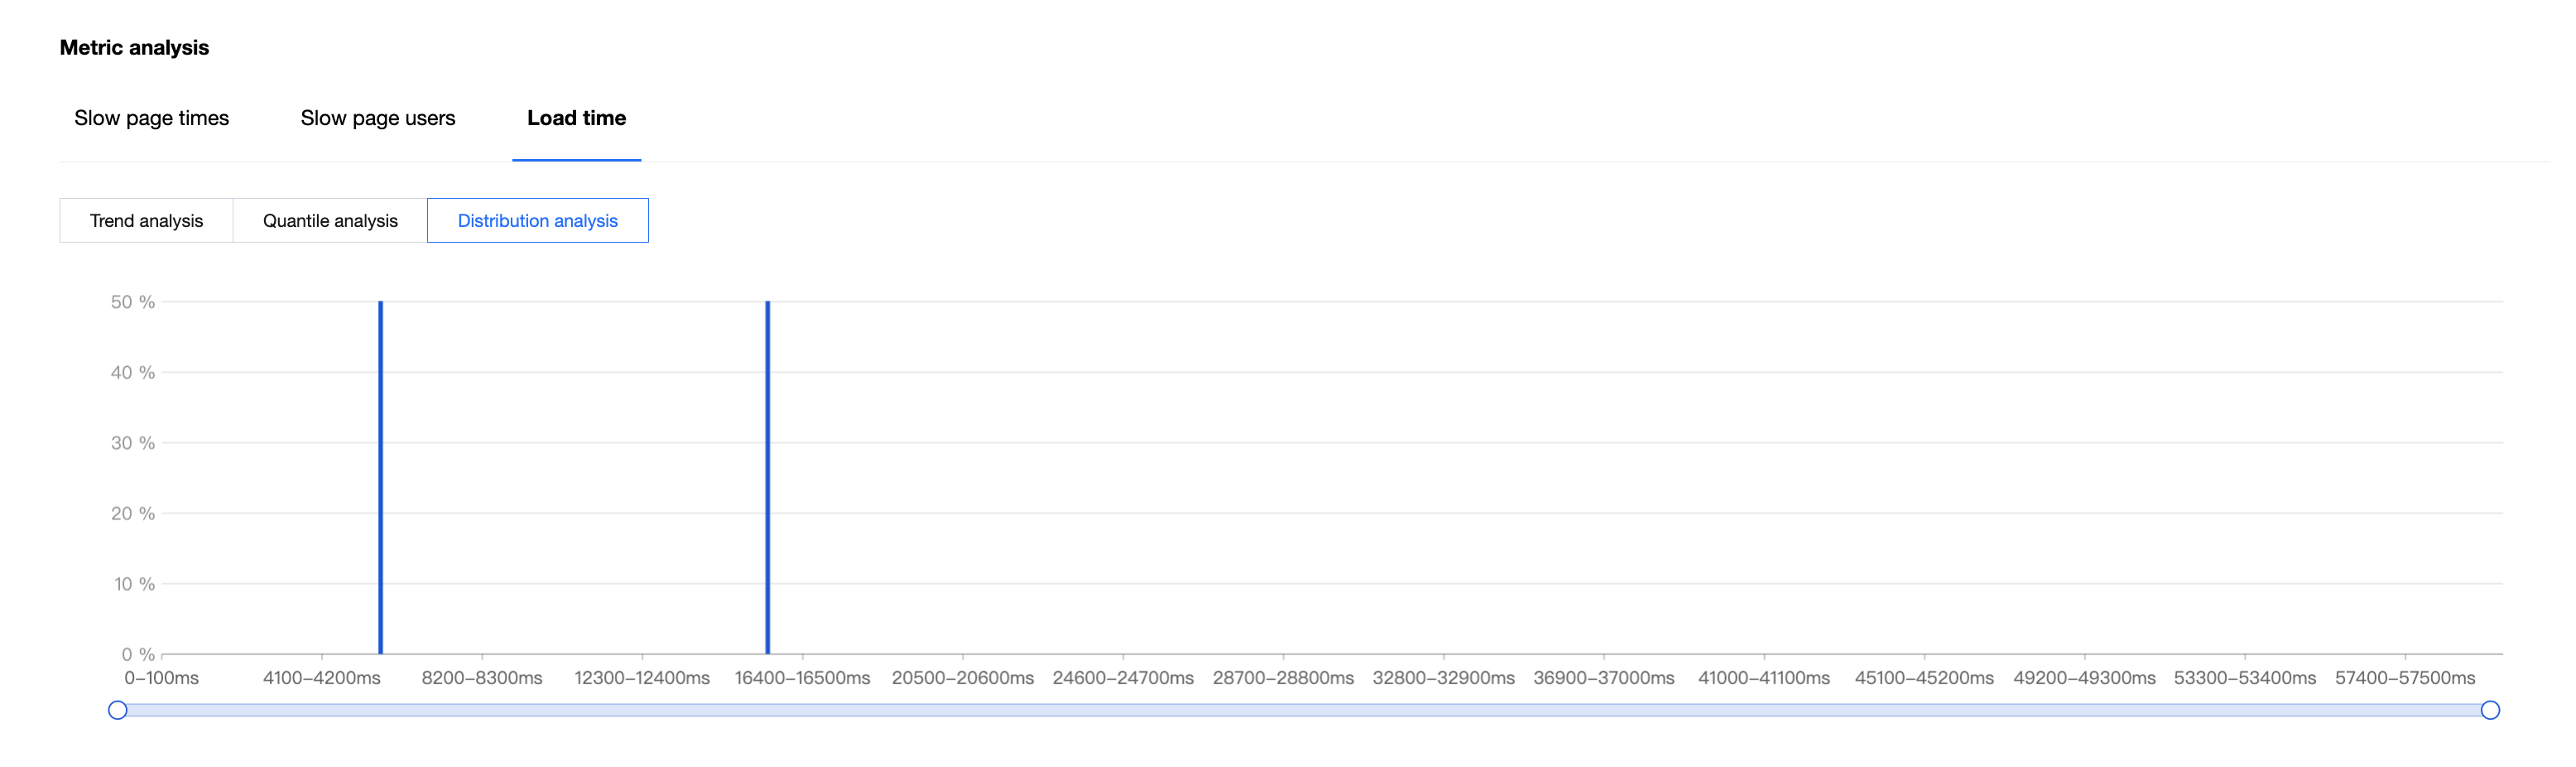
1.2.4 Distribution analysis
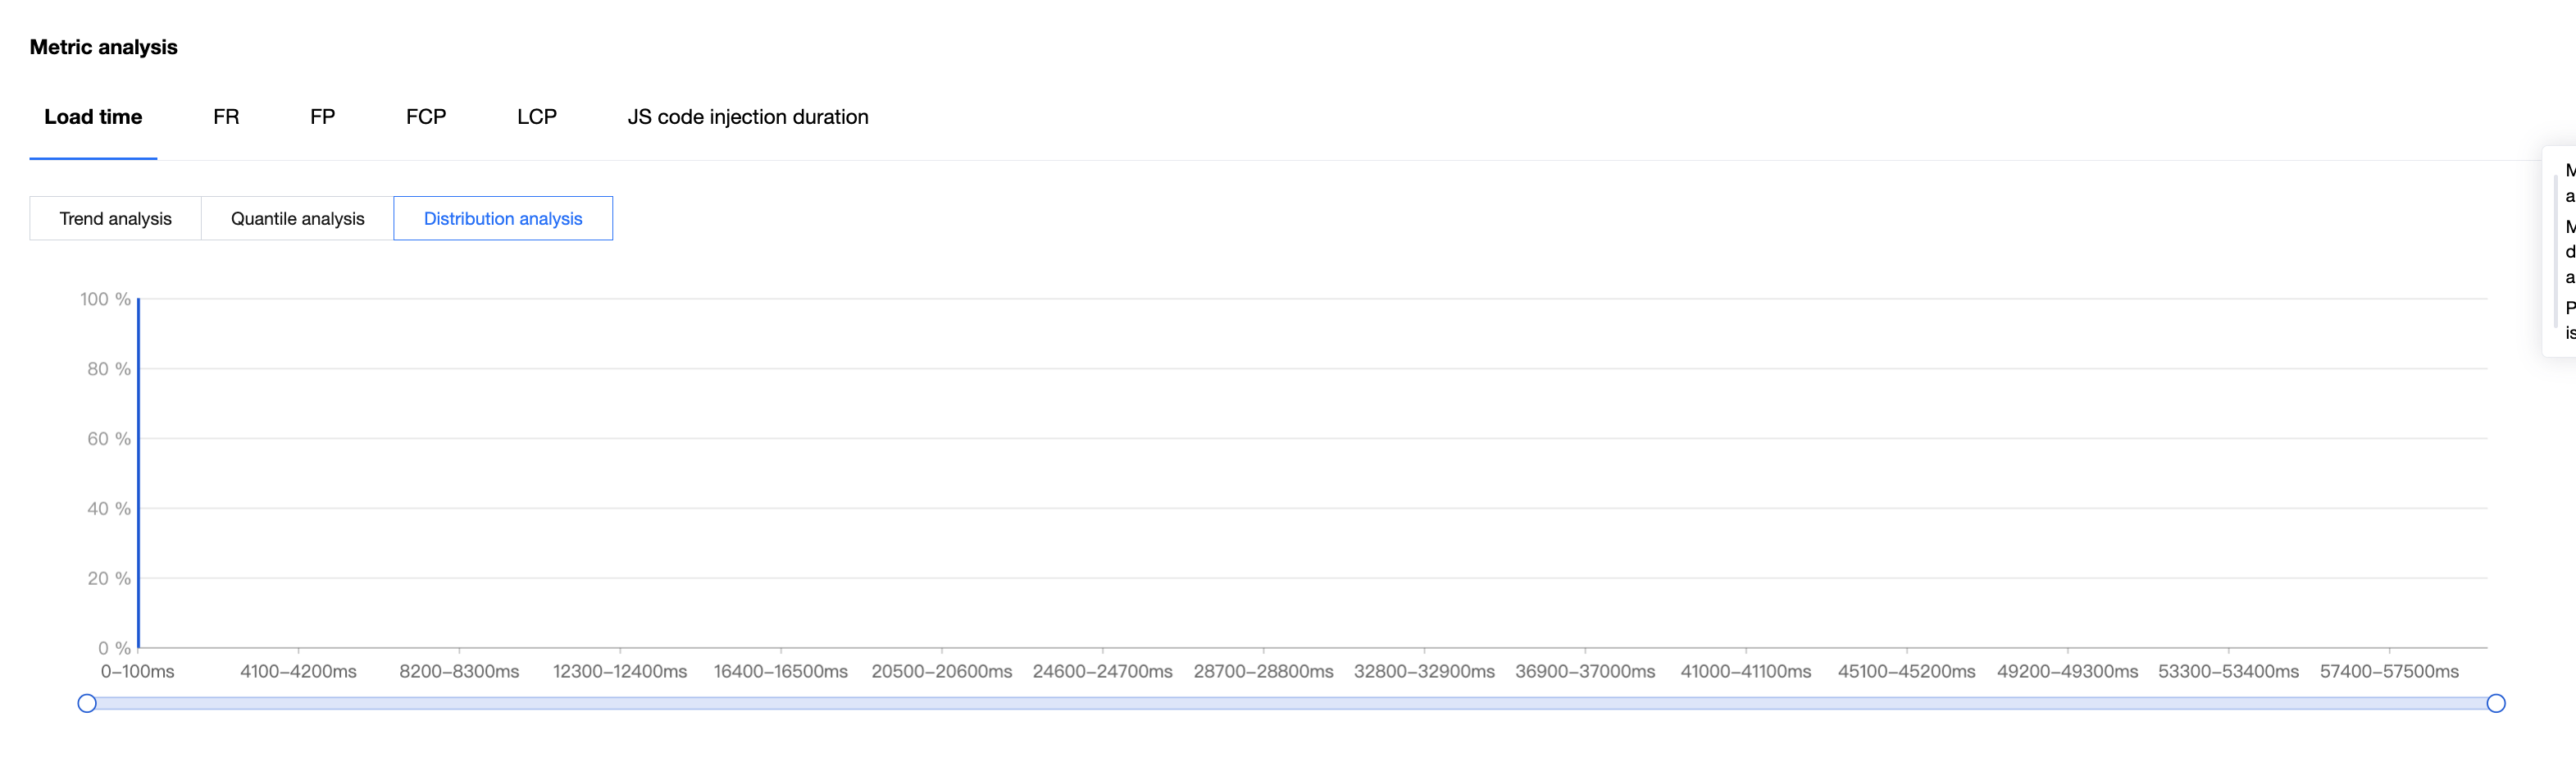
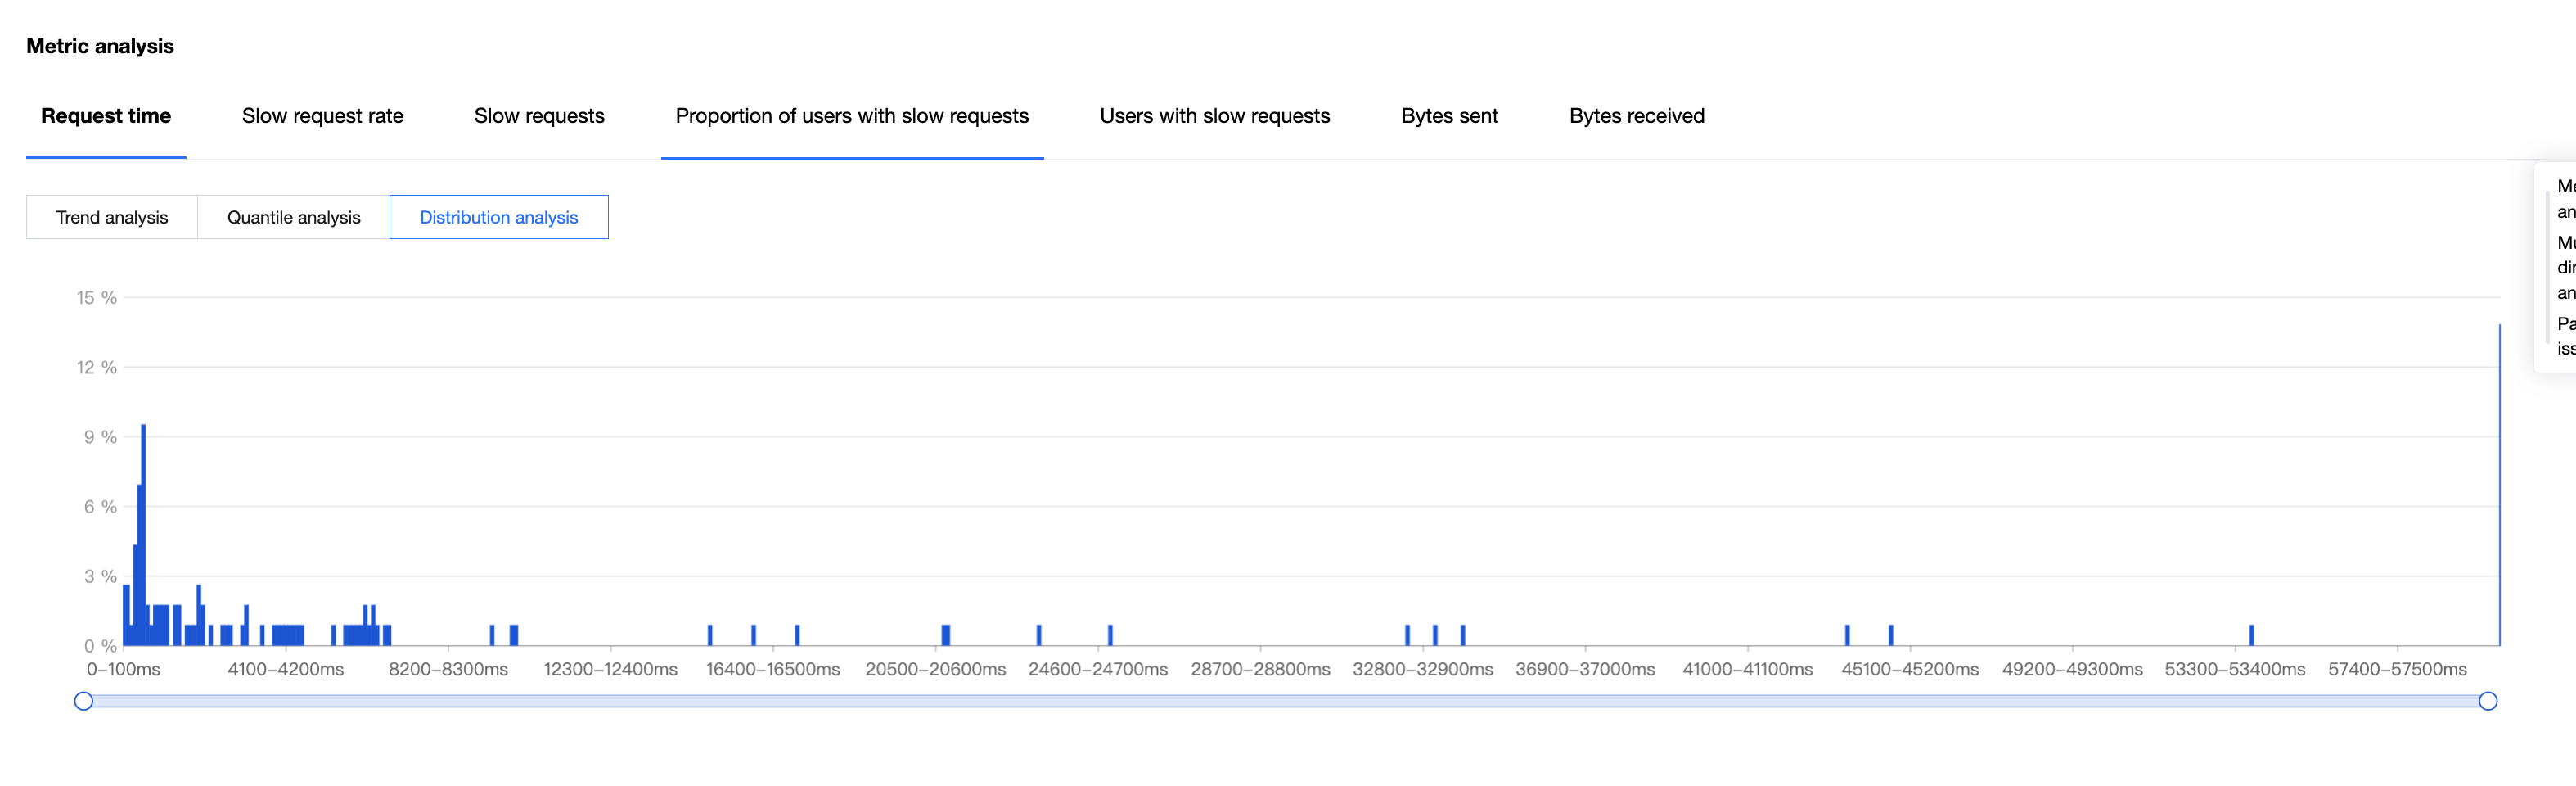
By default, the distribution analysis feature splits the sample data of the specified metric into equal ranges. It allows you to observe the distribution of sample data within a valid range, so that you can develop a performance optimization plan and prove the effectiveness by comparing the data before and after the optimization.
1.3 Key object analysis
The critical object analysis feature highlights critical dimensions strongly related to the specified performance domain. You can sort the dimensions by priority or set prioritized dimensions as filters.
For some objects containing hierarchical relationships, you can also view their next-level metric data through tree expansion.
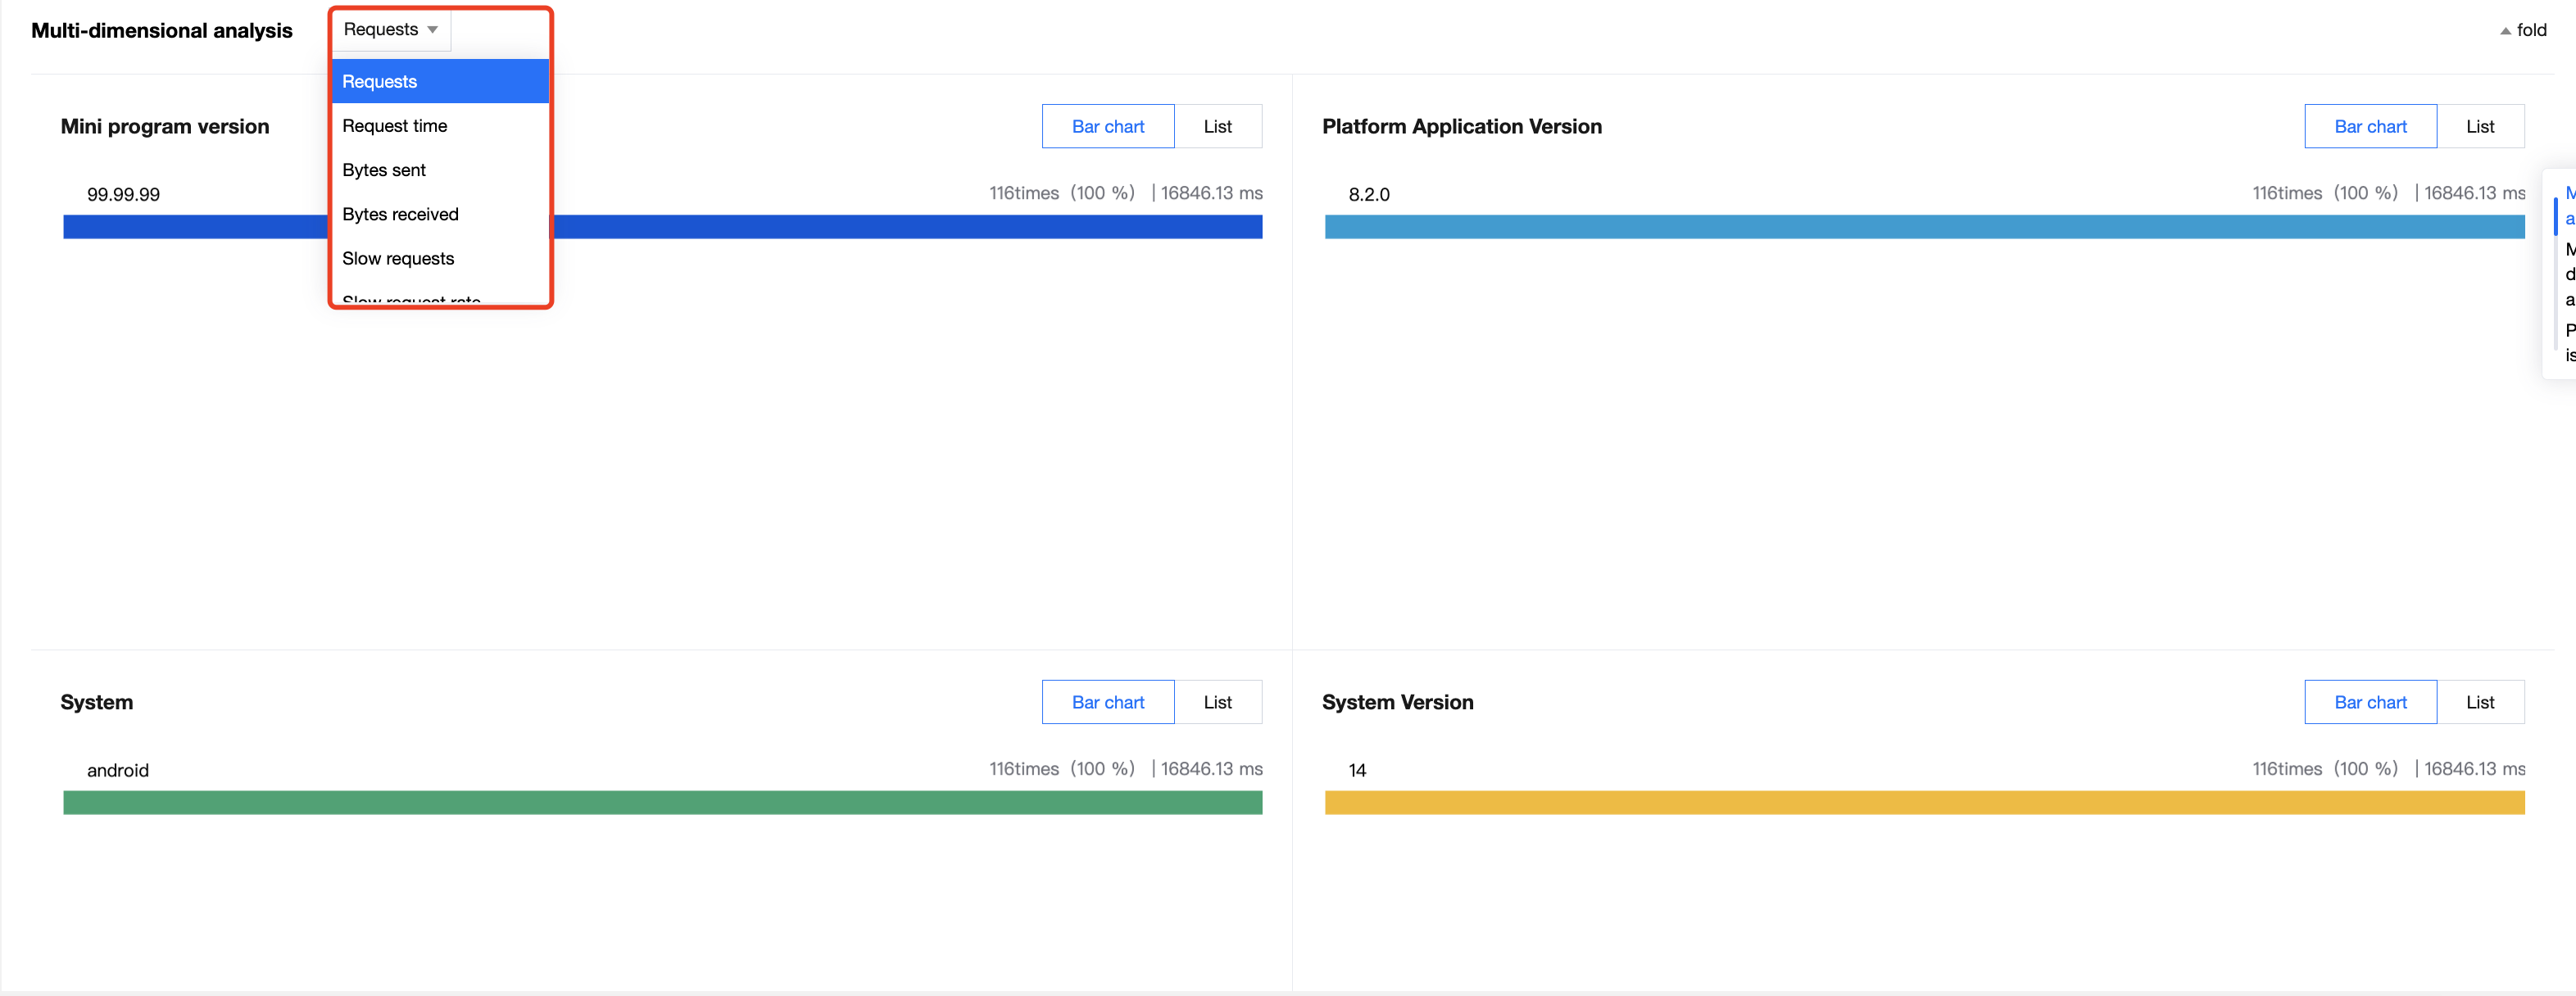
1.4 Multidimensional analysis
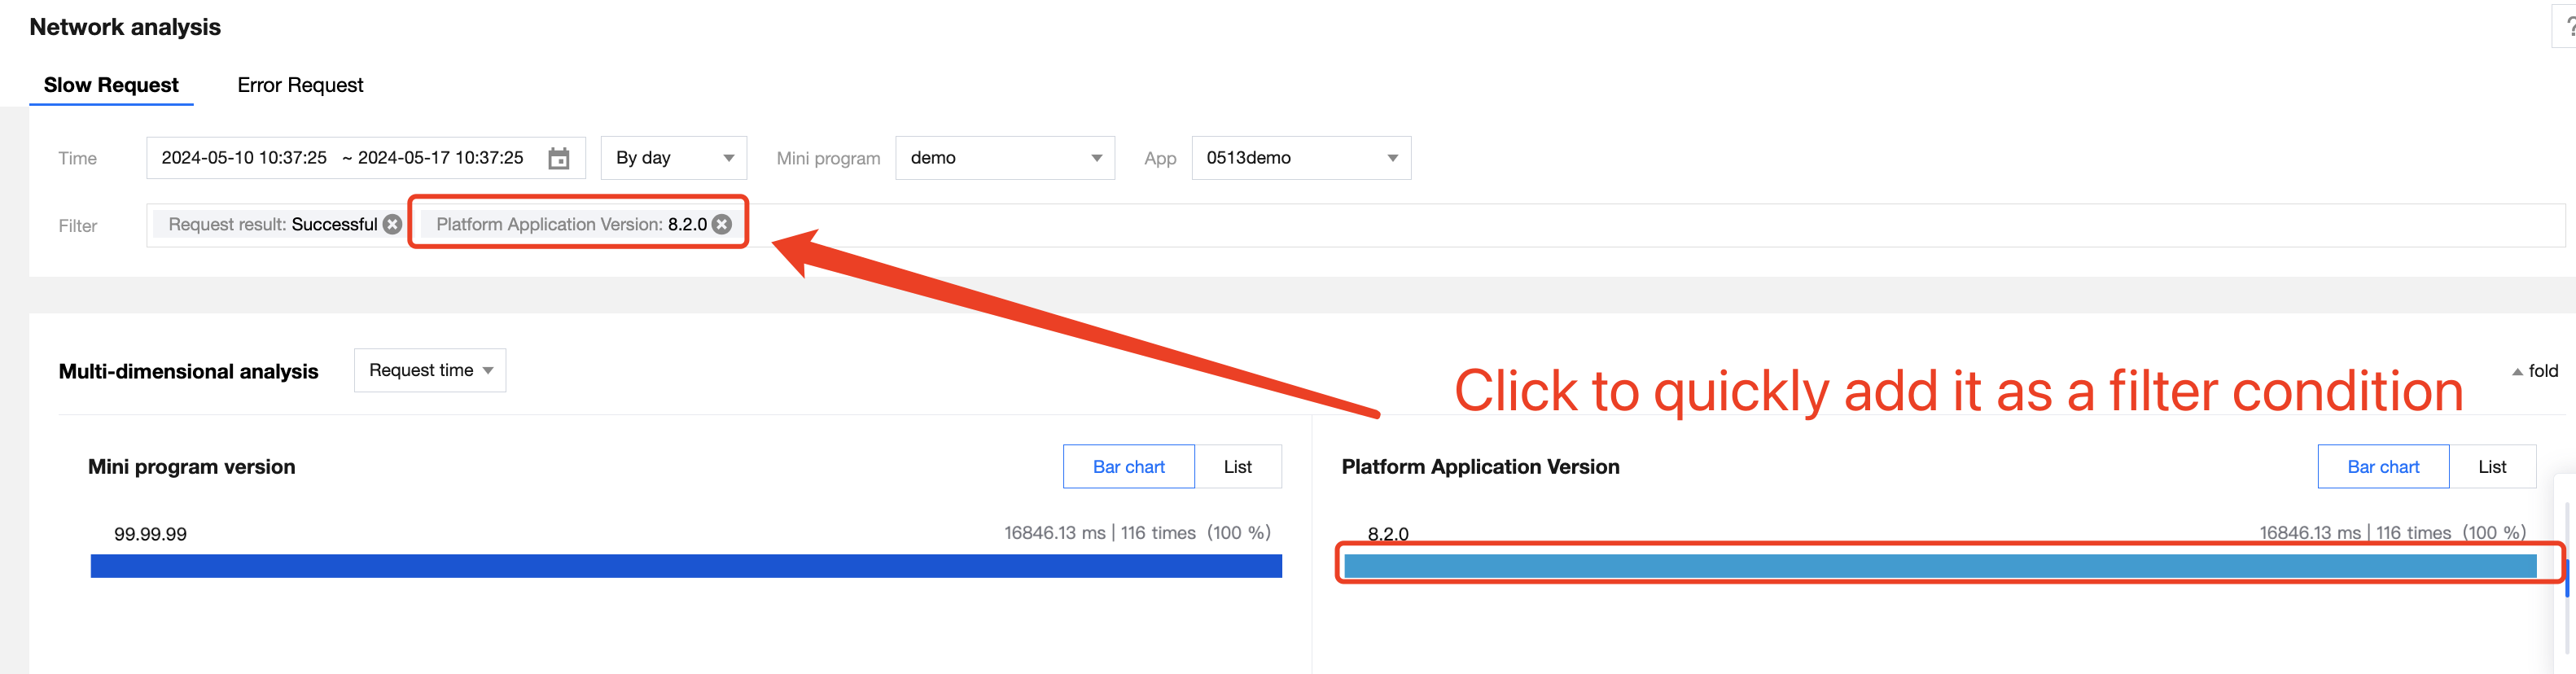
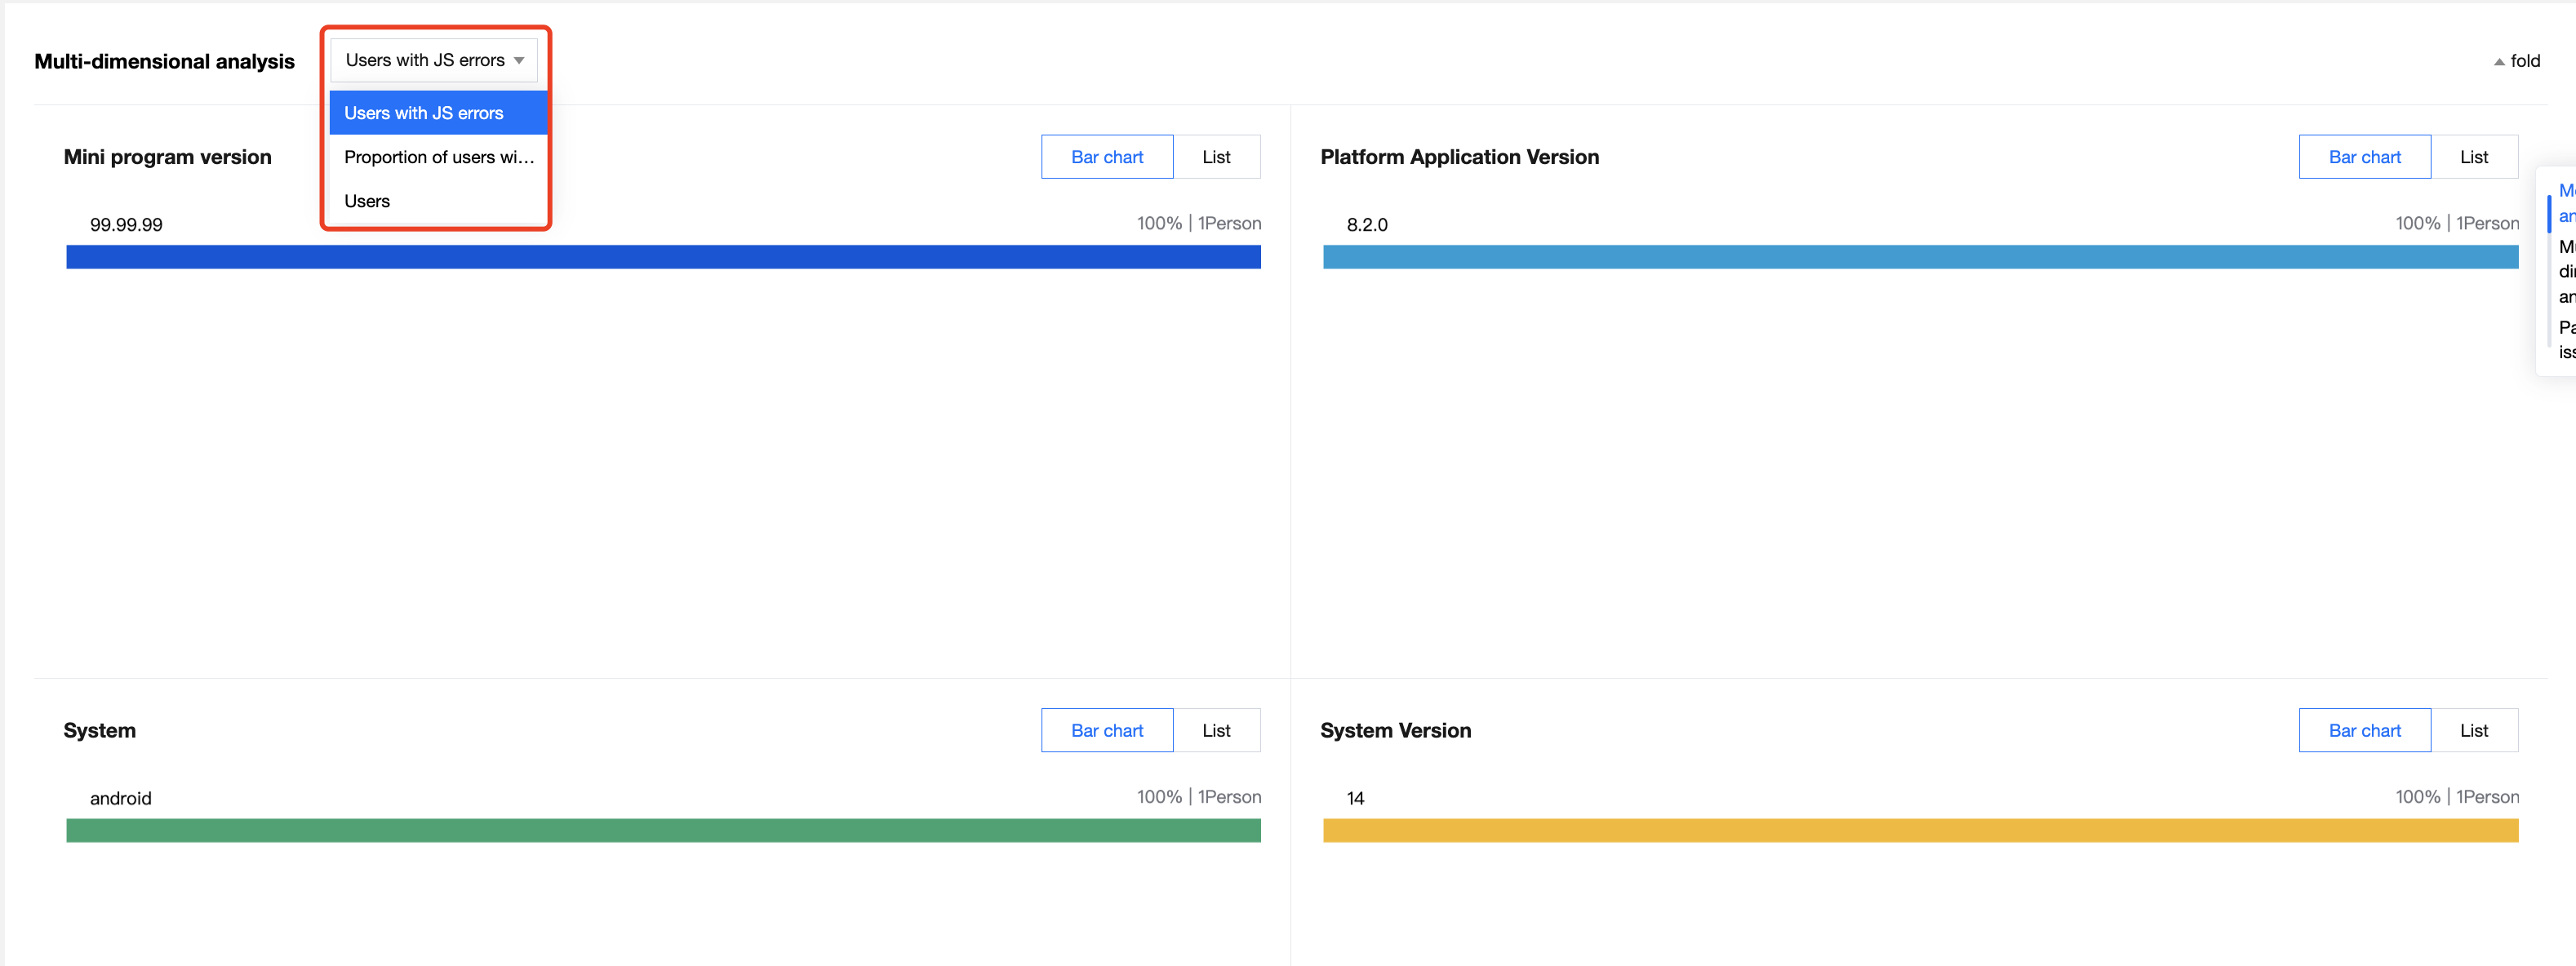
The multidimensional analysis feature displays the statistical distribution information of the specified metric in different dimensions, so that you can get a quick overview of the data distribution and metric comparison in the prioritized dimension.
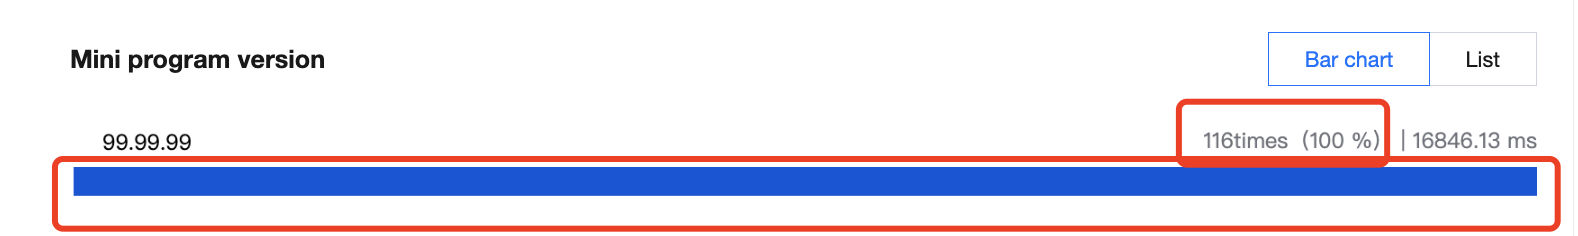
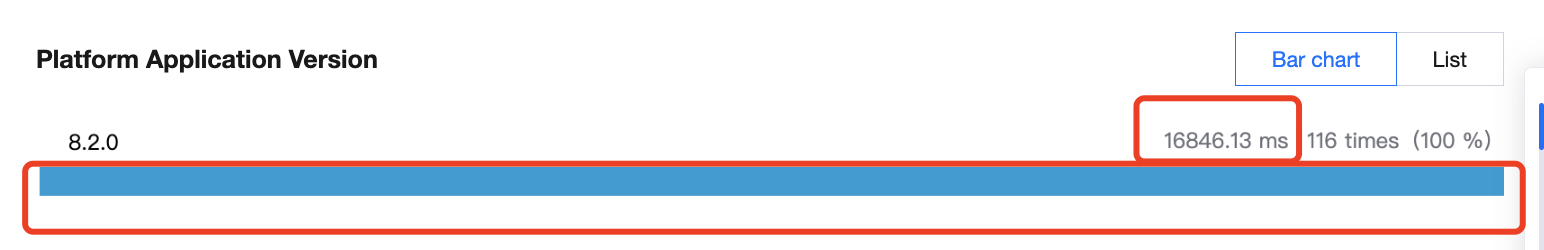
You can choose to display multidimensional analysis statistics in a bar chart or list, and you can quickly add specific objects of a given dimension as filters.
4.1 Bar chart
In bar chart mode, you can intuitively grasp the distribution of sample data or the comparison of performance metric data by rectangle length. The upper-right corner provides the statistic value, ratio, and performance metric information of specific sample data. The display sequence of information depends on the metric options you have selected.
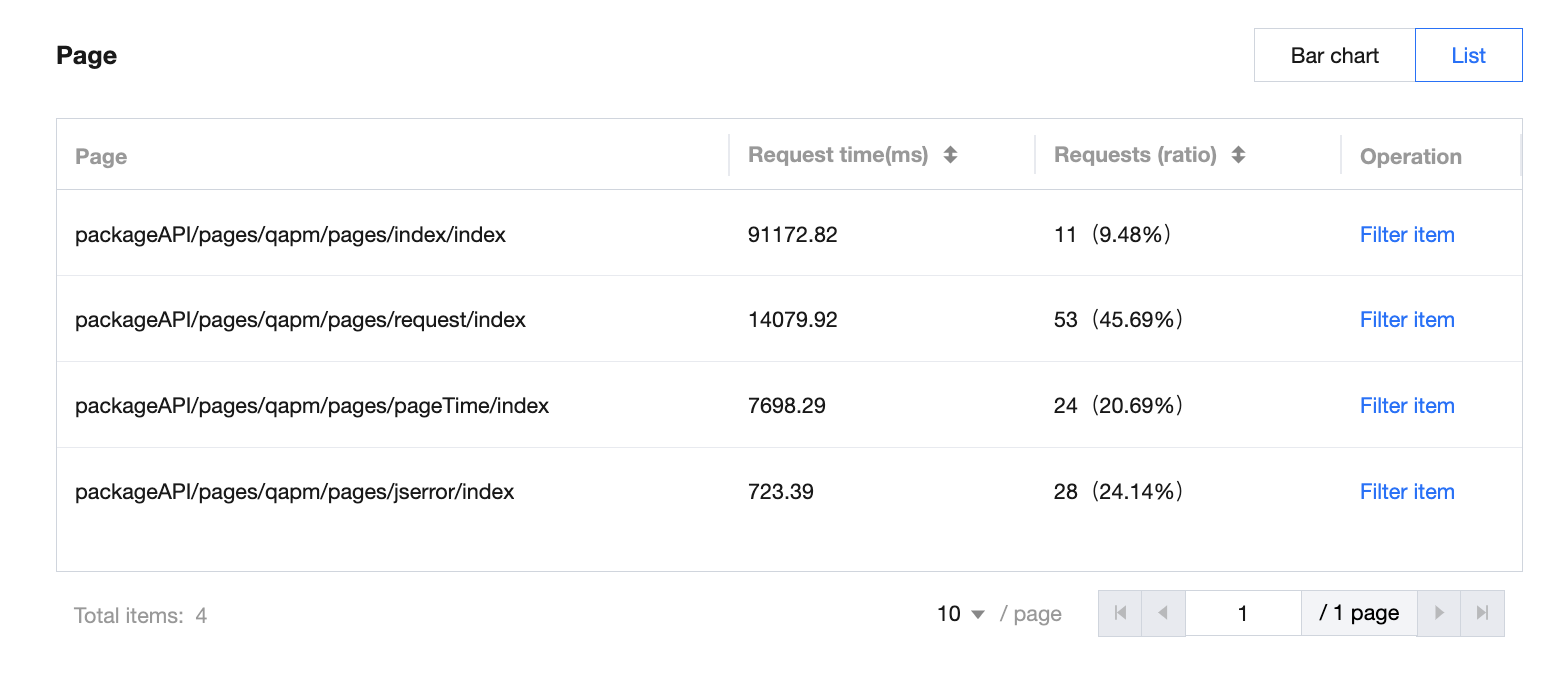
4.2 List
In list mode, the detailed information of the bar chart legends is displayed. You can click columns to sort data and quickly add dimension objects as filters.
1.5 Issue list
QAPM automatically analyzes and extracts key features of performance issues and aggregates similar issues into a class of issues. You can easily manage performance issues in the form of a list, including but not limited to issue screening, issue sorting, issue impact analysis, and issue status management.
5.1 Issue list filtering
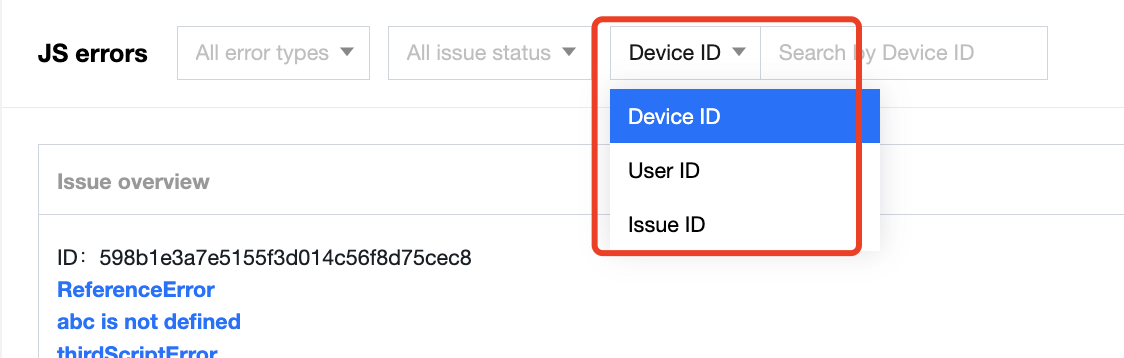
Besides the global filter, you can also filter issues in the list in any of the following ways:
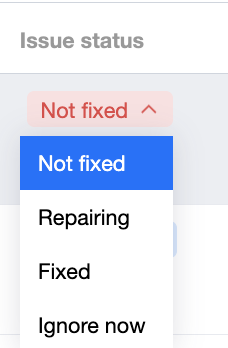
Issue status filtering: You can filter issues based on the current issue status. By default, the system provides four states (Not fixed, Fixing, Fixed, and Ignore for now) to help you manage the current issue processing status.
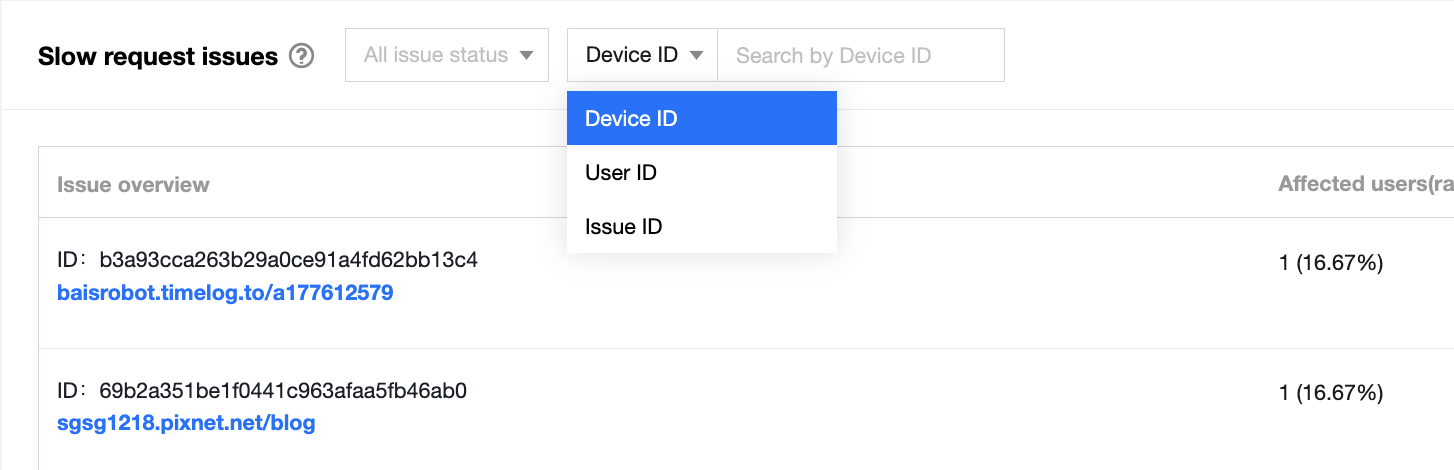
Filter by ID: You can filter issues by device ID, user ID, or issue ID as needed. You can focus on analyzing the issues of a specific user/device, or you can search for a specific issue to analyze the trend and recurrence of the issue.
5.2 Issue status transition
The issue list provides issues in four statuses: Not fixed, Fixed, Fixing, and Ignored. You can change the status to better manage an issue.
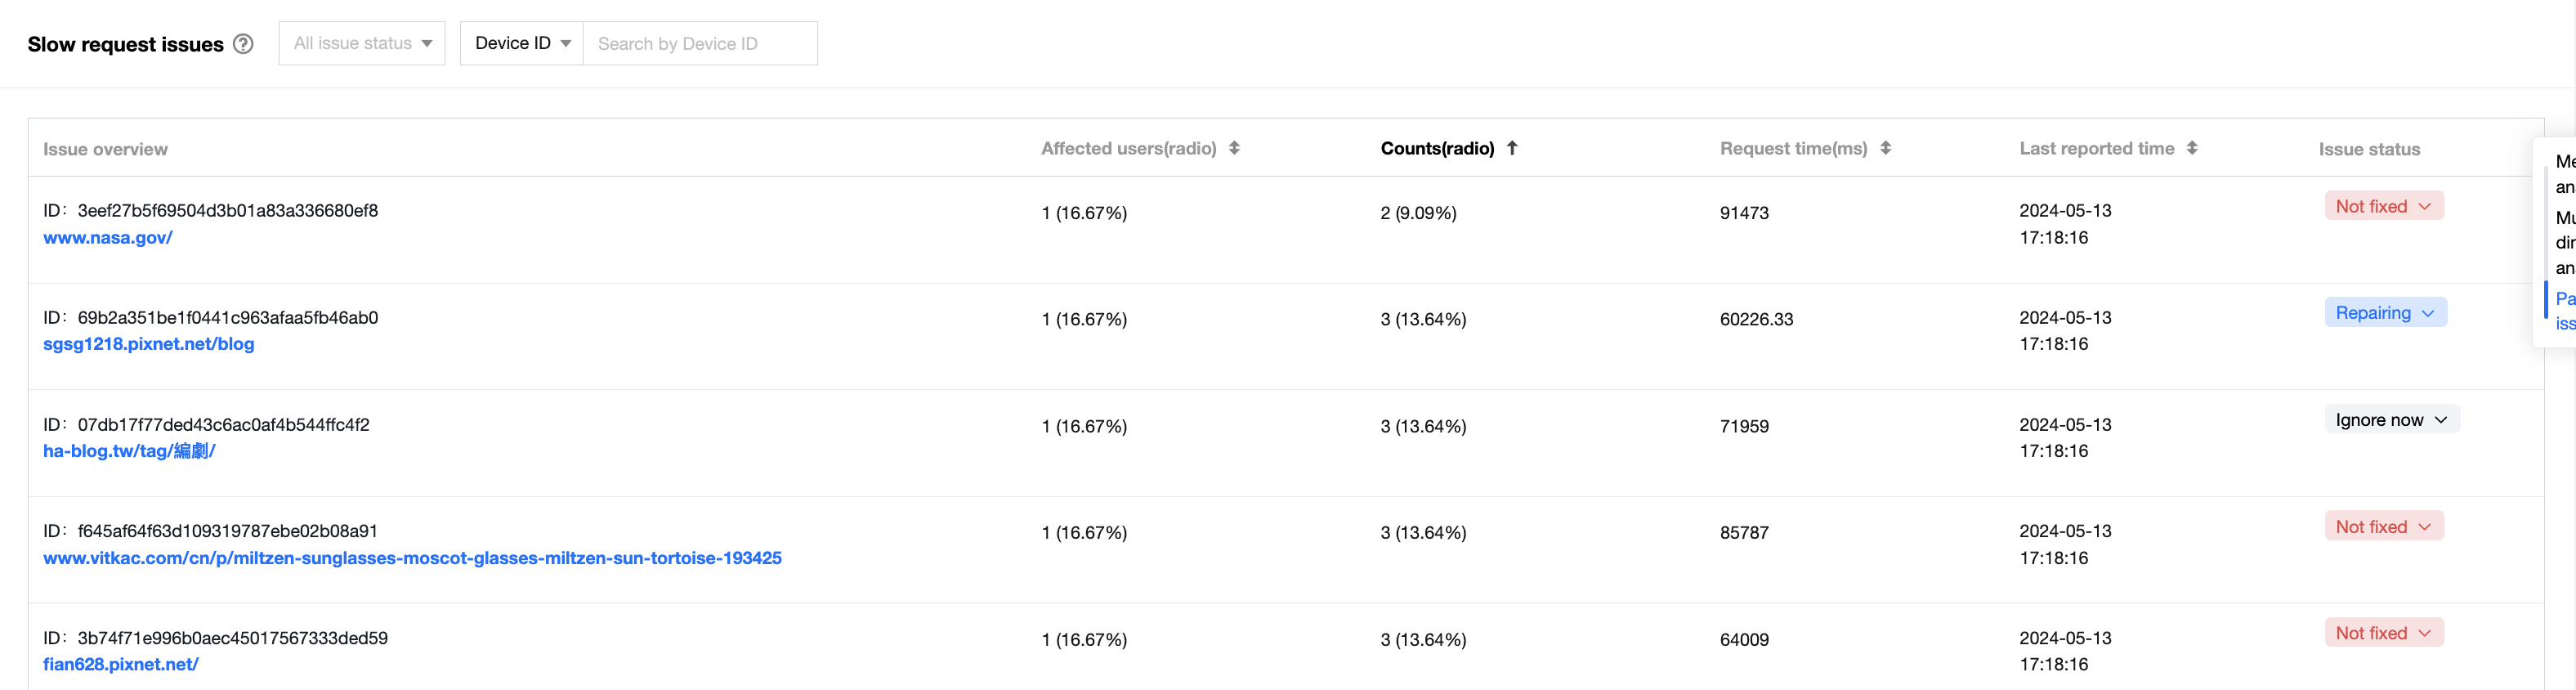
5.3 Issue list sorting
You can select the metrics of concern in the issue list to sort out the top issues with the largest affected scope or top seriousness.
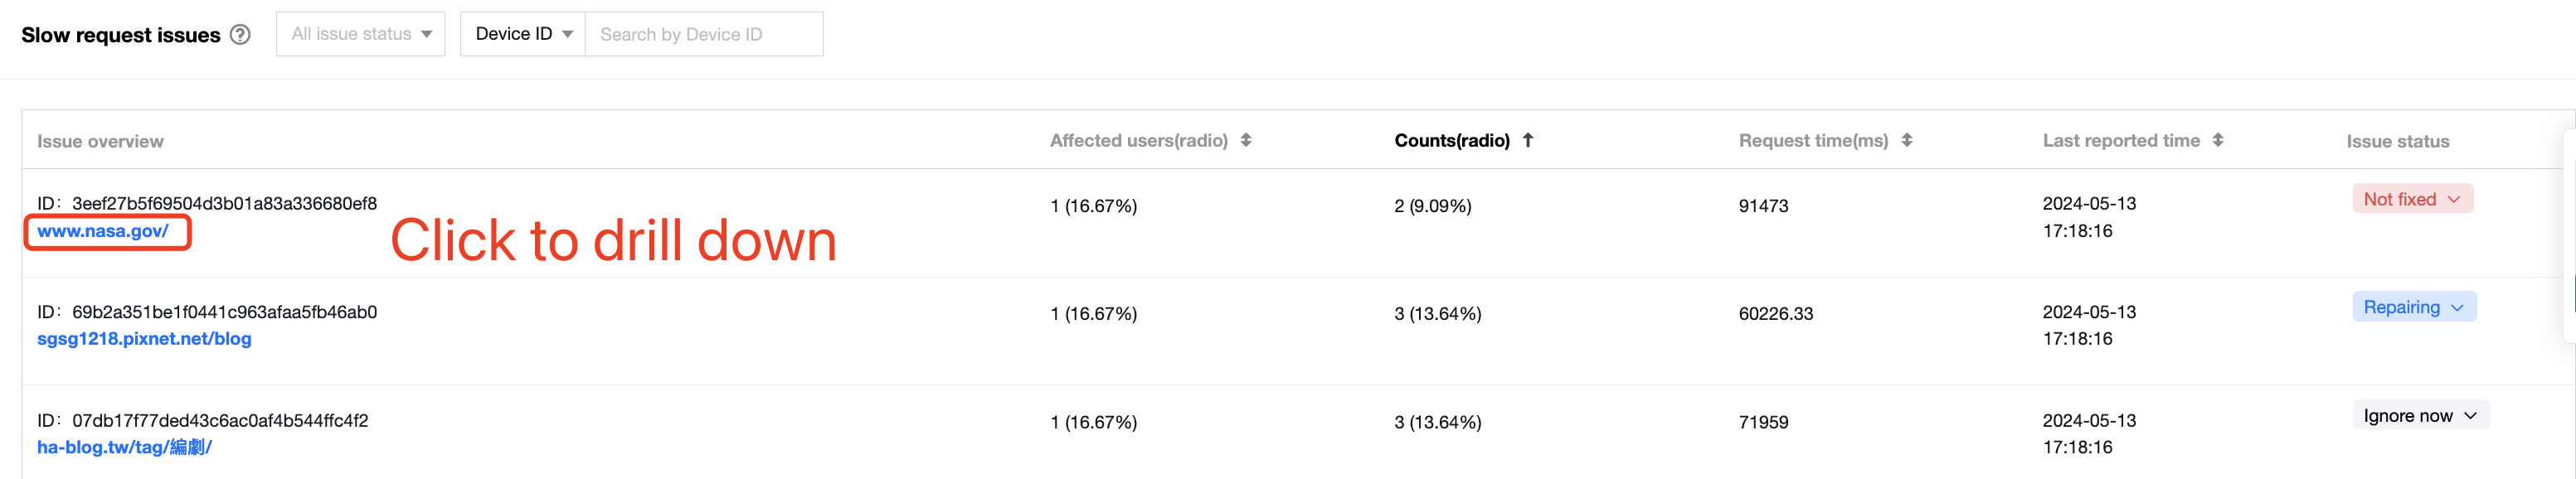
5.4 Issue list drill-down
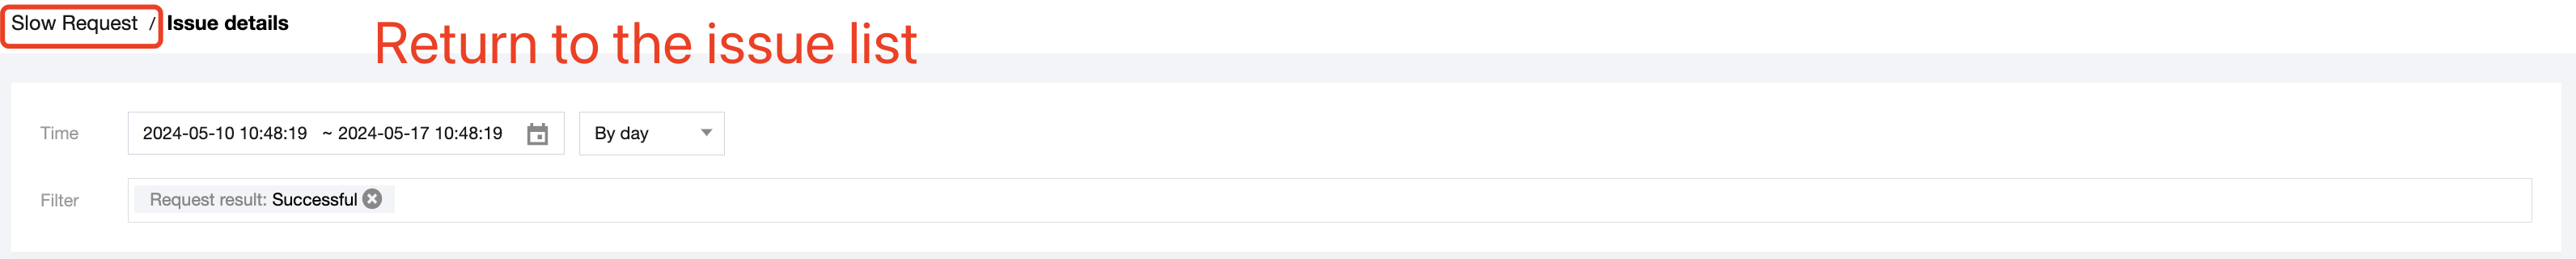
You can locate an issue in the issue list and click the issue characteristic information in blue to drill down to the issue details page. You can also use the breadcrumb feature in the upper-left corner of the issue details page to return to the last browsing position of the issue list and save the read status.
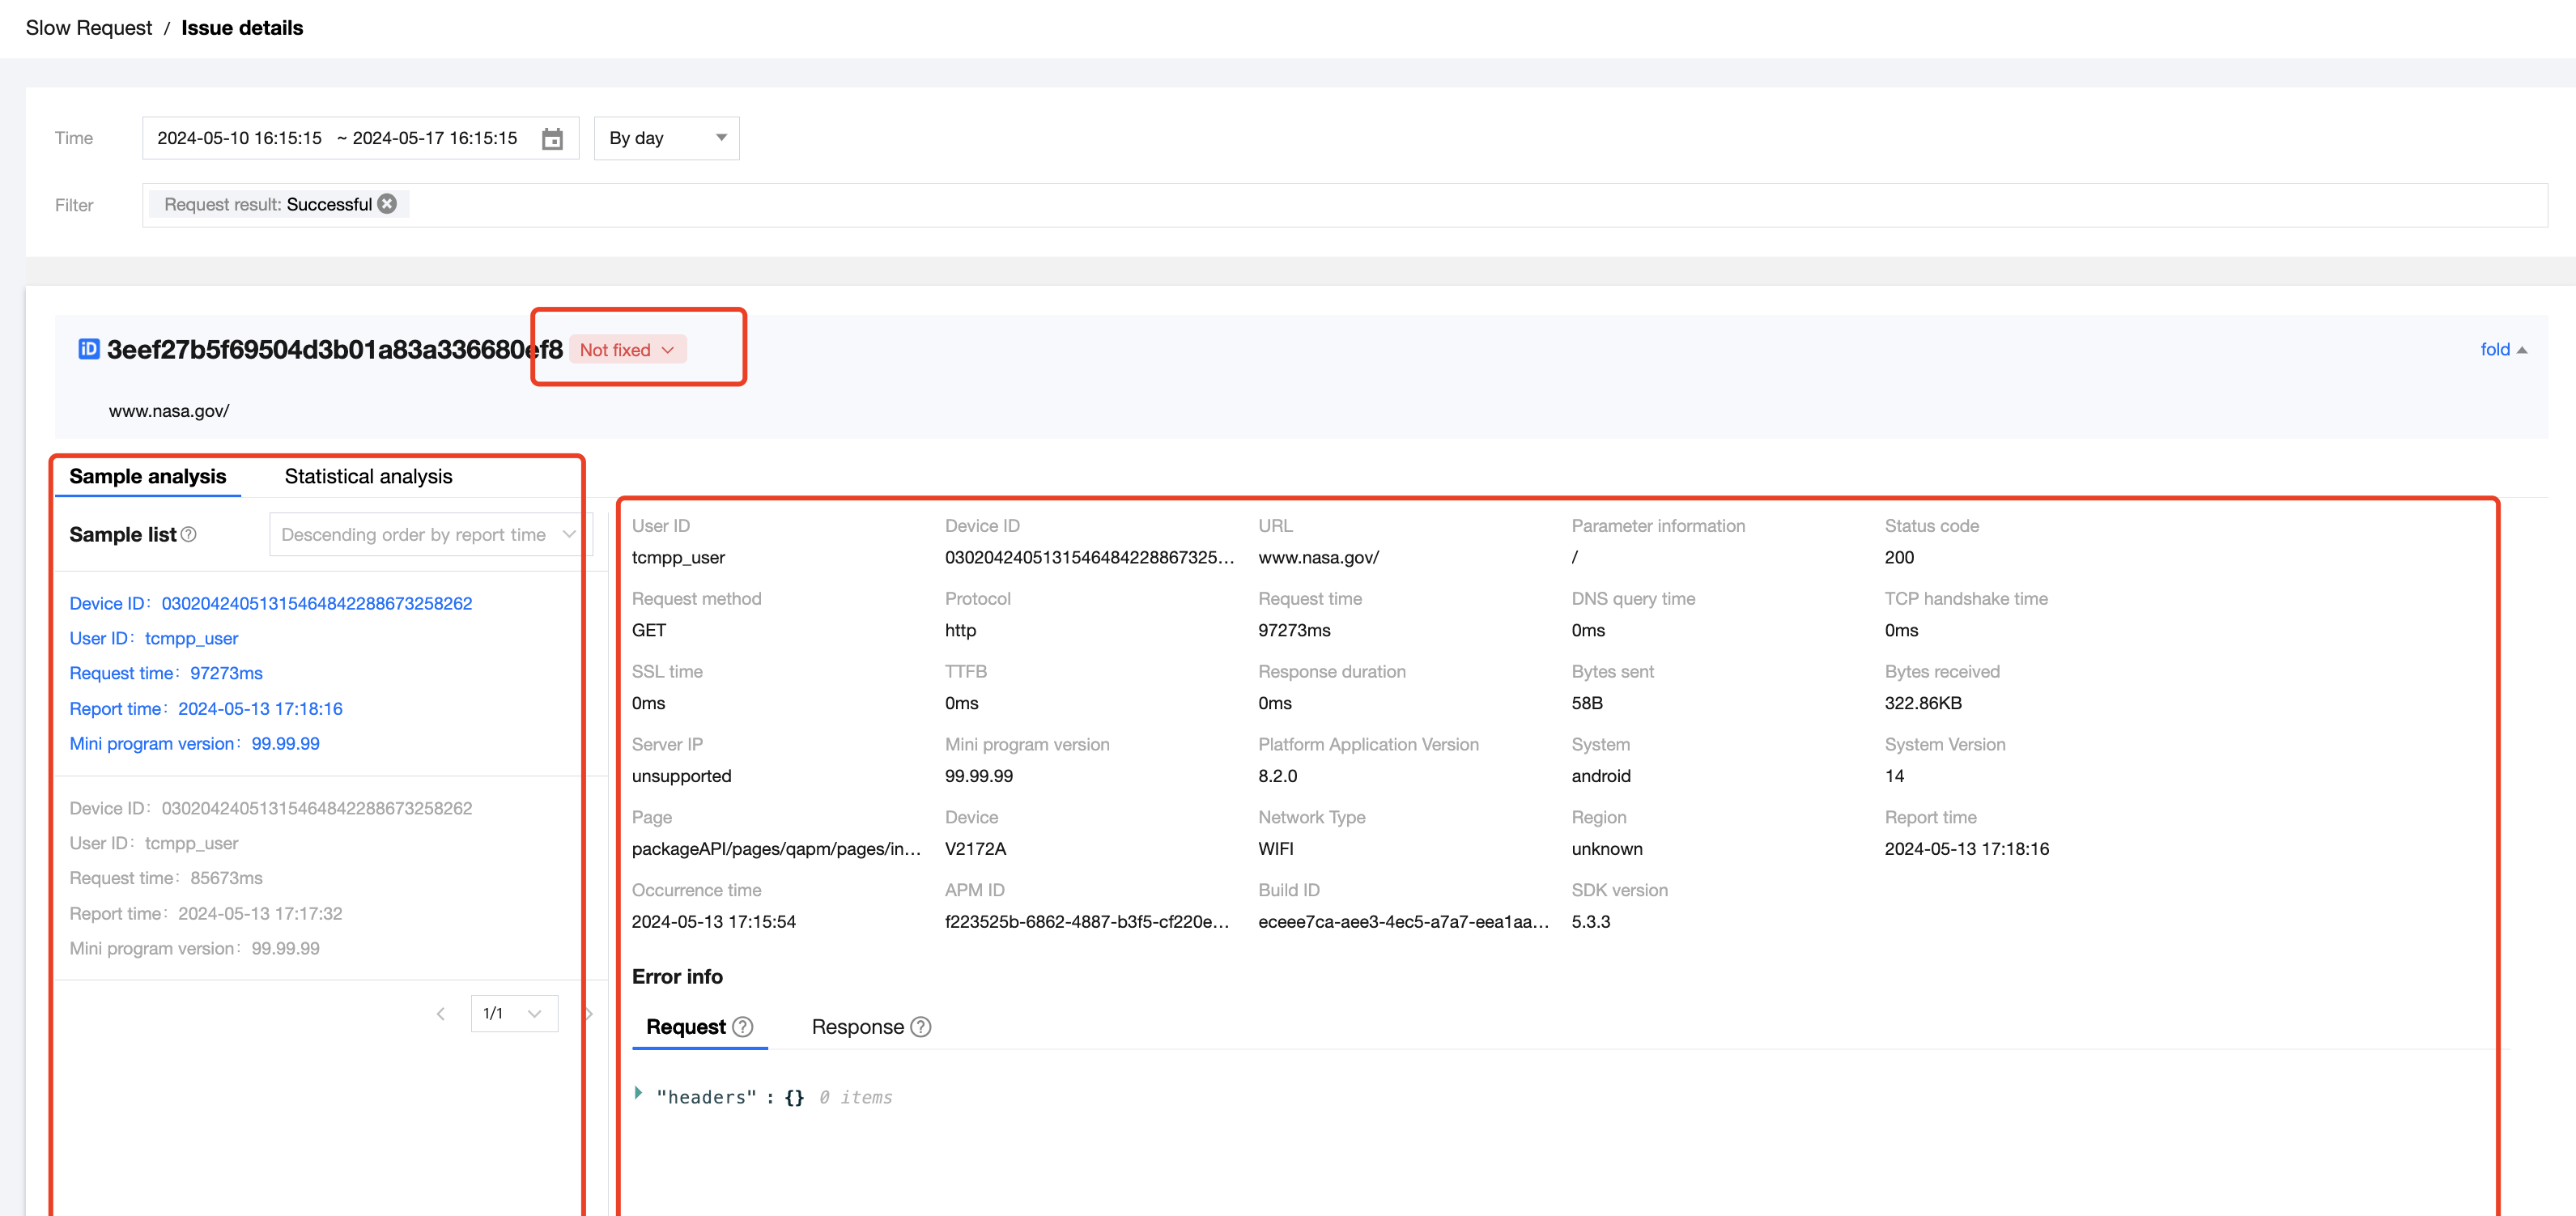
1.6 Issue details
The issue details module presents sample information of the specified issue in the form of list and card, including but not limited to sample list, context information, stack information, and log information. You can analyze and locate the specified issue in the issue details to address the issue. Among the issue details, the error information can be used for different purposes in the performance issue types, which will be elaborated in subsequent sections. In addition, you can view the trend change of the issue and trend change of top dimensions, and locate the issue's important time nodes such as the issue occurrence time and surge time.
6.1 Sample filtering
You can filter the reported samples of the specified issue on the issue details page as needed to focus on those of priority.
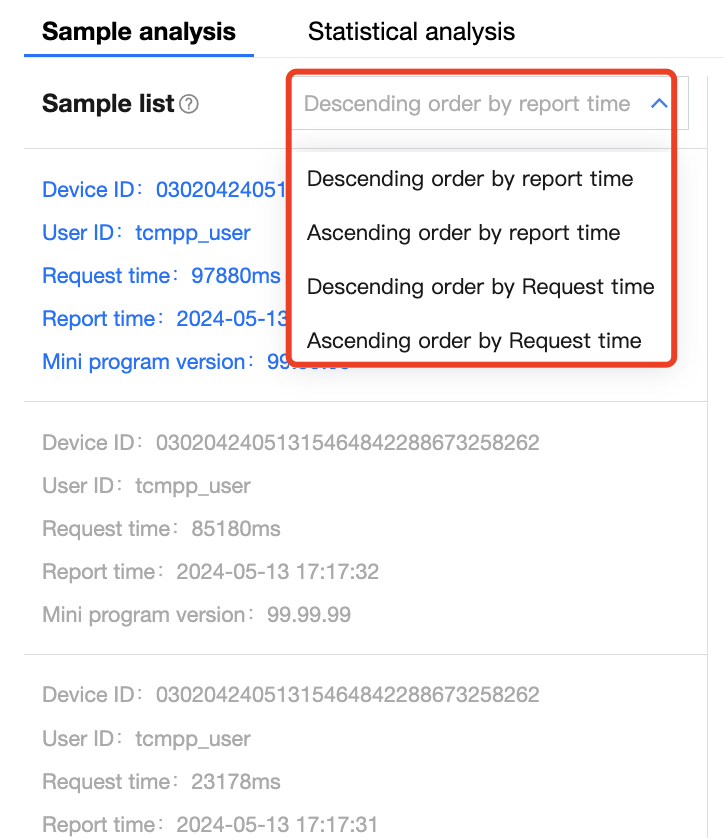
6.2 Sample list
The sample list allows you to change the sorting order so that you can use the sorting and switching features to focus on specific issue samples as needed.
6.3 Context information
Context information aims to help you grasp the environmental information of an issue, better understand the objective external factors when the issue occurs, and assist you to analyze and locate the issue.
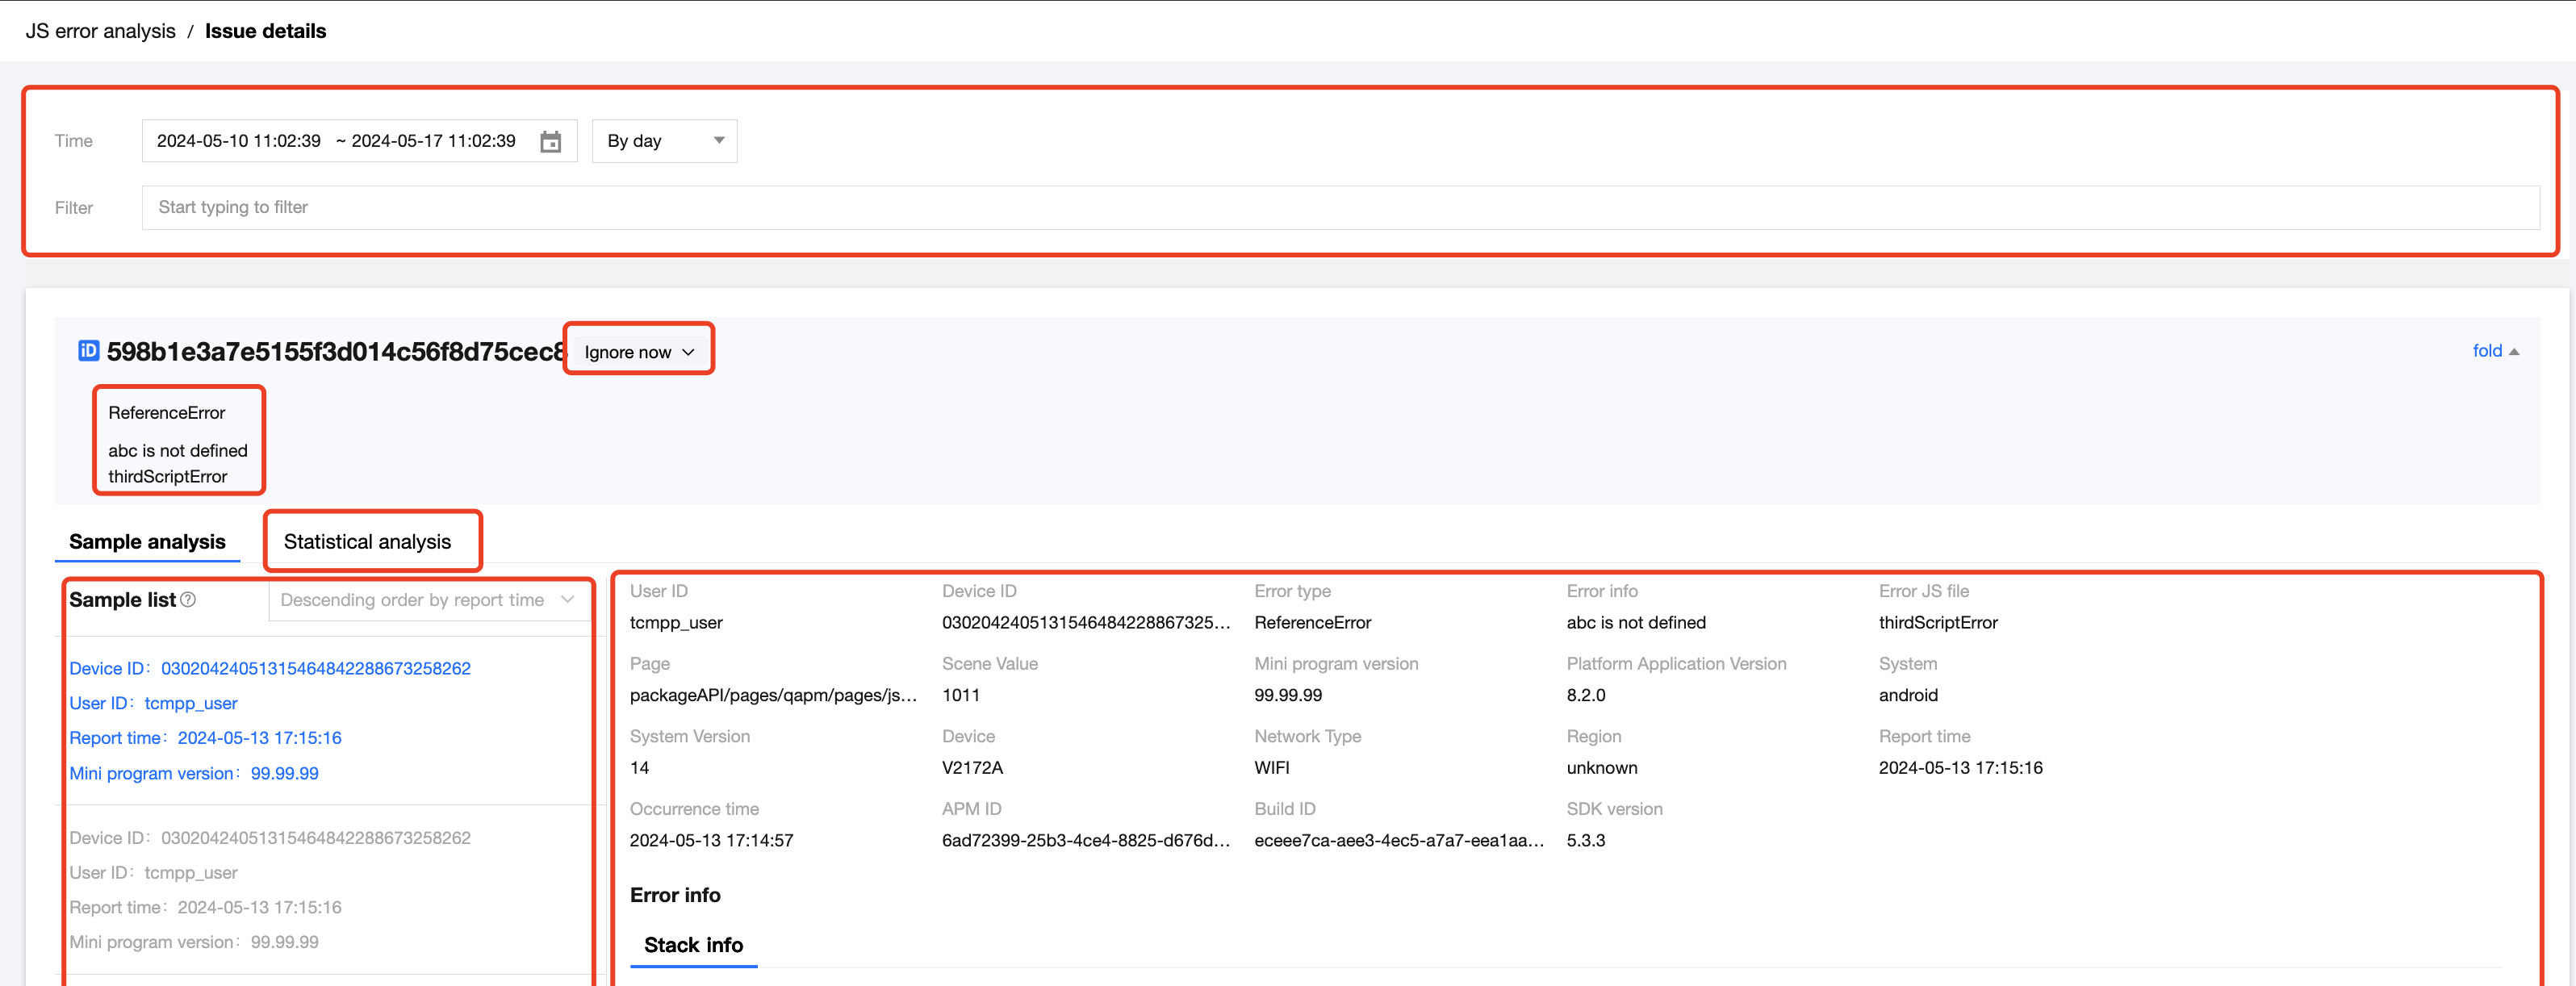
6.4 Error information
Error information provides the first on-site information related to the occurrence of an issue, which helps you understand the causes and consequences of the issue and locate and resolve the issue. The capabilities provided by error information vary in different performance issue types.
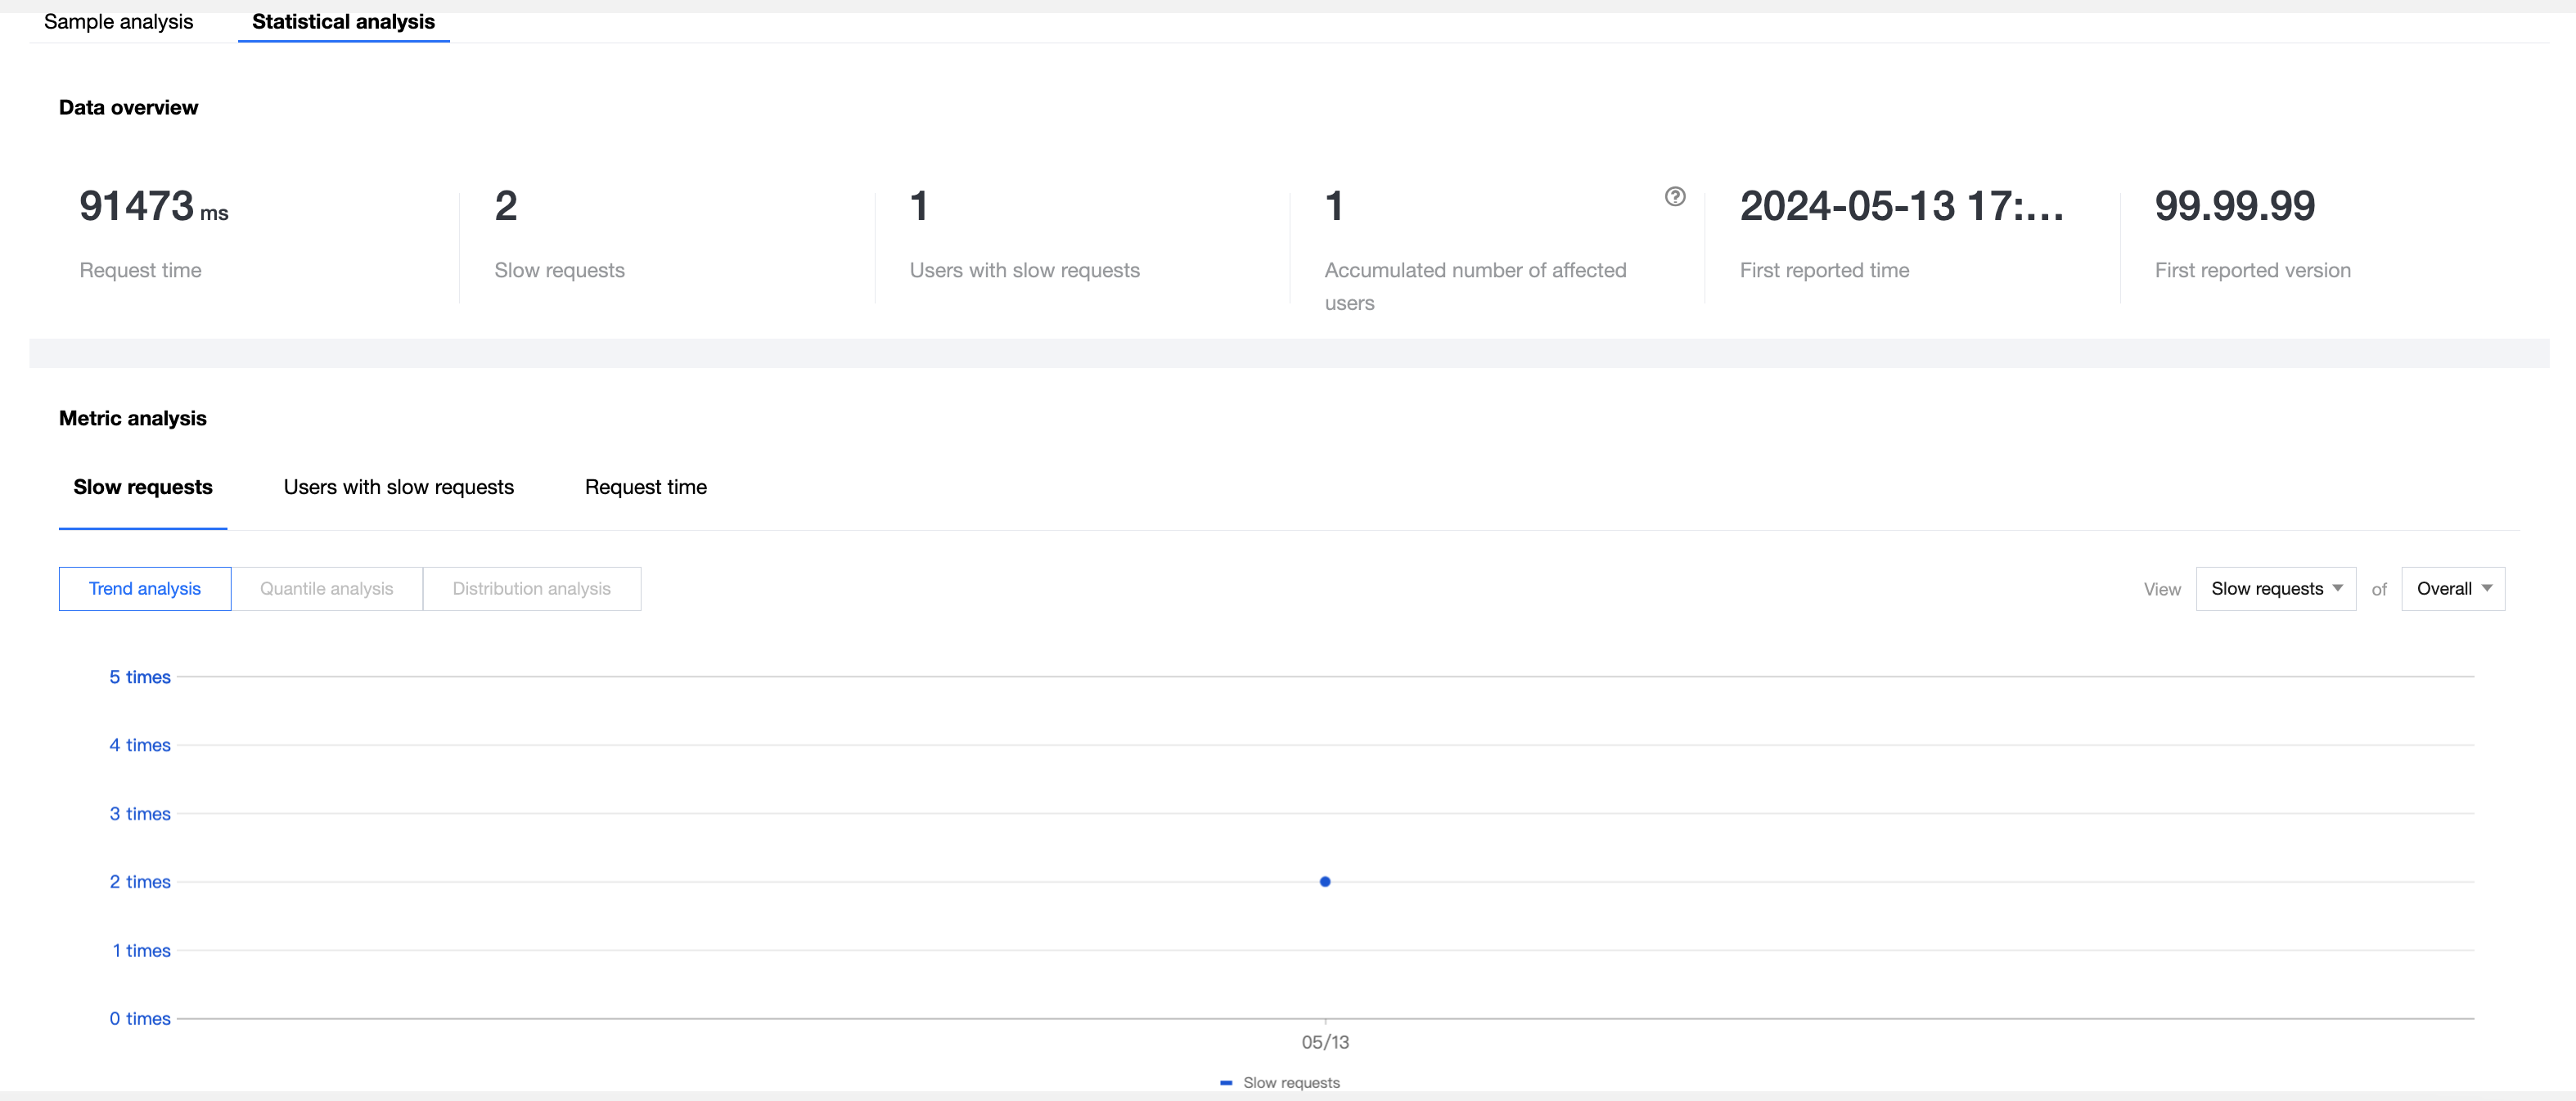
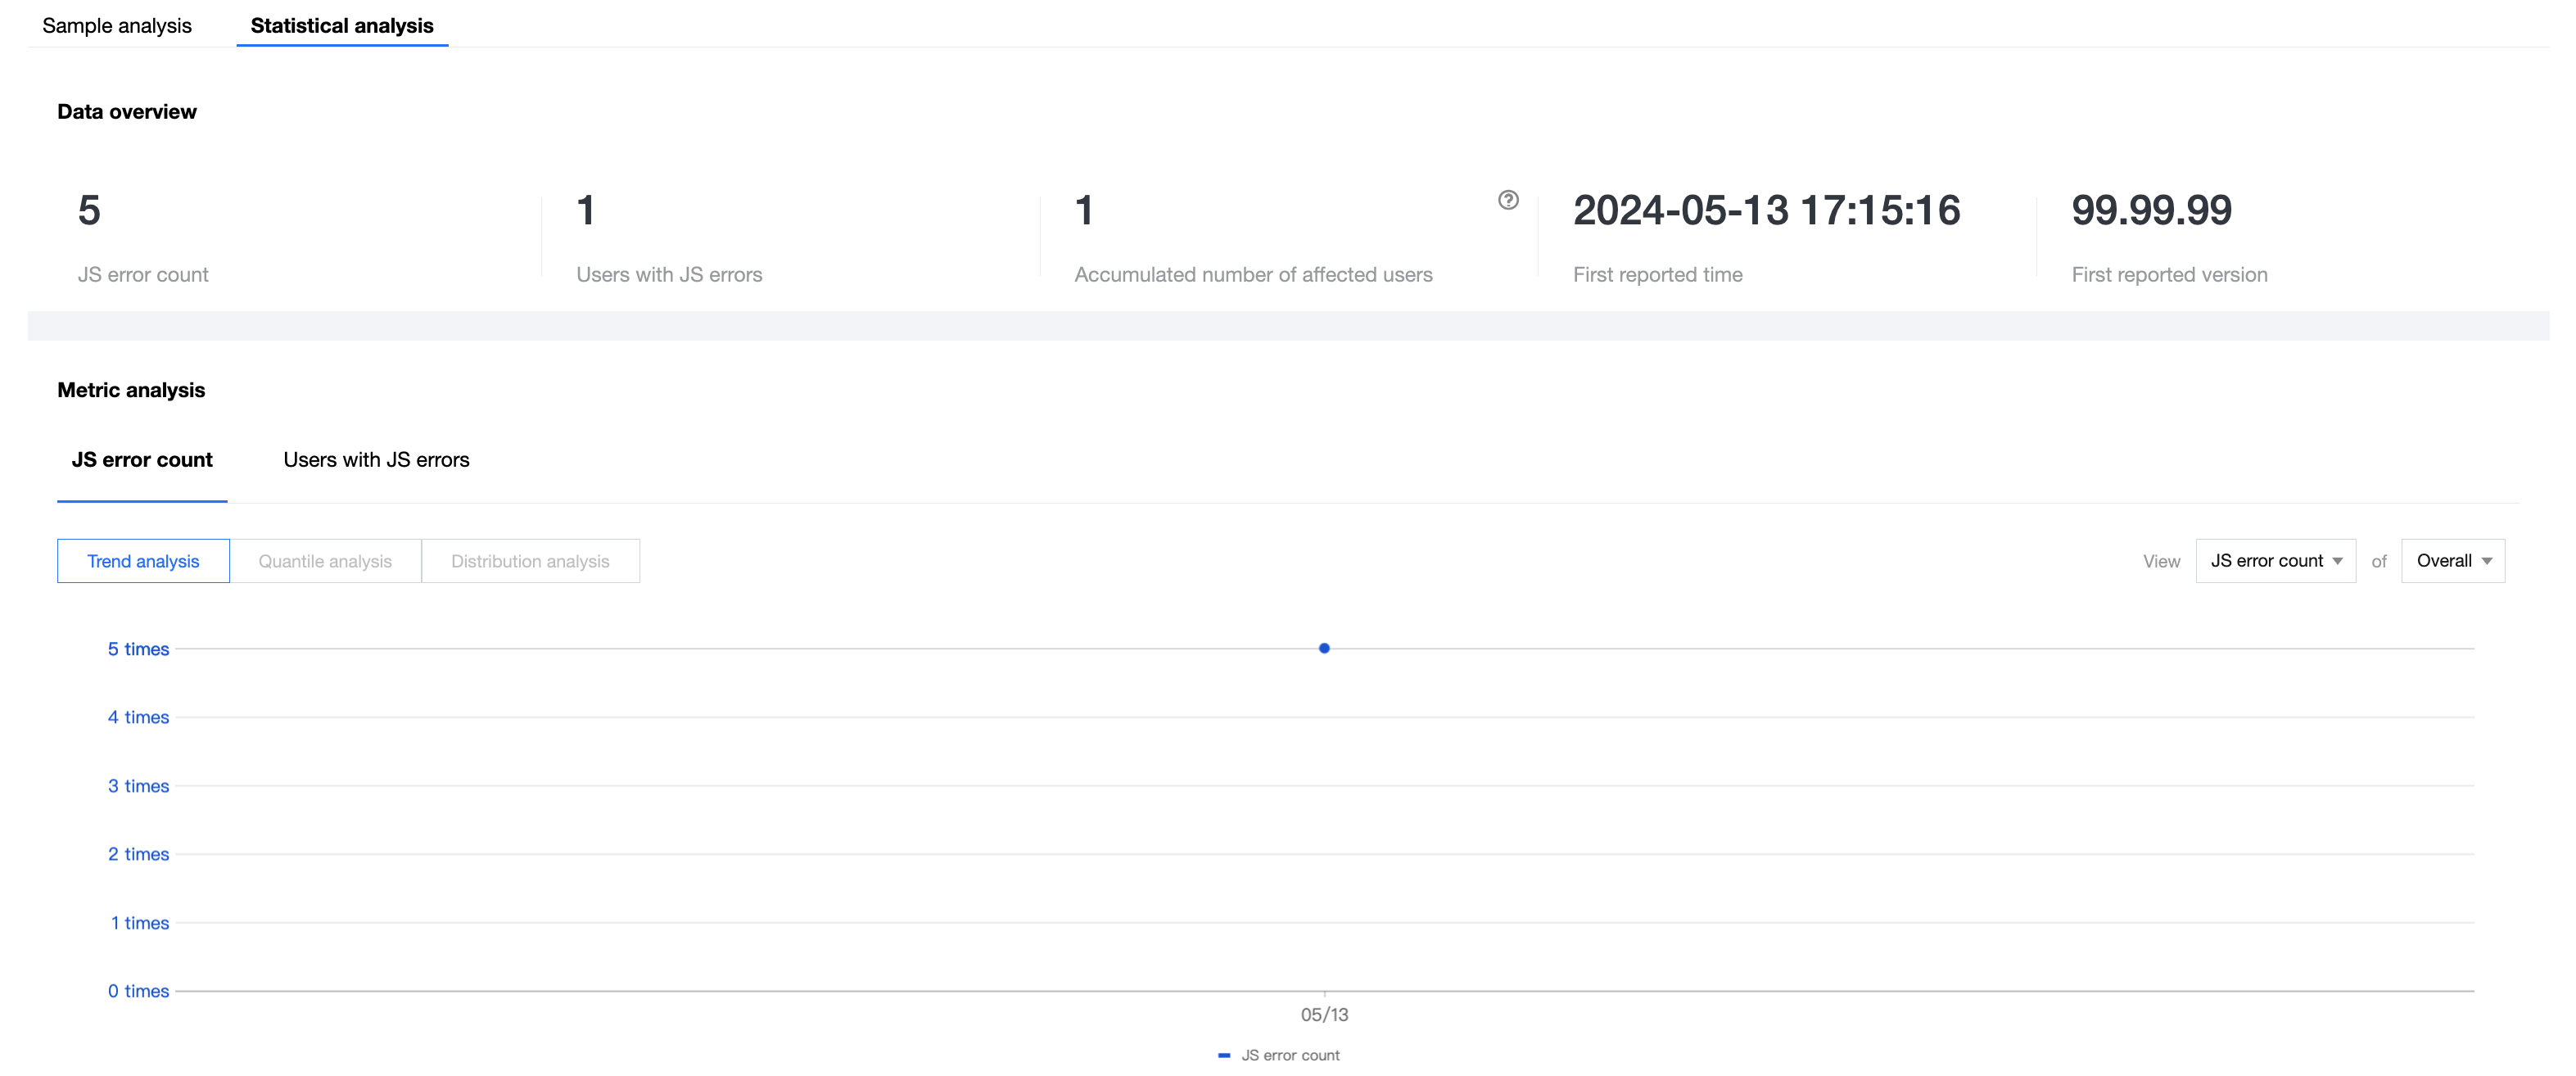
6.5 Statistical analysis
Statistical analysis helps you analyze an issue based on the issue trend and quickly locate the first occurrence time, first occurrence version, and surge time of an issue.
FAQs
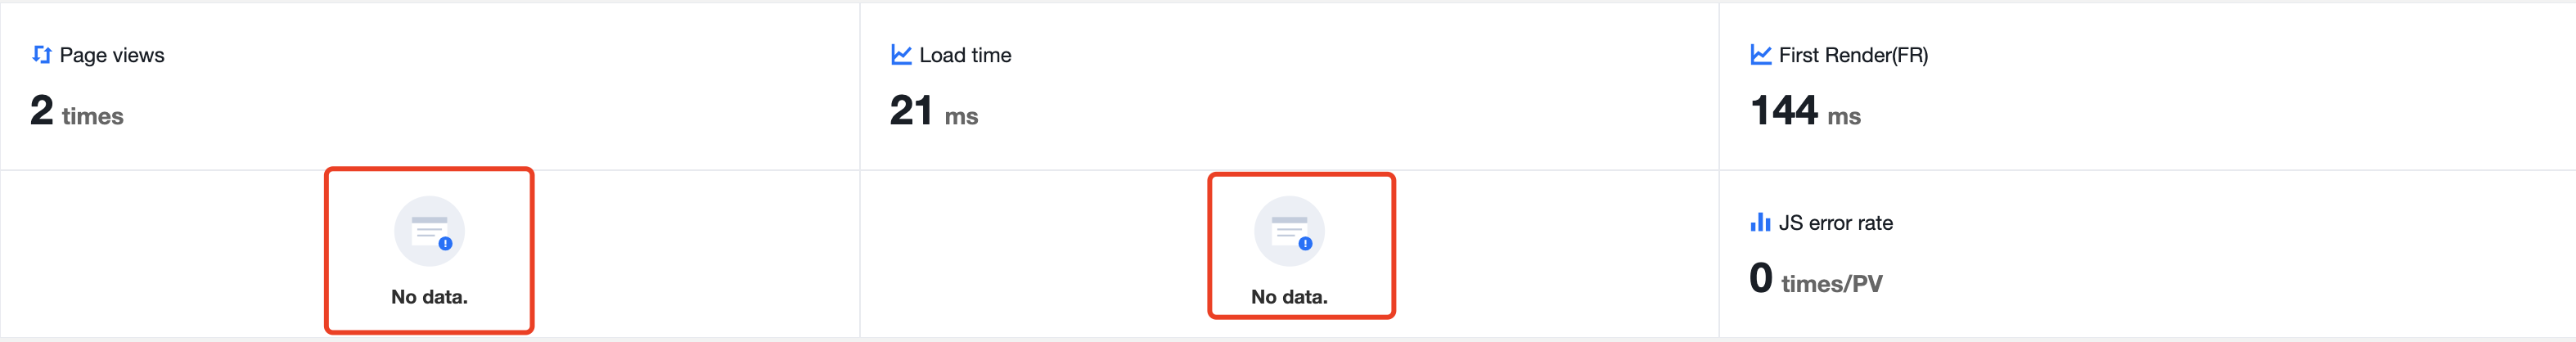
1、Q: Why do some sections on the Overview dashboard have no data?
A: There may be multiple causes, typically including the following: No data is reported under the selected filters. No data is reported under the selected filters. This is often the case when the selected time range is too small or only a small number of versions are filtered. In this case, you can choose to expand the filter range.
2、Q: Why do data values such as unknown and NoPermission appear on pages?
A: Sometimes, a few fields cannot be collected due to the network, runtime environment, or permission of the device, which is normal. Some of them are as described below:
NoPermission: No permission is granted by the app or app user to get the field.
NoNetwork: The field is not obtained, as the user device is not connected when the issue occurred, which is the case only for network fields.
UnknownNetwork: The network type is unknown (a type other than 2G, 3G, 4G, 5G, or Wi-Fi).
user_not_set: The field is not set by the SDK user, which is the case only for fields to be manually set.
user_set_empty: The field is set to null by the SDK user, which is the case only for fields to be manually set.
unknown: The field is not obtained due to something unknown in the device or environment.
Unavailable: The field is not obtained due to something unknown in the device or environment.
3、Q: What should I do if there is no data on feature analysis pages?
A: Check that the reporting of corresponding features has been enabled according to the SDK integration document and corresponding issues have been triggered. For how to enable and verify reporting, see the corresponding feature modules in the integration document. If you have confirmed that reporting is enabled and the corresponding issues are triggered, you can adjust the filters to expand the search range and search for the corresponding data again.
4、Q: Why is the request and response information in the slow request issue details inconsistent with the actual information of my request?
A: The network request and response information may contain sensitive user information, which will be removed by QAPM from the report. Therefore, the difference is normal. For more information on the removal rules, see the SDK integration document.
2. Overview
2.1 Feature introduction
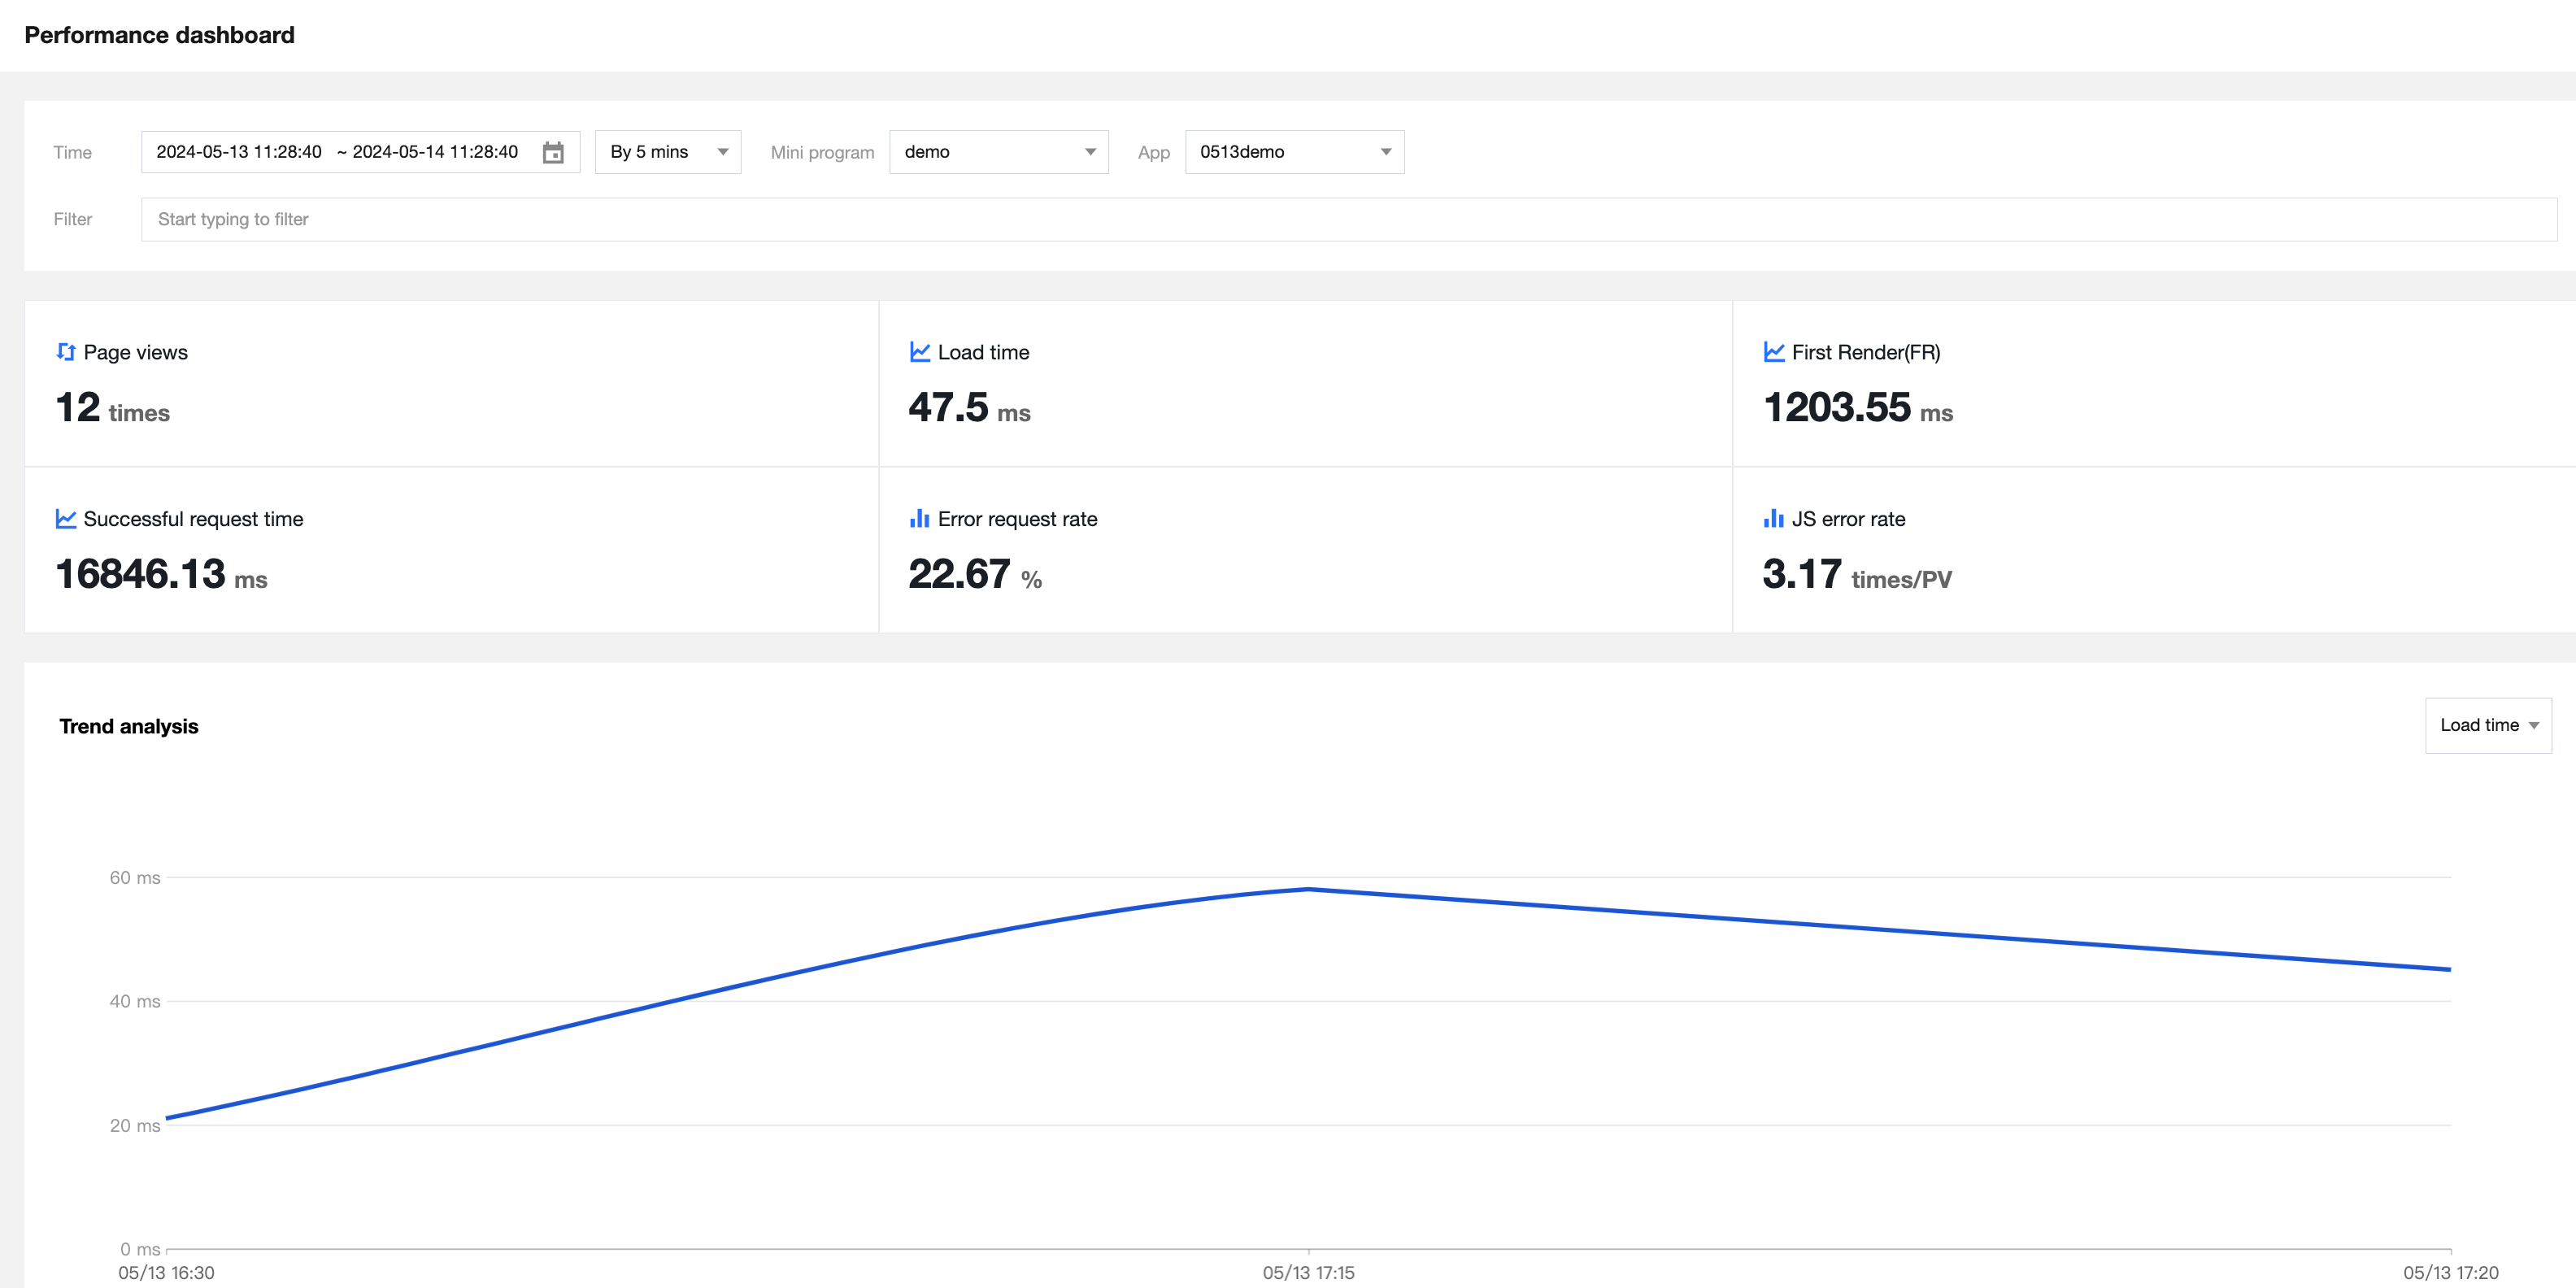
The overview dashboard mainly consists of the metric dashboard and trend analysis. It is designed to help you get a quick glimpse of the app performance overview and trends and perform a drill-down analysis on key performance bottlenecks to identify root causes.
2.2 Feature description
All content on the overview page is subject to the global filter at the top.
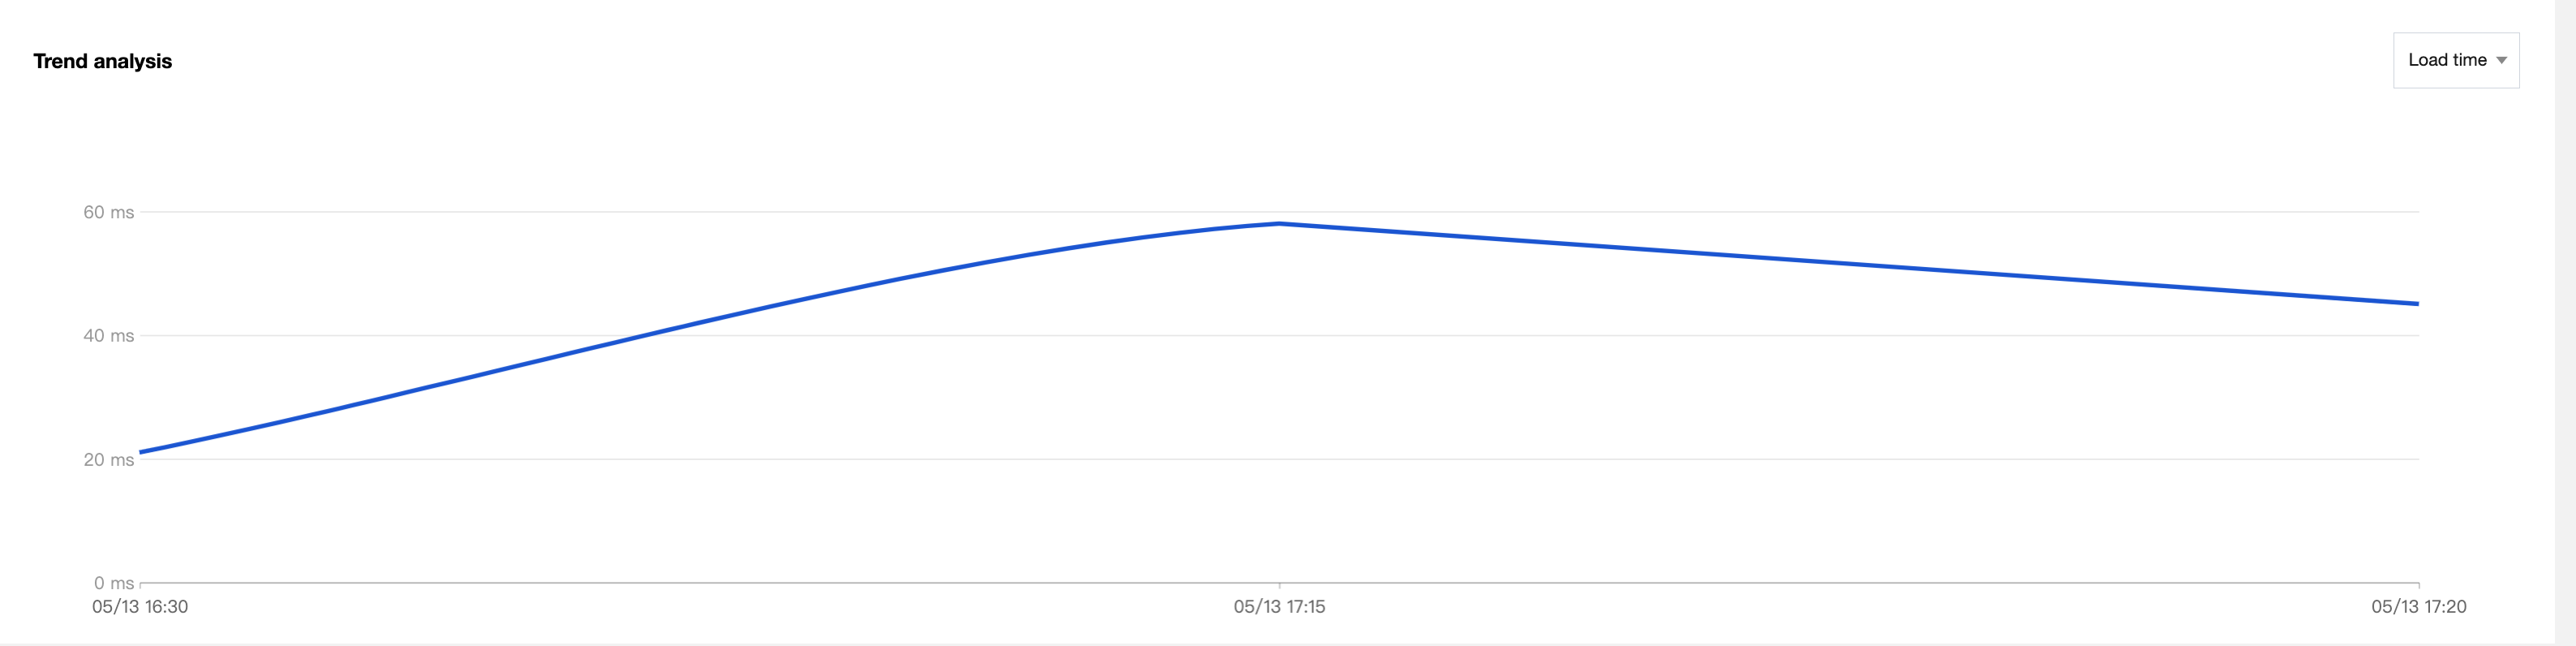
2.2.1 Trend analysis dashboard
The trend analysis dashboard displays the trends of core metrics to help you quickly identify exceptions. You can also use the global filter to focus on the trend of certain versions and their issues.
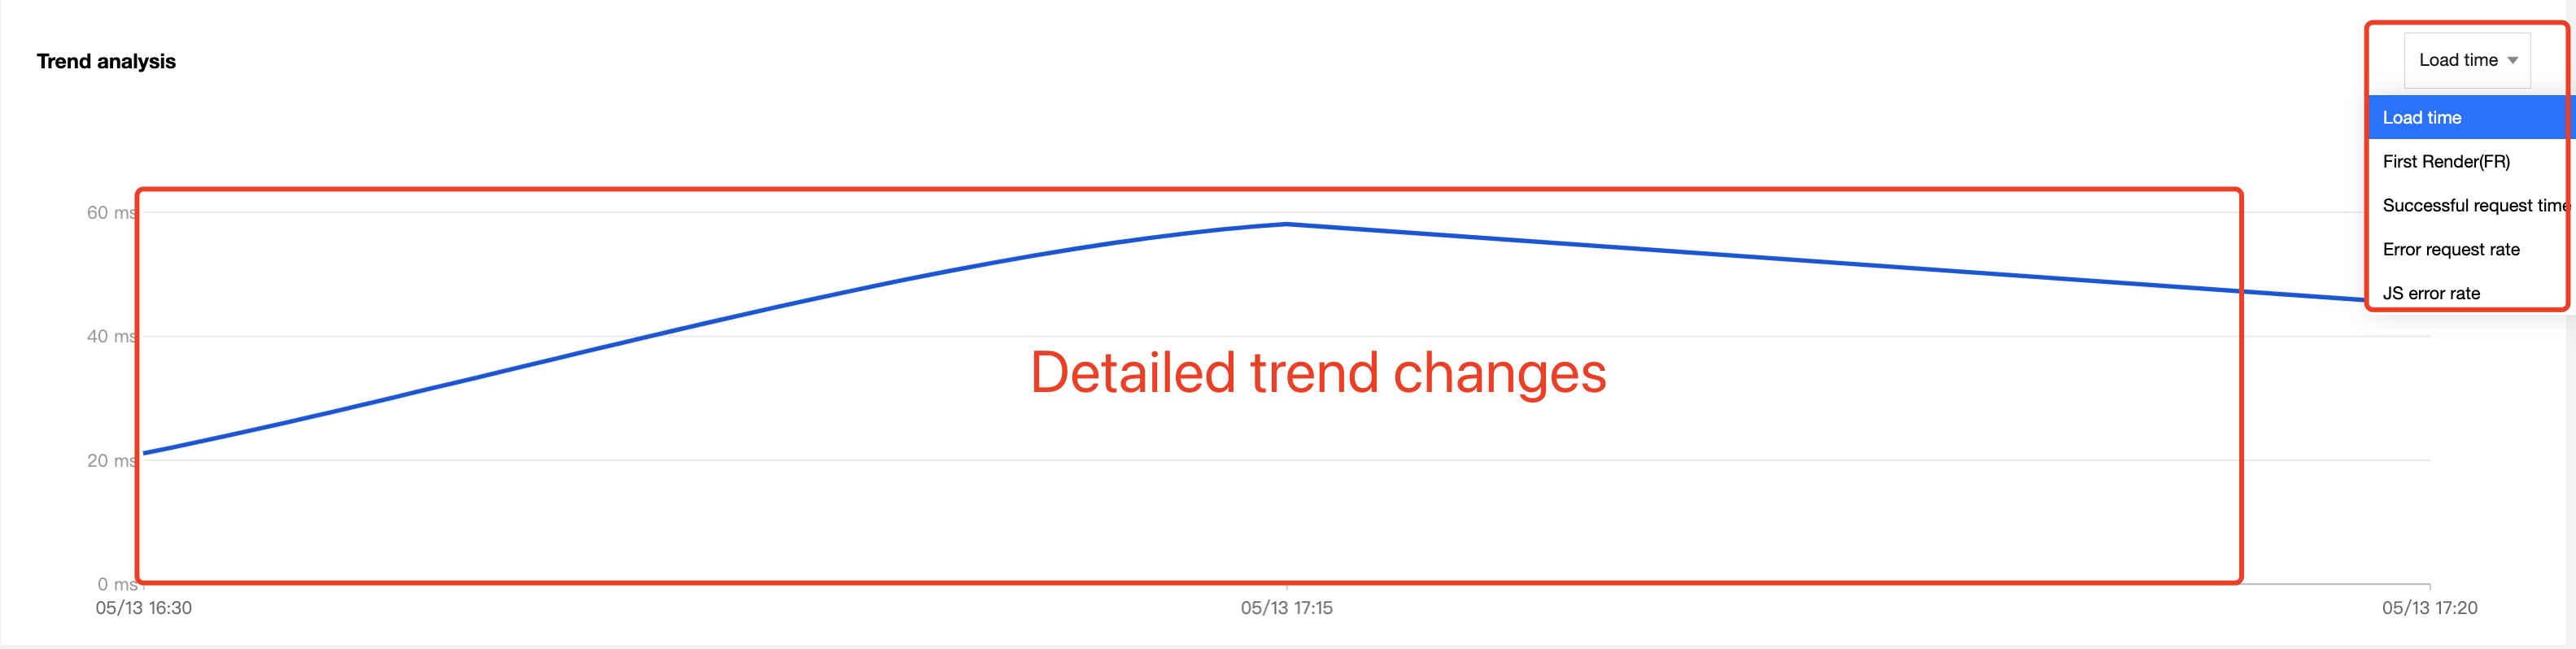
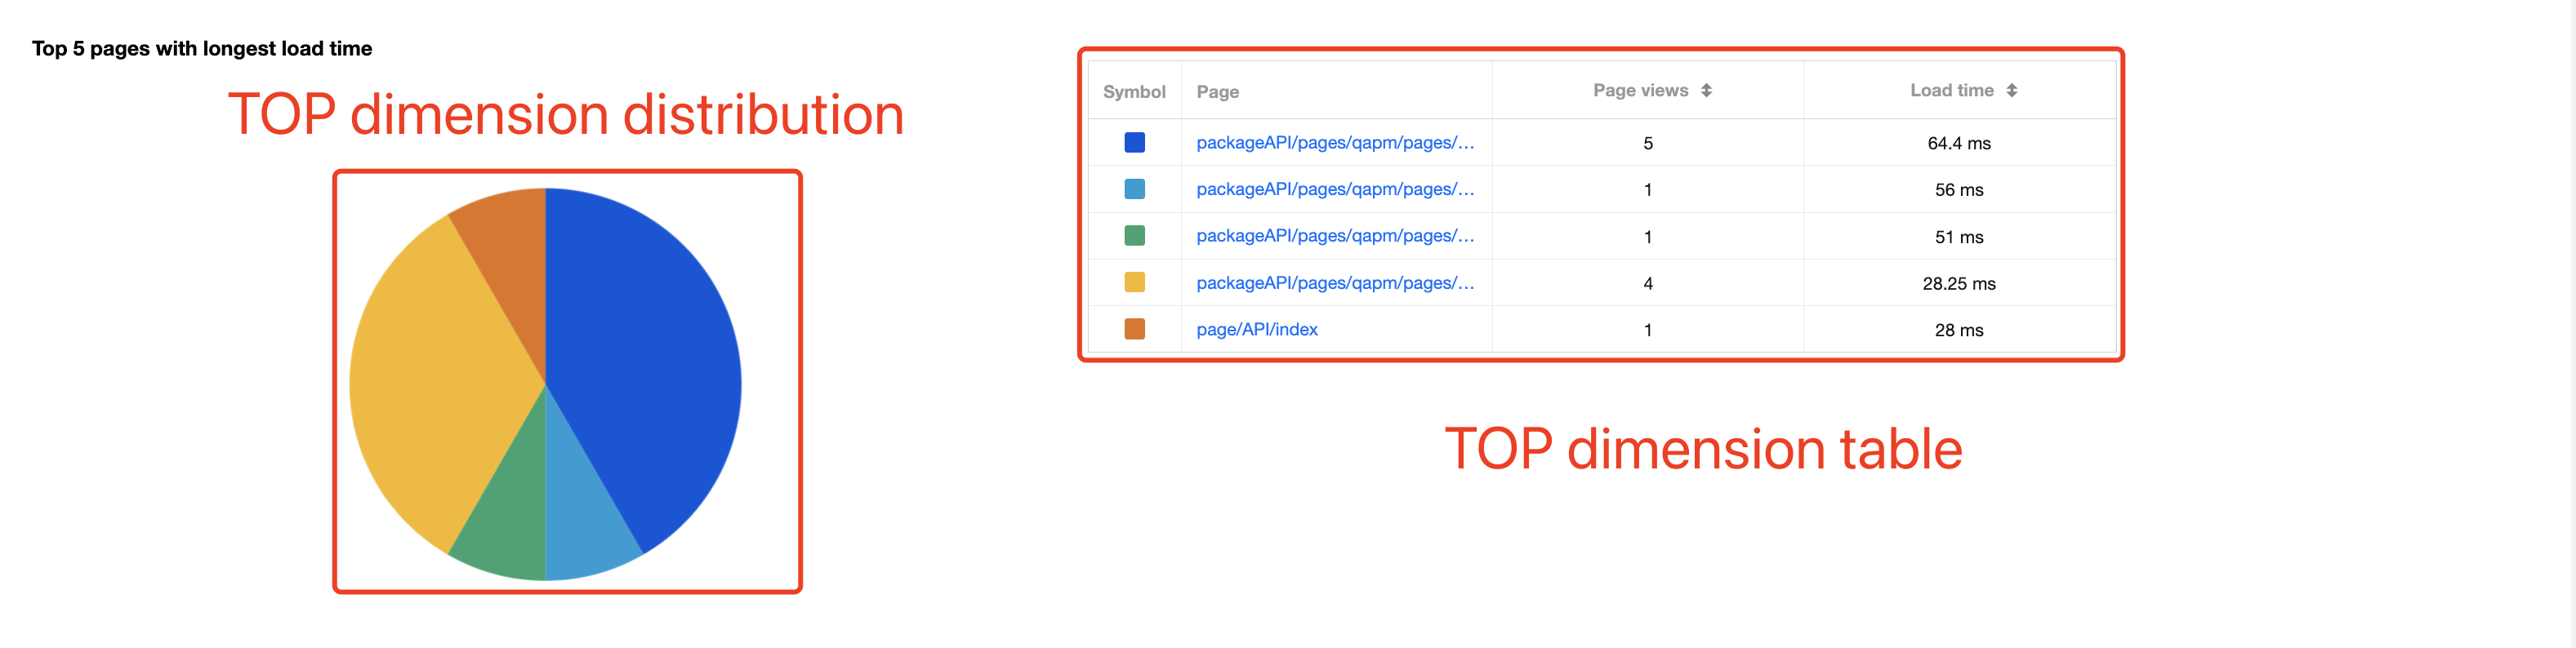
2.2.2 Top 5 analysis
The top 5 analysis feature allows you to switch between metrics to view their detailed trend changes on the trend analysis dashboard. It also provides the distribution and details of the top 5 objects that are most seriously affected by the issue for different performance issue types. The distribution information helps you quickly determine whether the issue is extreme, and the details can help you further determine the impact scope of the issue and drill down to the corresponding analysis page through the details table.
3. Page experience analysis
3.1 Feature introduction
QAPM page experience analysis allows you to analyze slow loading of mini program pages. Specifically, it offers metric, multidimensional, and details analysis capabilities.
Glossary of page experience analysis
Page switches: The total number of page switches triggered by the user.
First rendering time (FR): firstRender. duration. The first rendering of a page is triggered when the target page for page switching does not exist. The duration of the first rendering starts when the logical layer receives a routing event and ends when the page is onReady, including the time of logical layer page and component initialization, VD sync, and rendering execution on the rendering layer.
First paint (FP) duration: firstPaint. The time taken from the initiation of a routing event to the first paint (the first pixel rendered to the screen).
Calculation method: PerformanceEntry(firstPaint).startTime – PerformanceEntry(route).startTime. It is not supported on iOS.
First contentful paint (FCP):firstContentfulPaint: The time taken from the initiation of a routing event to the first contentful paint (the first bit of content rendered to the screen).
Calculation method: PerformanceEntry(largestContentfulPaint).startTime – PerformanceEntry(route).startTime. This calculation is not supported by versions earlier than iOS 14.5.
Largest Contentful Paint (LCP)largestContentfulPaint: The time taken from initiating a routing event to painting the largest content of the page.
Calculation method: PerformanceEntry(largestContentfulPaint).startTime - PerformanceEntry(route).startTime. It is not supported on iOS.
Page switch time: The time from when the user starts page switch to when the switch is completed.
If it is supported by the mini program version and system version, the calculation method is navigation.route.endTime – navigation.route.startTime.
If navigation.route.startTime and navigation.route.endTime are not supported by the mini program version and system version, onUnload/onHide of the previous page is used as the start time, and onReady of the target page is used as the end time.
JS code injection duration: evaluateScript. The time taken by logical layer JS code injection (including compilation and execution).
3.2 Feature description
3.2.1 Trend analysis
Page switching trend analysis supports six metrics: page switching duration, first rendering (FR) duration, first paint (FP) duration, first contentful paint (FCP) duration, largest contentful paint (LCP) duration, and JS code injection duration. You can use trend analysis to quickly locate the time points where crashes surge or drop to facilitate cause locating.
3.2.2 Combined analysis
Page switching combined analysis allows you to combine observation dimensions (mini program version, platform app version, system, system version, and device type) and sorting conditions to view the top 7, top 10, and top 20 metric changes.
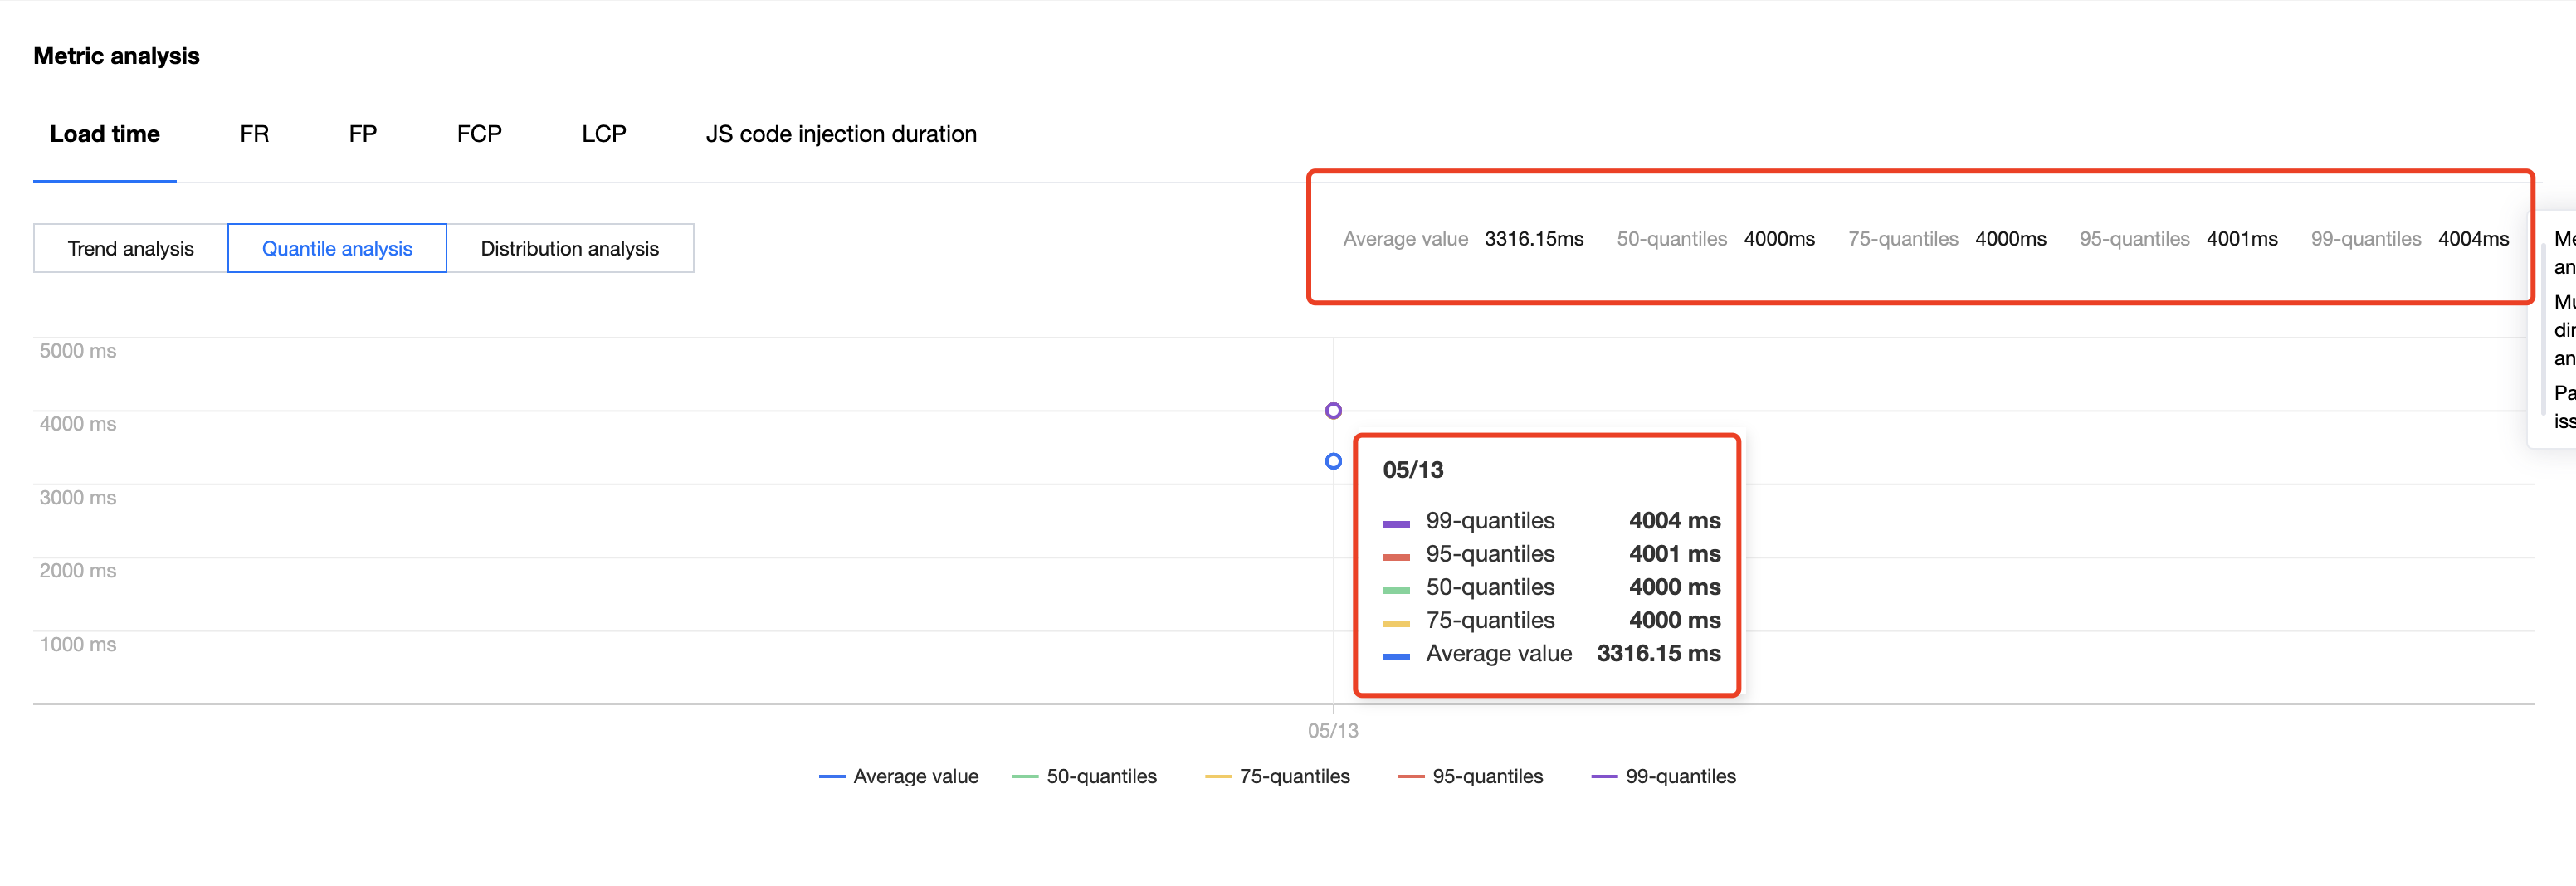
3.2.3 Percentile analysis
Percentile analysis displays the percentile and average values of loading duration for the selected filter. Percentile values help you comprehensively understand the layered trends of the sample data and locate the cause of abnormal fluctuations.
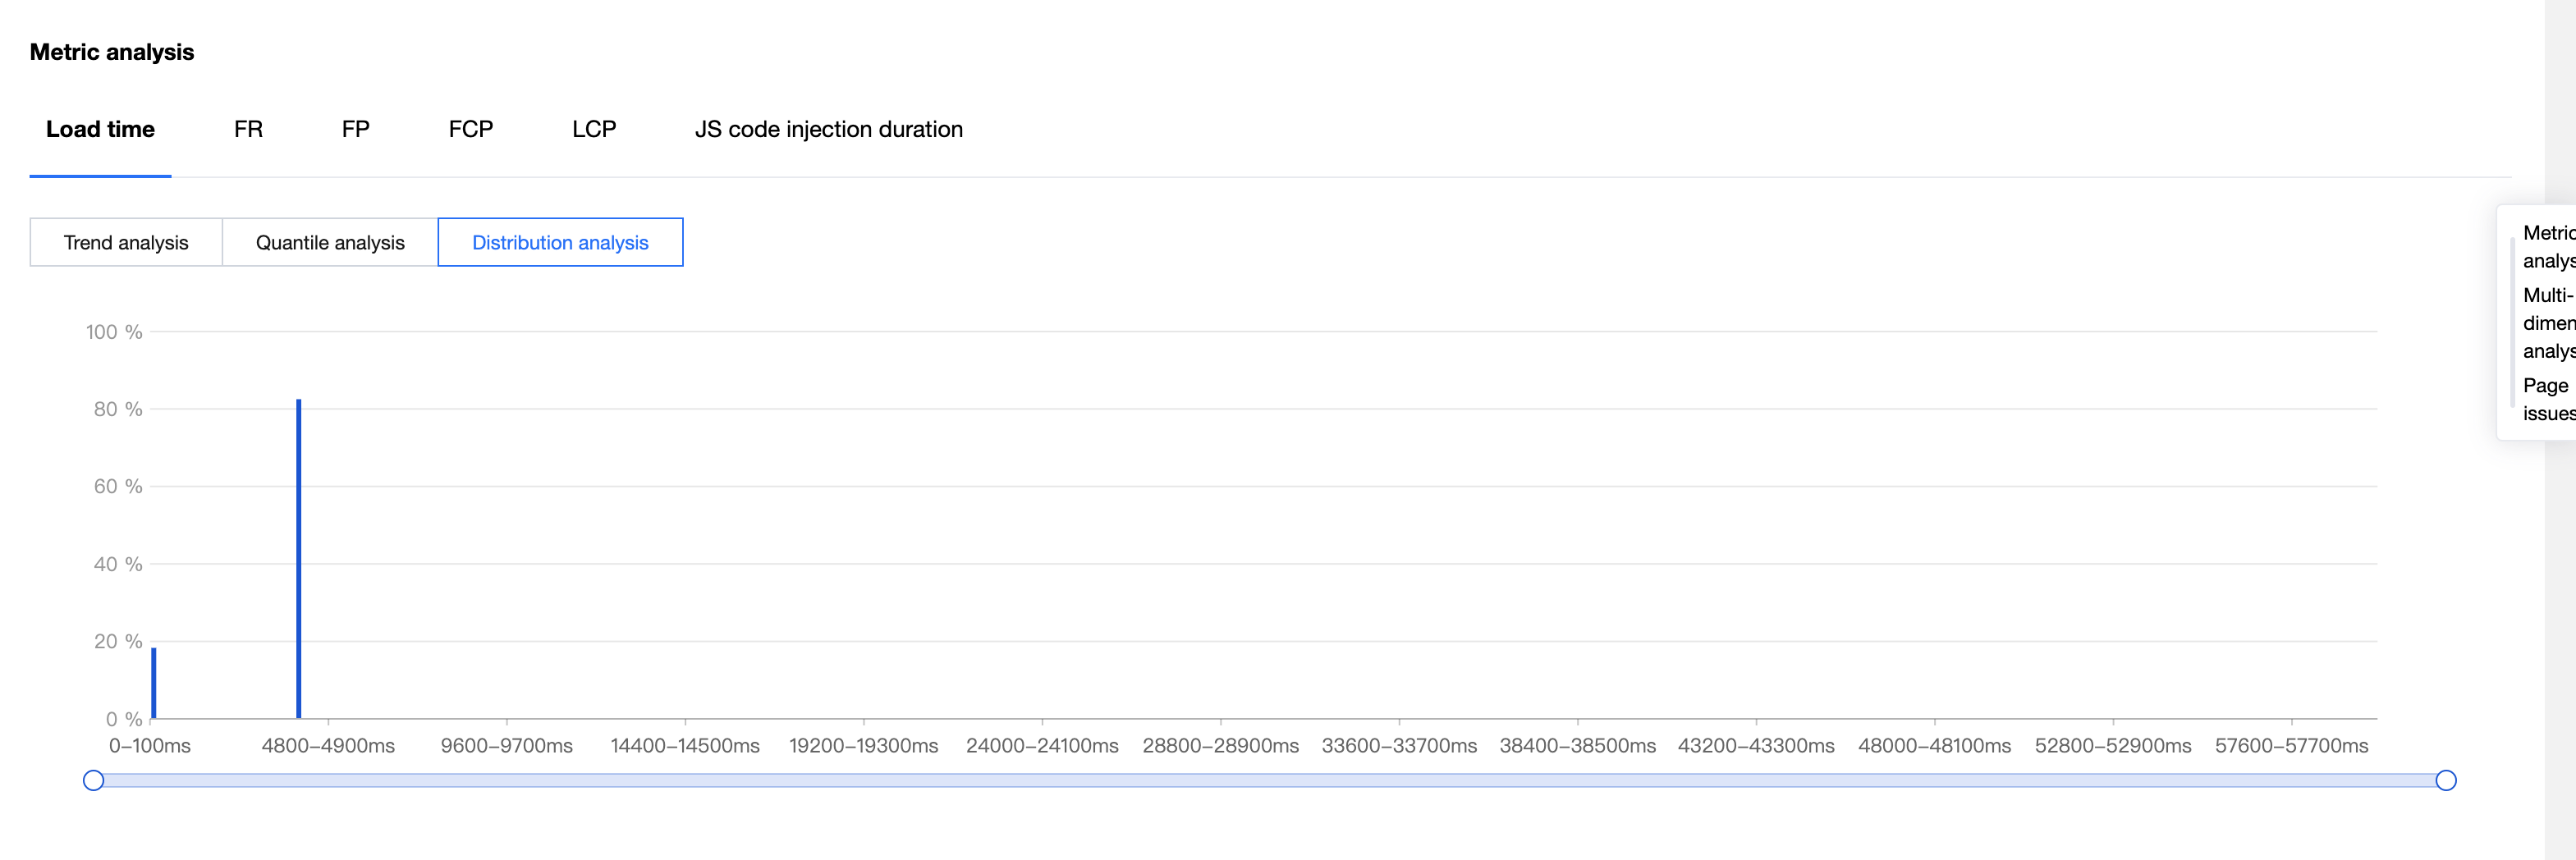
3.2.4 Distribution analysis
By default, the distribution analysis feature splits the sample data of the specified metric into equal ranges. Distribution analysis allows you to observe the distribution of the overall loading duration data in the effective value range to help make a performance optimization plan, and it can provide clear evidence before and after optimization to help evaluate the optimization effect.
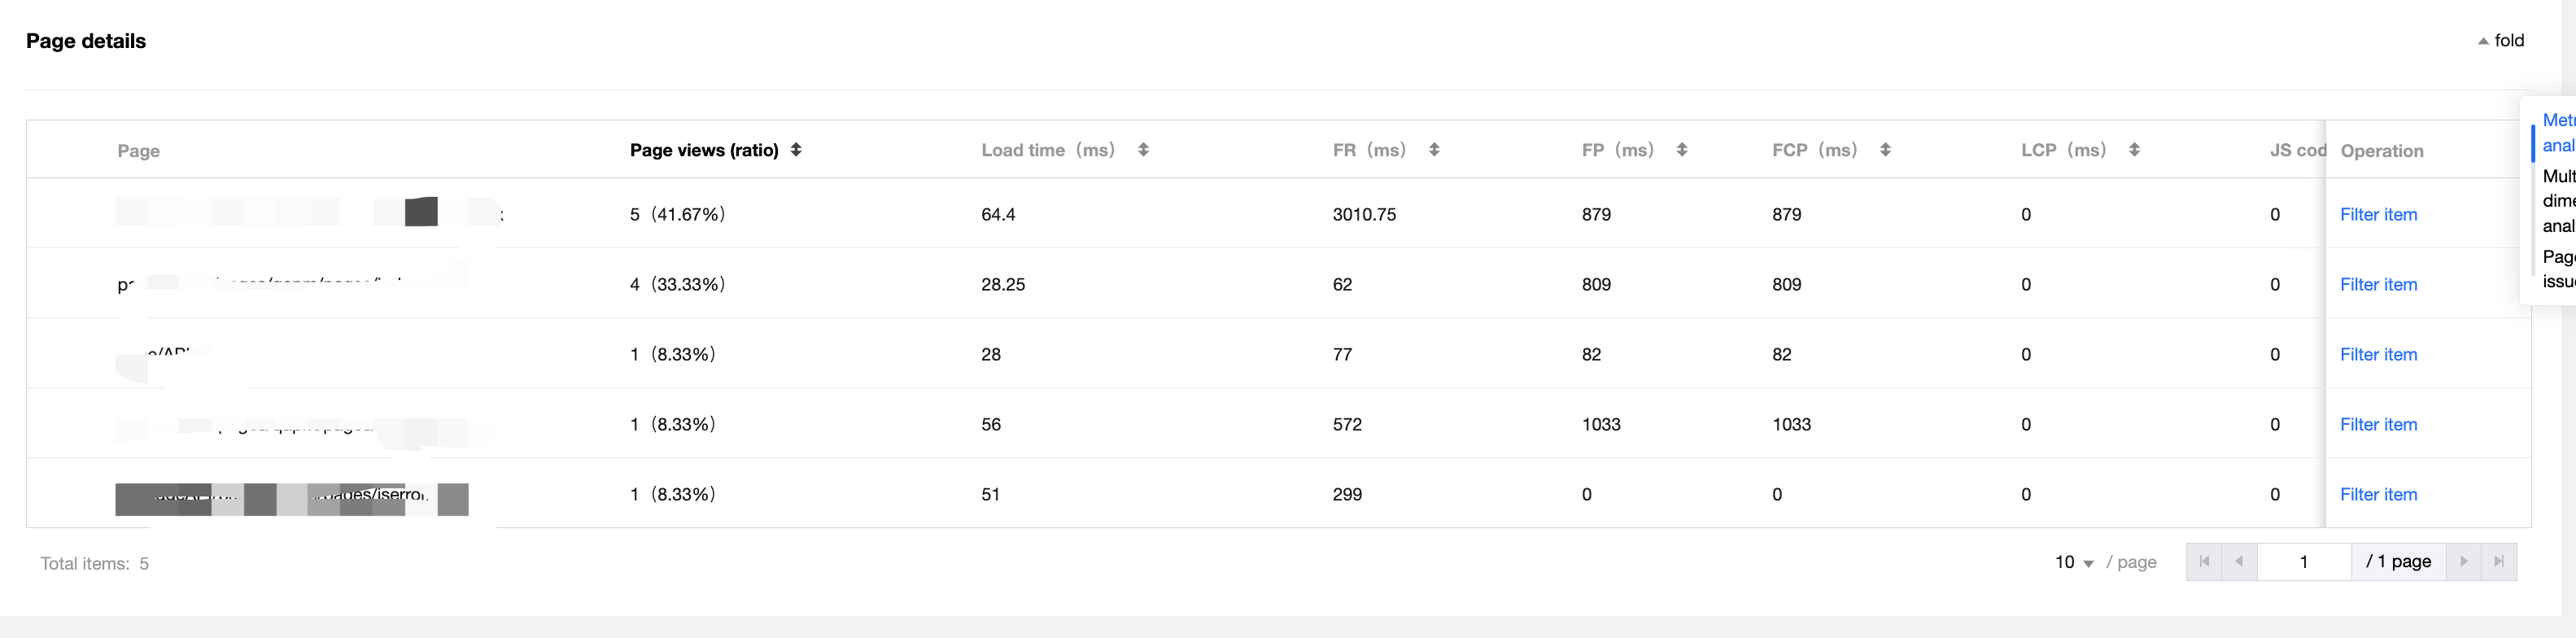
3.2.5 Page details
In the "Page details" area, you can view the page switching times and duration, first rendering (FR) duration, first paint (FP) duration, first contentful paint (FCP) duration, largest contentful paint (LCP) duration, and JS code injection duration of each page. You can sort these metric data in ascending or descending order to quickly locate the most problematic pages. You can also click "Filter" on the right to quickly set the item as a filter option.
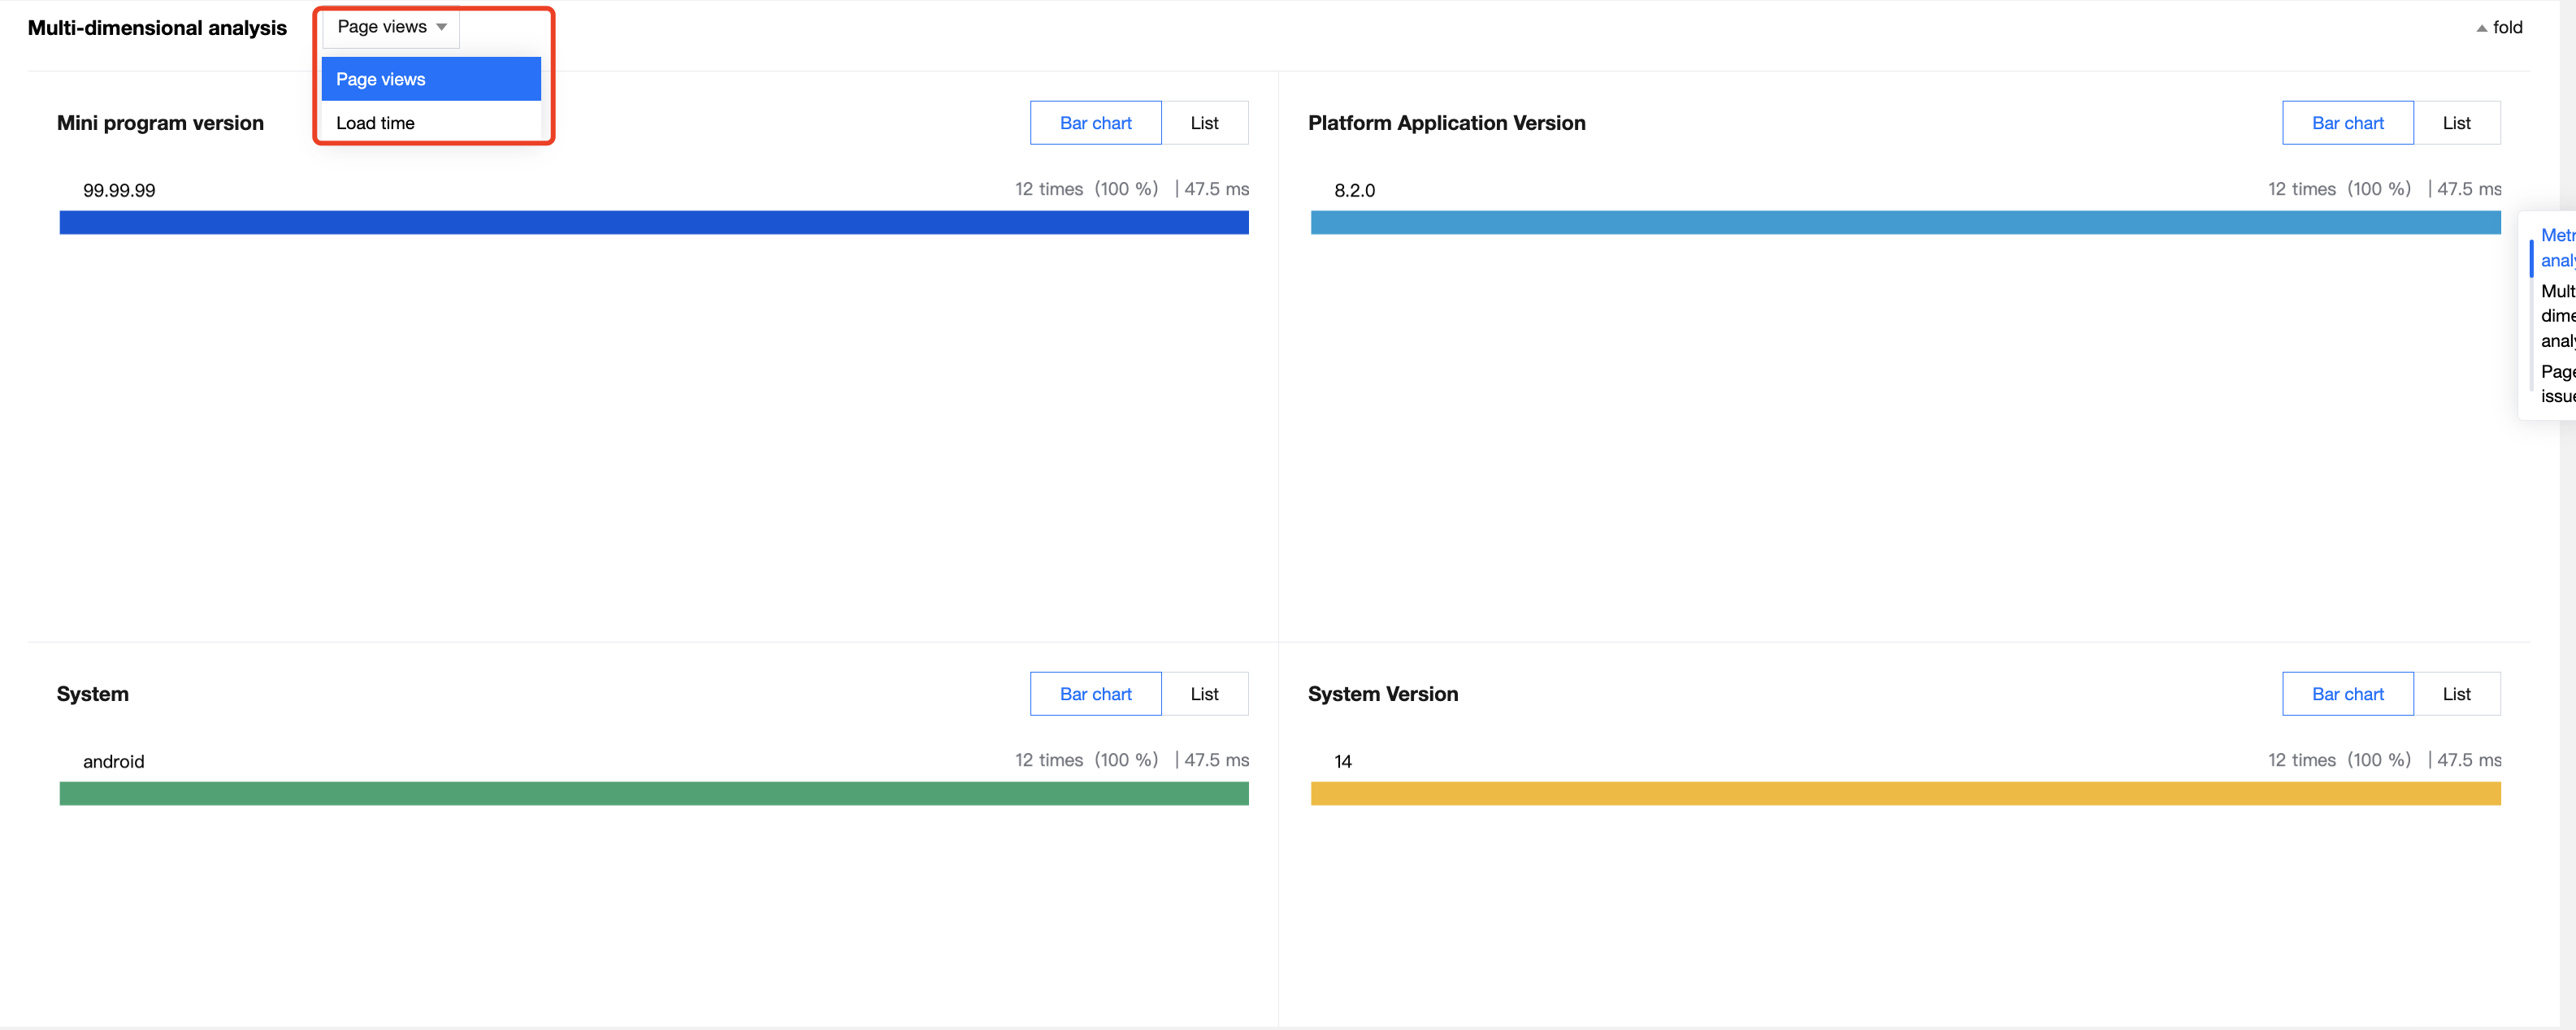
3.2.6 Multidimensional analysis
Multidimensional analysis of the page switch supports different dimensions: page switching duration, first rendering (FR) duration, first paint (FP) duration, first contentful paint (FCP) duration, largest contentful paint (LCP) duration, JS code injection duration, and page switching times. These multidimensional metric statistics can help you determine whether the slow page switching issue is concentrated on a certain object in a certain dimension.
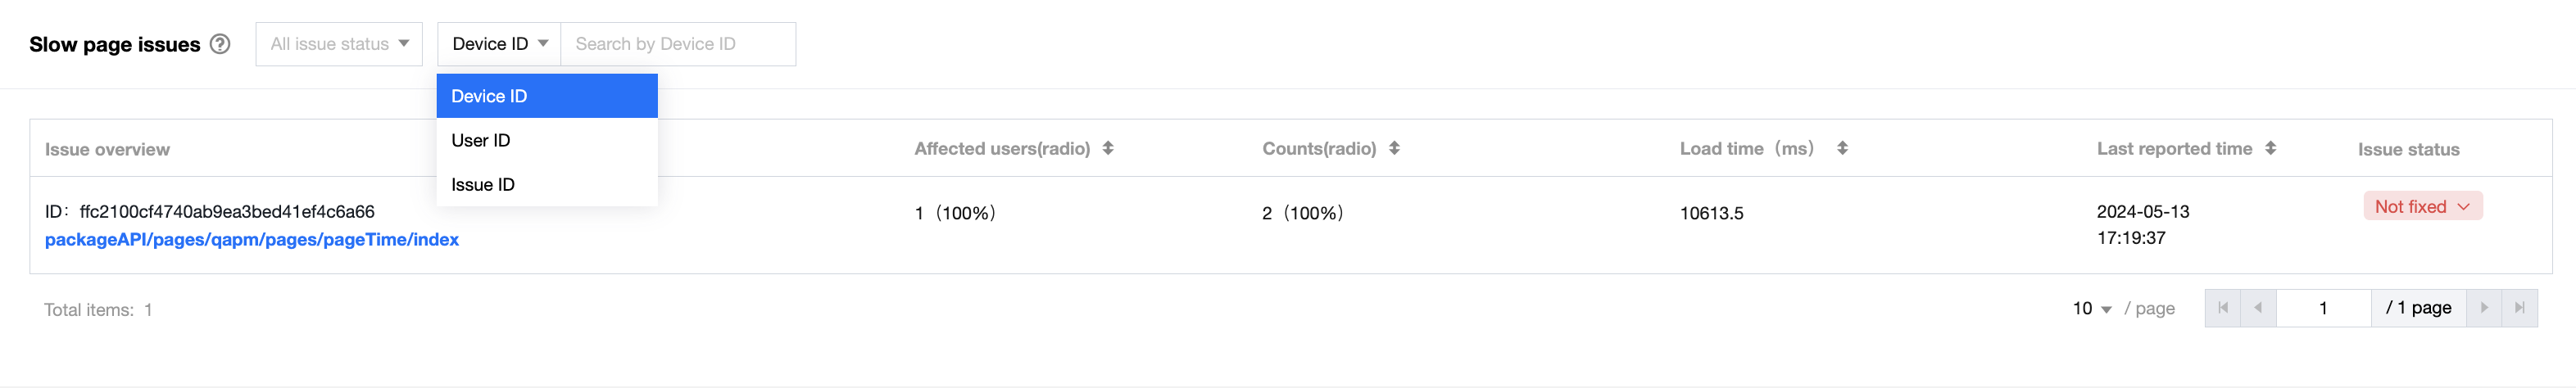
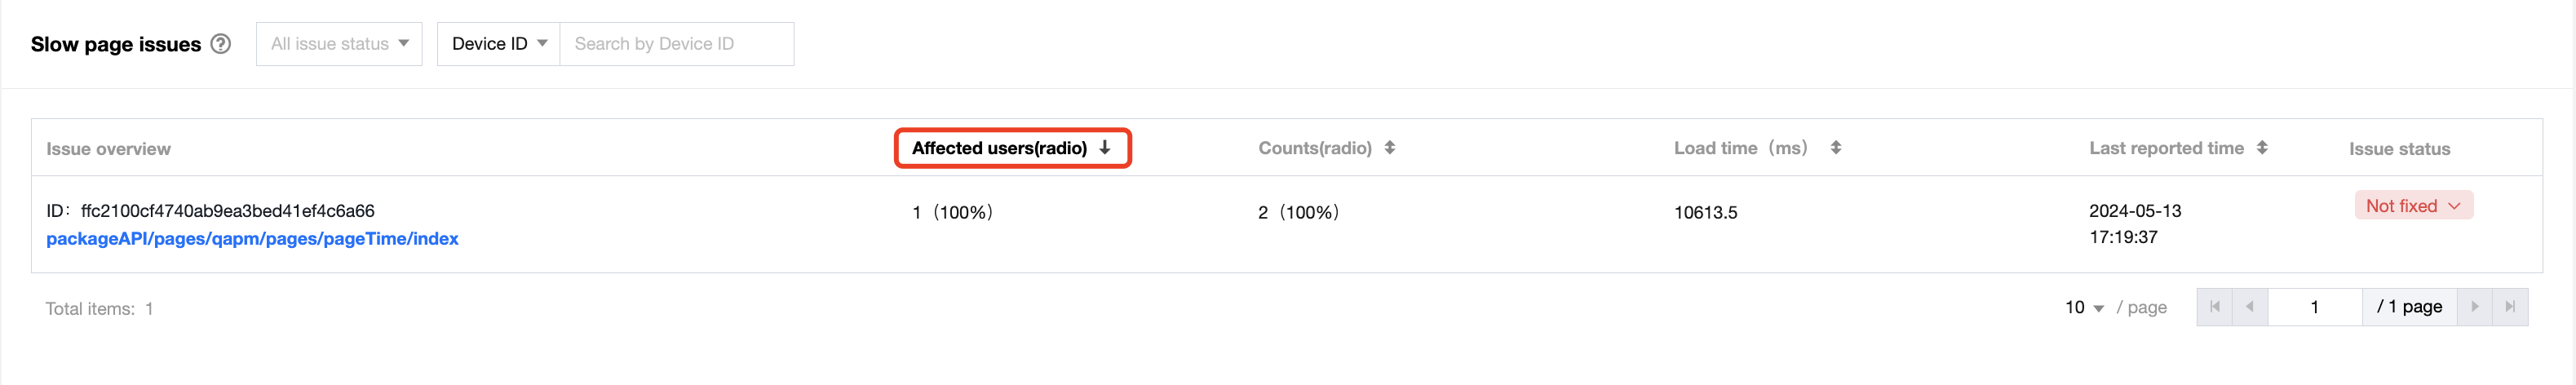
3.2.7 Issue list
QAPM will extract the issue characteristics based on the reported page information and aggregate similar issues according to the Tencent page logic. Each row in the list represents a separate page. In the list of slow page loading issues, you can set the issue status, device ID, user ID, or issue ID as a filter, which takes effect only for the list.
The issue list also allows you to sort data by the number of affected users, occurrences, page switching duration and last report time to sort out existing issues by impact scope.
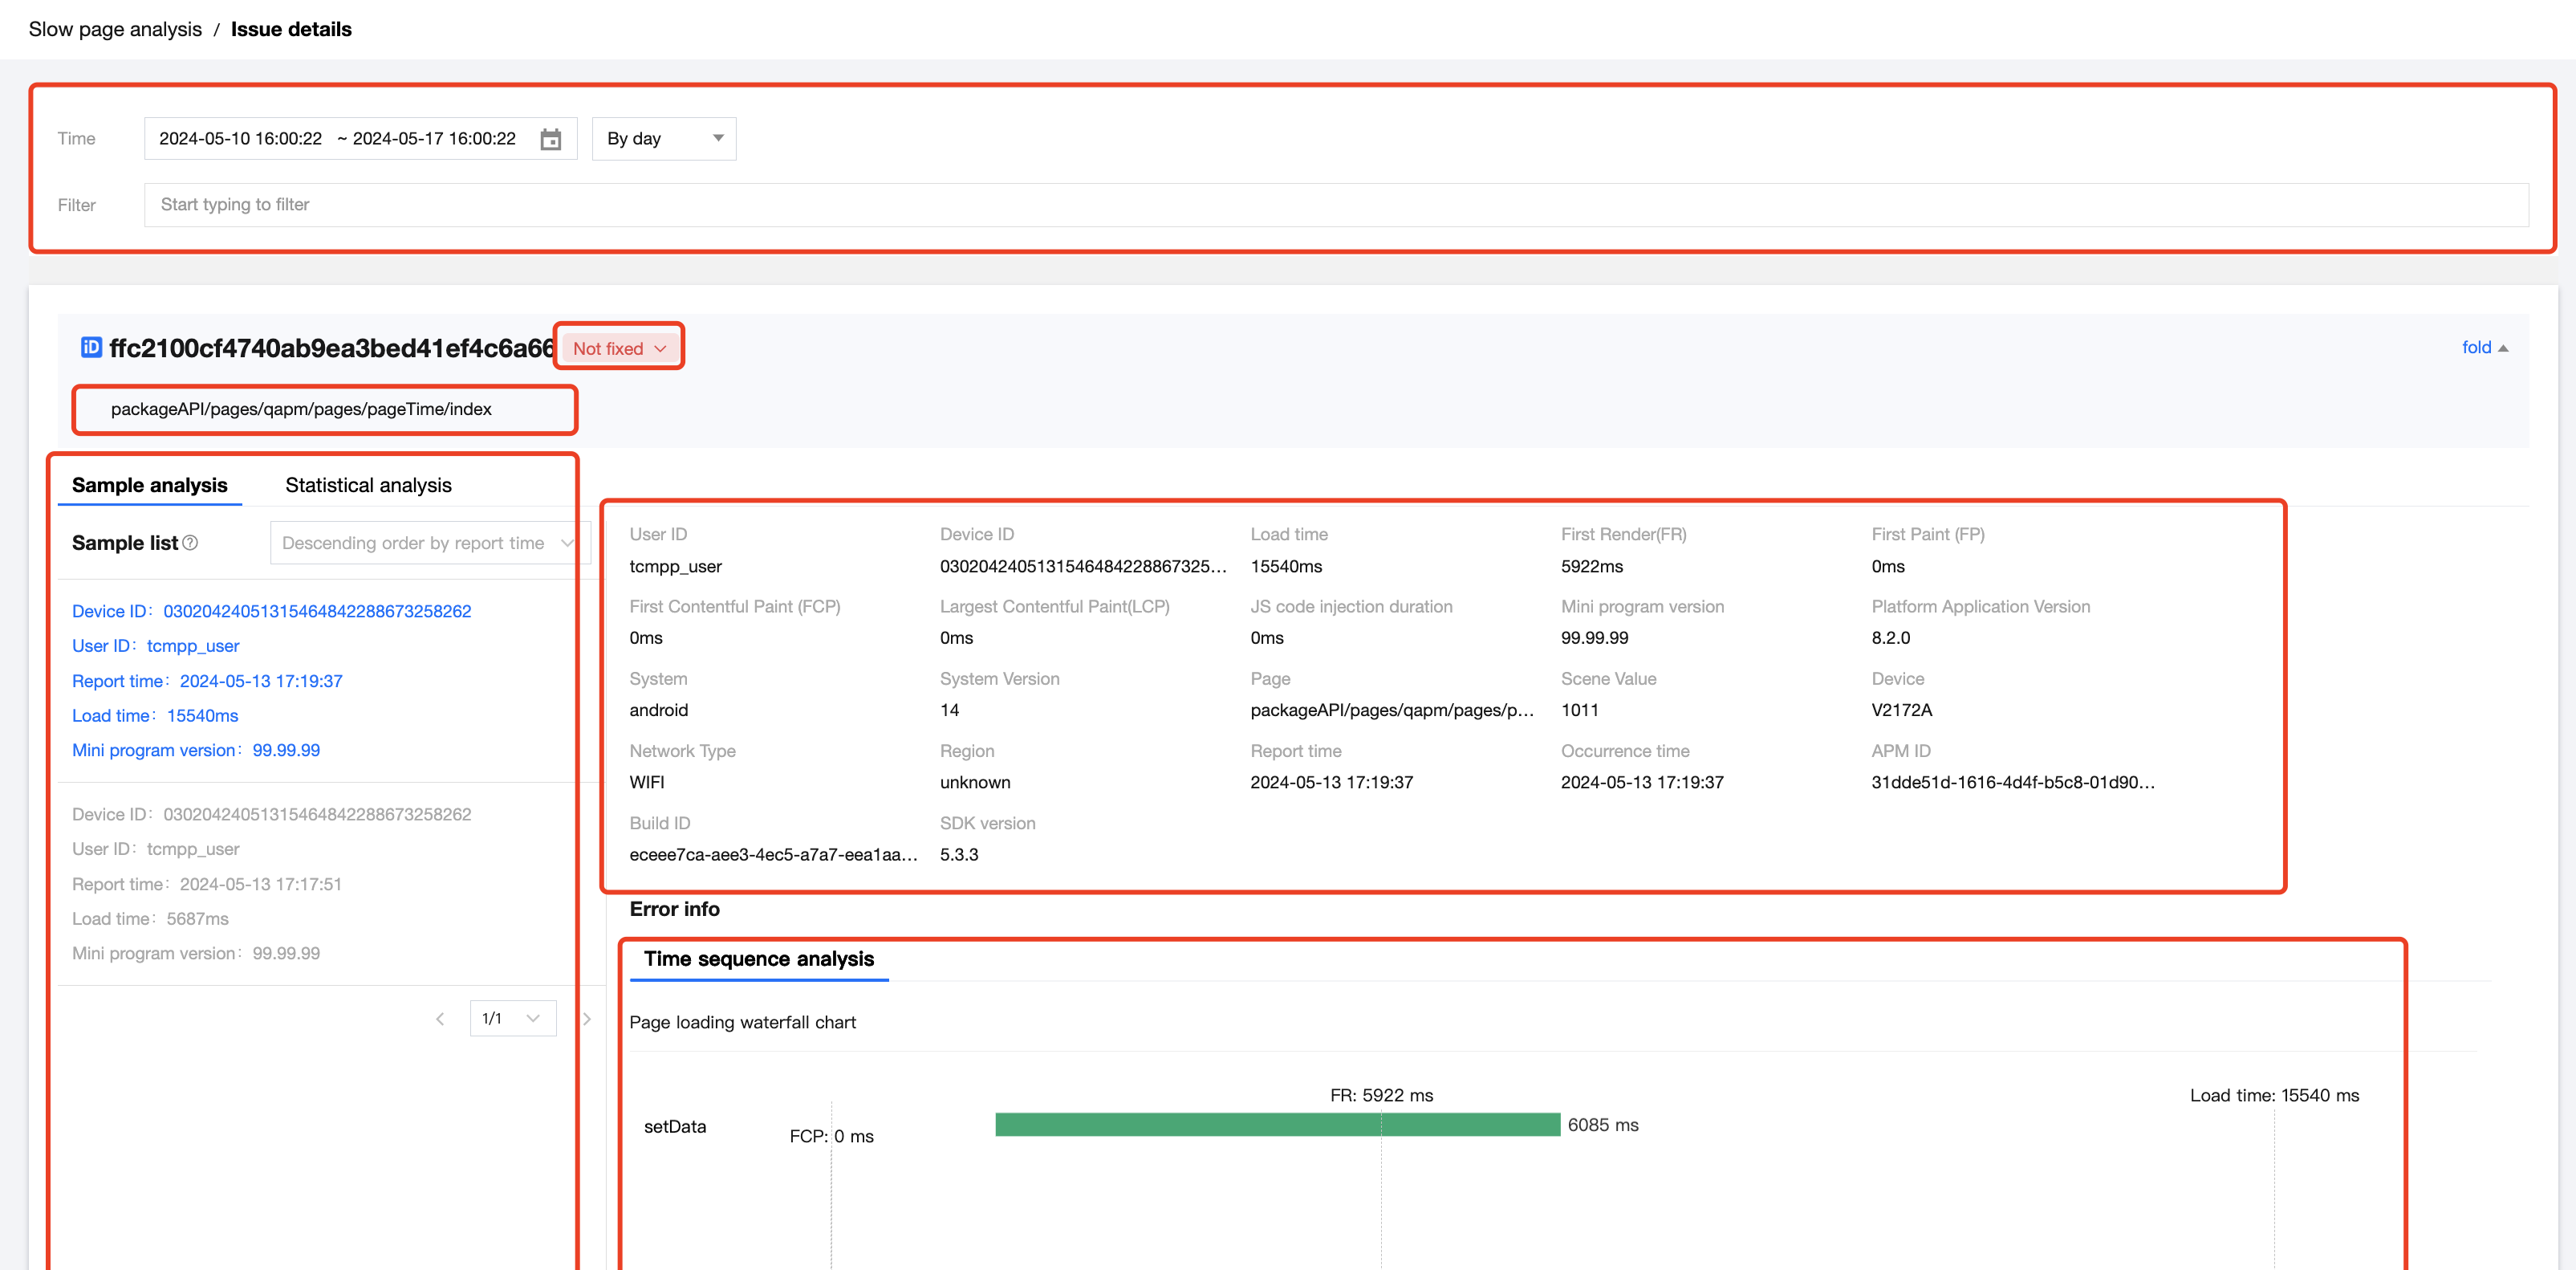
3.2.8 Issue details
On the issue details page, you can view different sample data of an issue. You can switch between samples by clicking different items in the sample list. You can also filter samples by prioritized dimension.
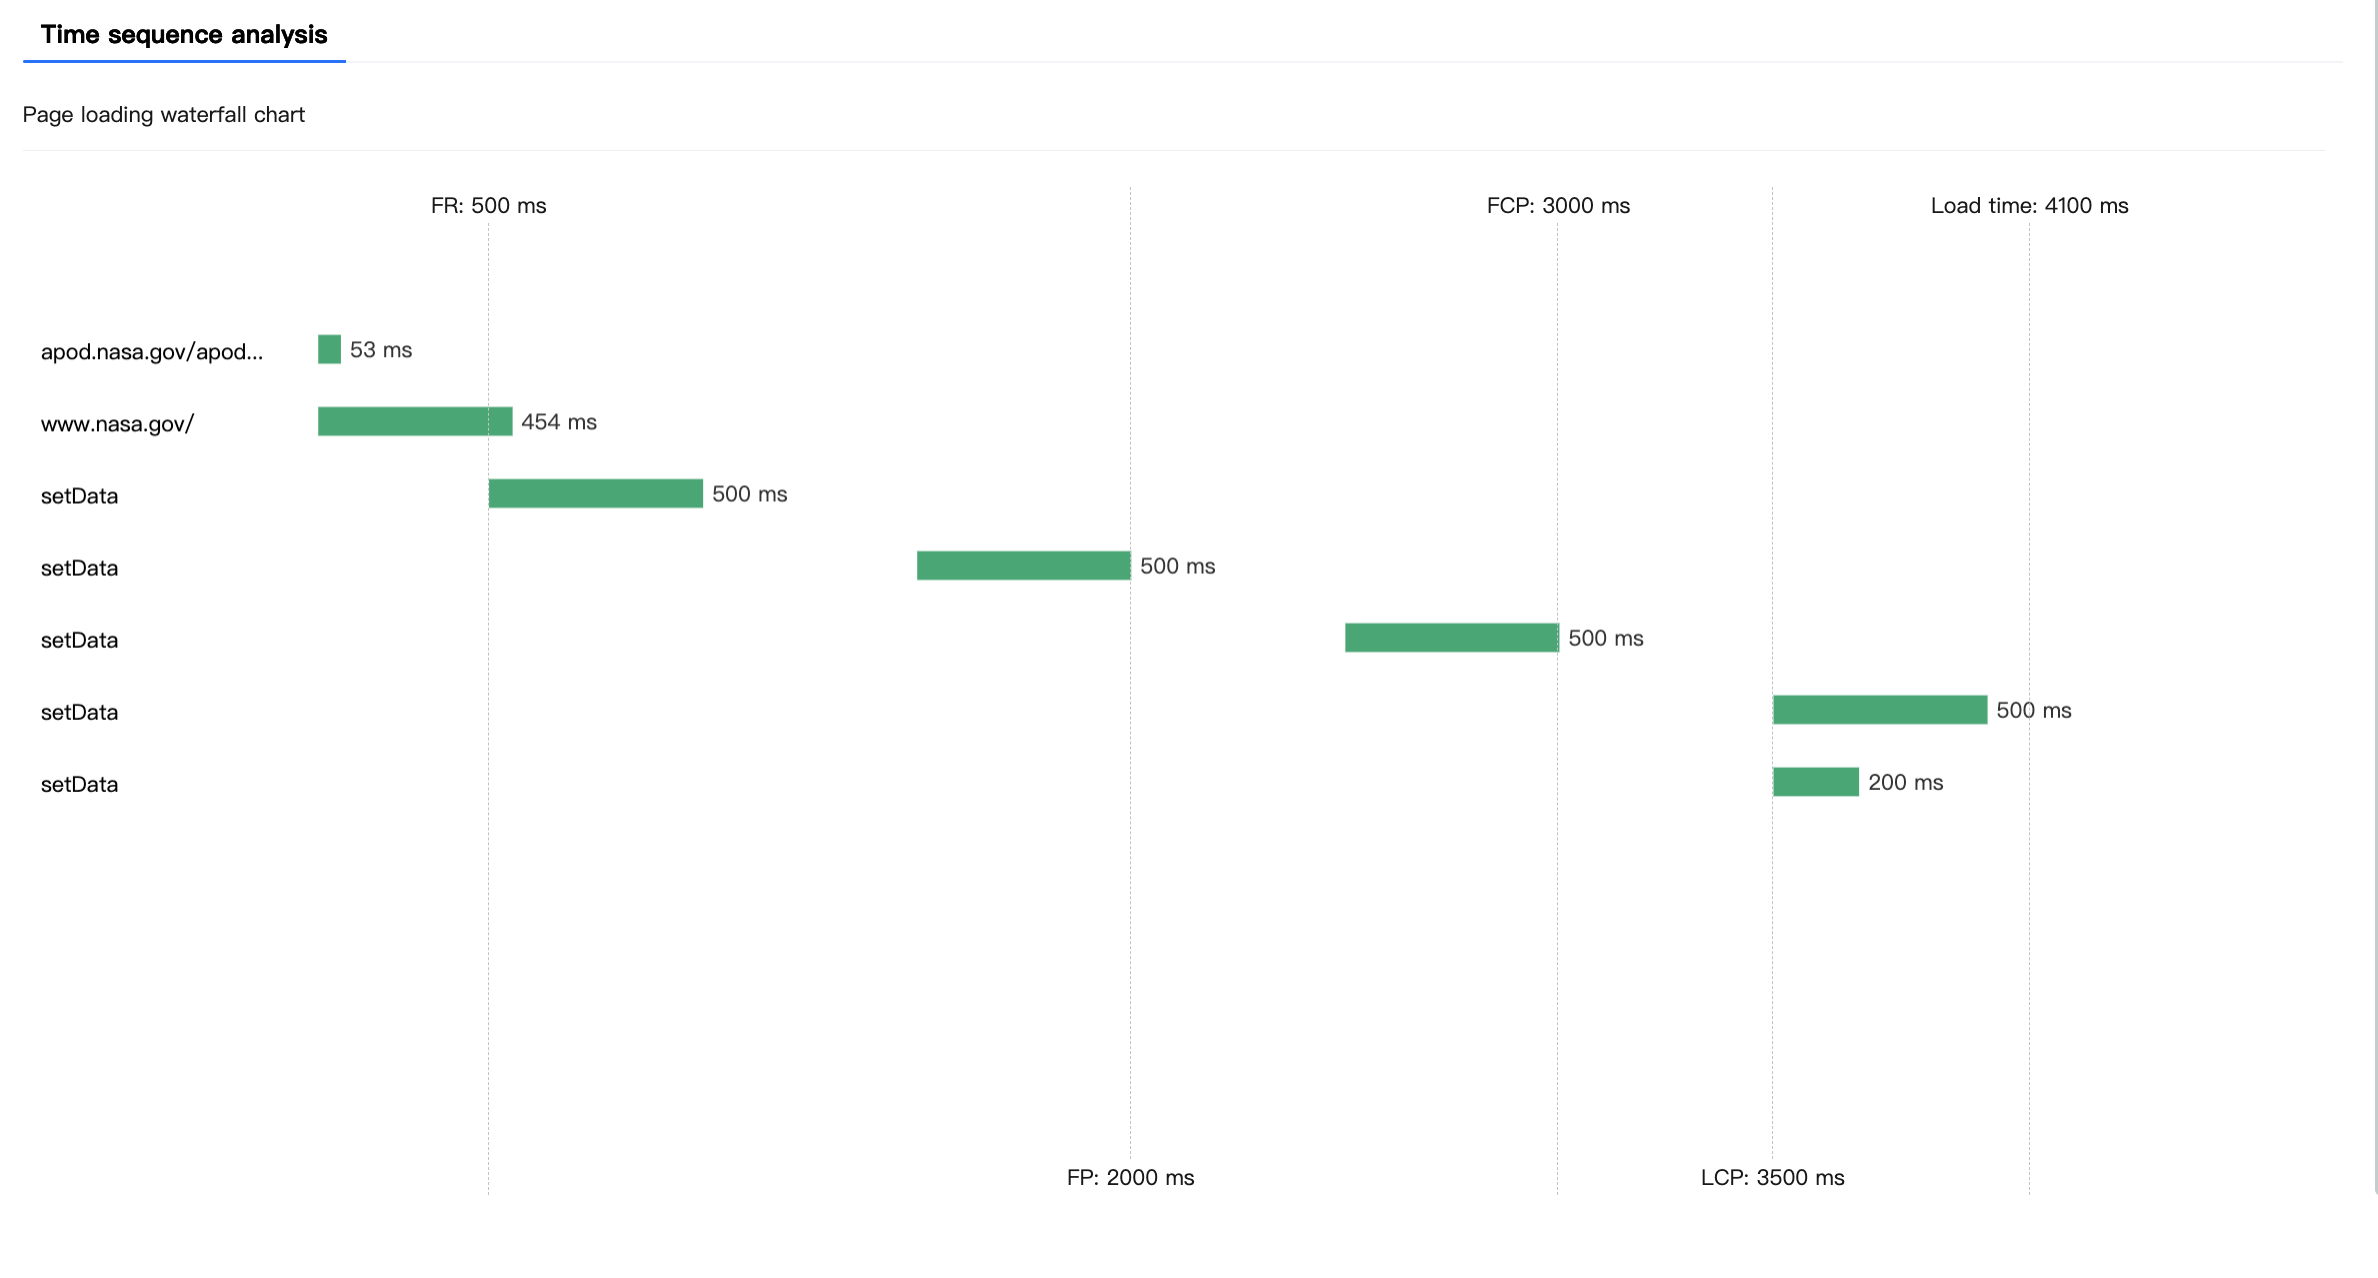
The error information module of slow page analysis provides a page switching waterfall chart, where you can view page request durations and setData durations and data sizes.
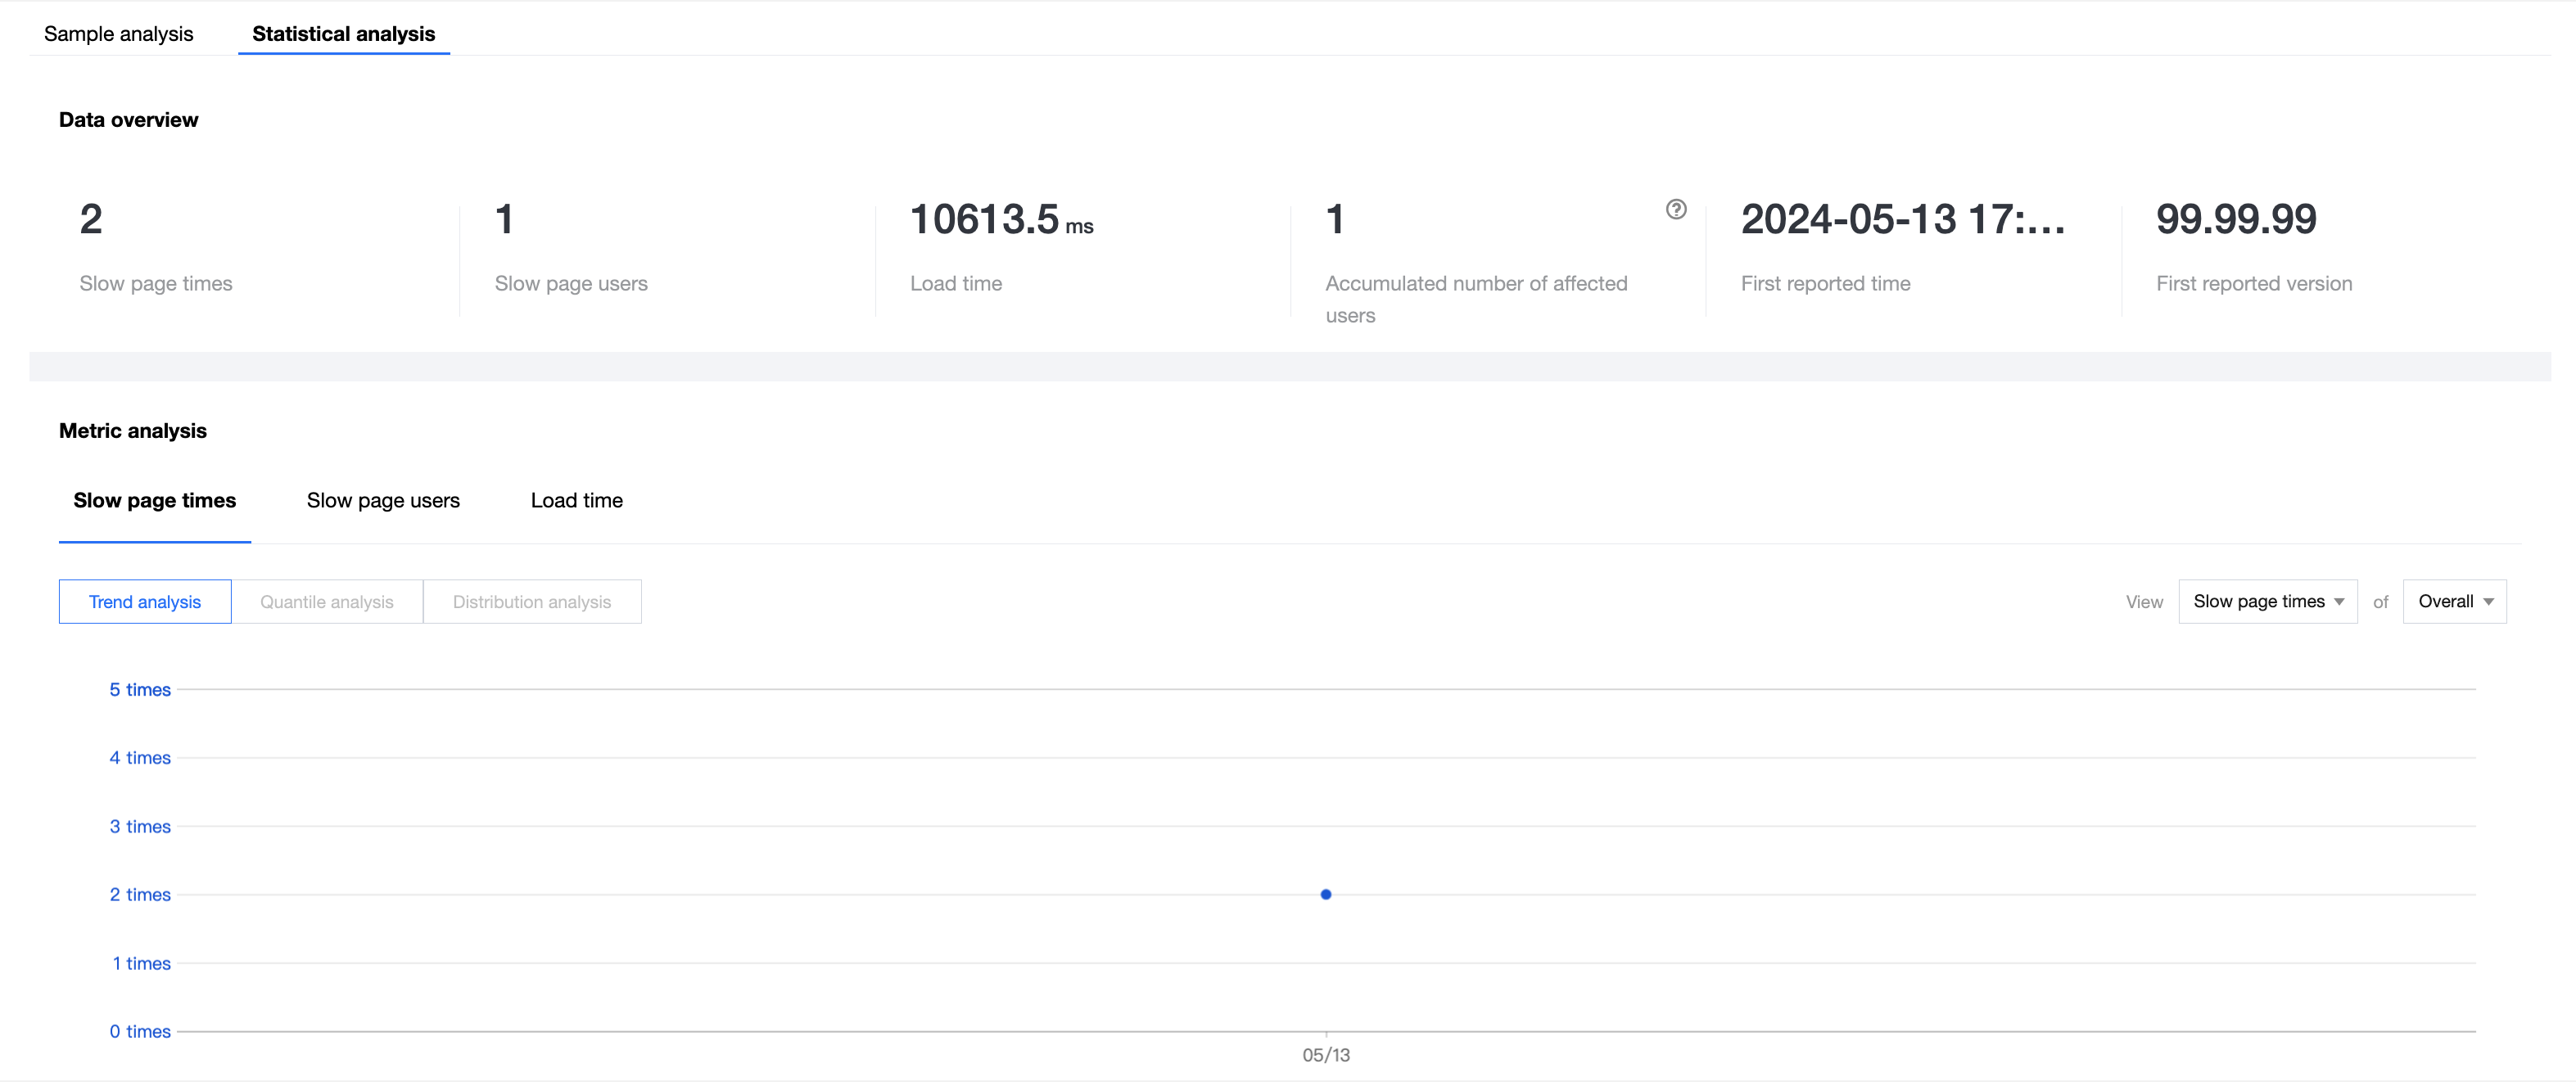
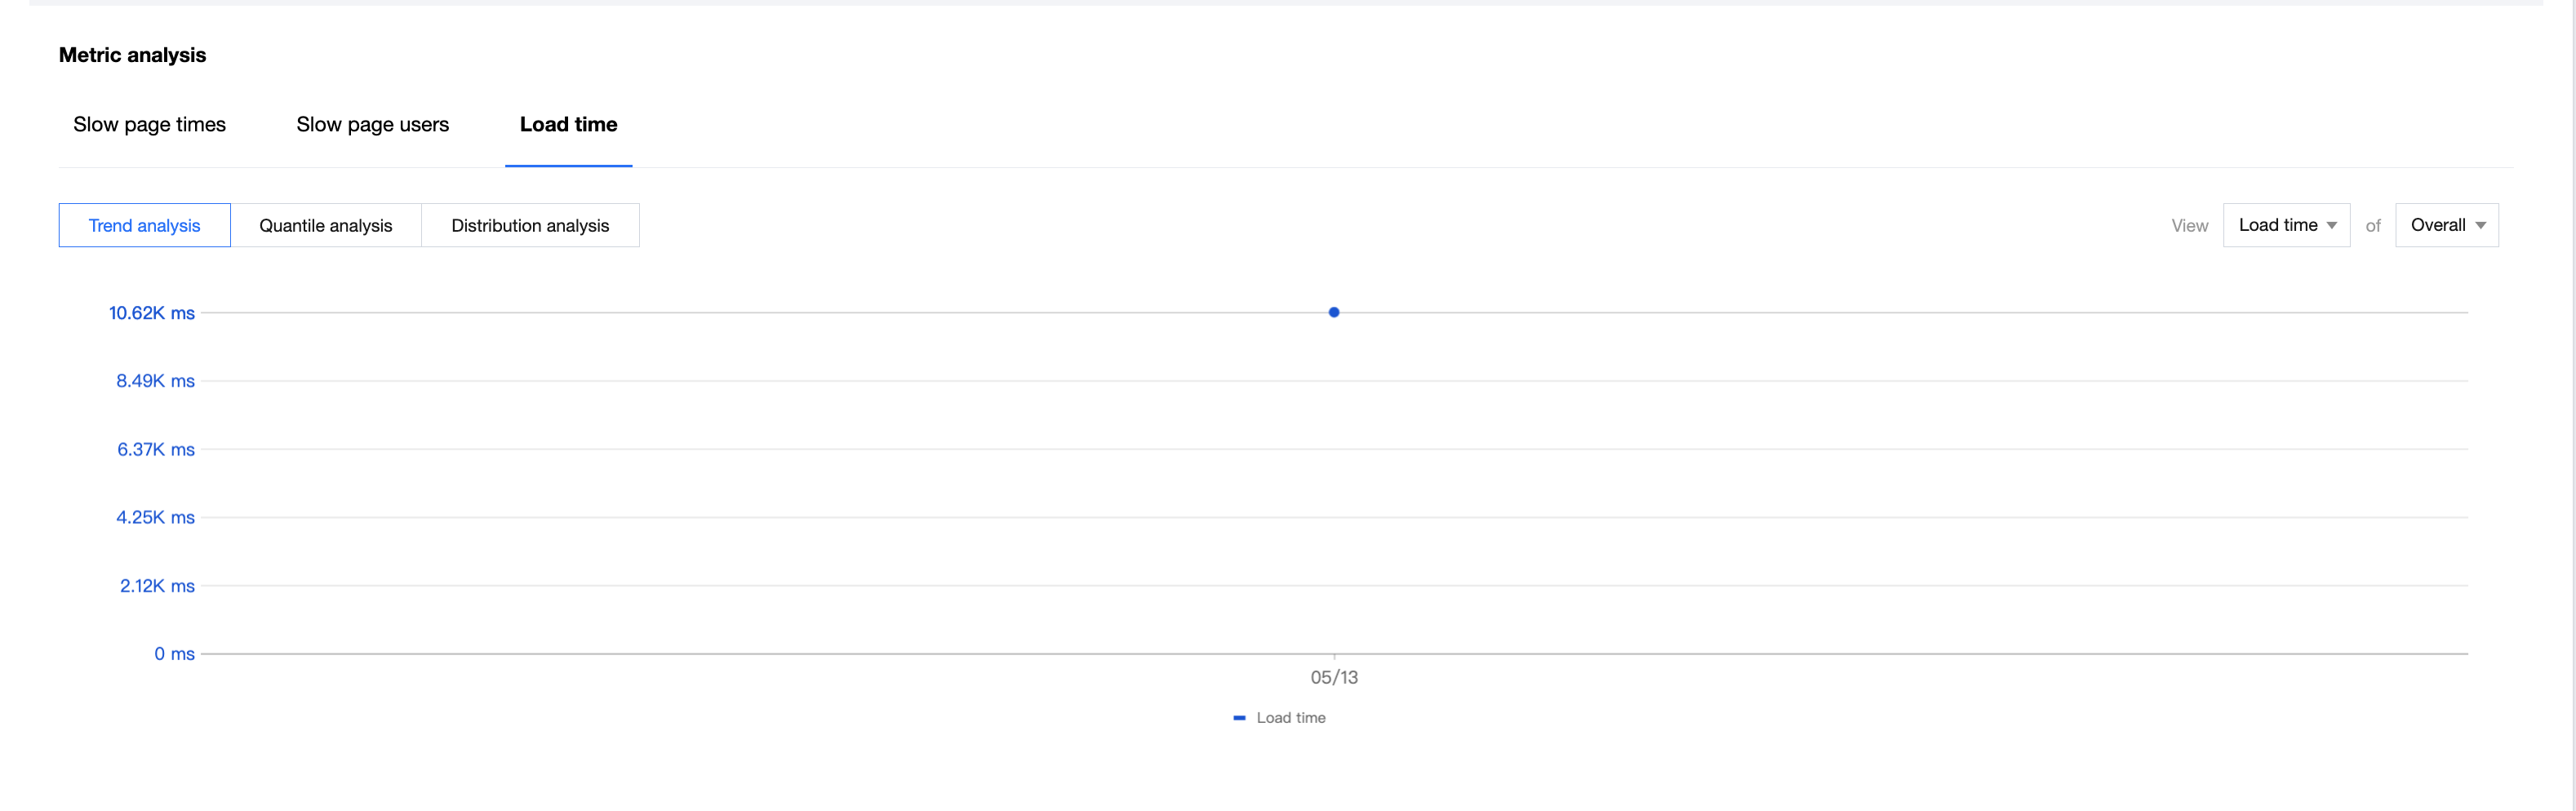
The statistical analysis capability of slow page analysis allows you to view the issue's trends of number of slow pages, number of slow page-affected users, and page switching duration. You can also use combined analysis to obtain more issue statistics.
4. Network analysis
4.1 Feature introduction
The network analysis feature analyzes slow and abnormal requests. You can switch between issues at the top for analysis.
Glossary of network analysis:
Glossary of slow requests:
Request duration:The average time taken to initiate a request by a mini program.
Calculation method: ResponseEnd - DomainLookUpStart. Calculation formula: Total request time/Number of requests
Number of slow requests: The total number of slow requests initiated by a mini program. A slow request is a request where the transmission rate is below 10 KB/s when the transmitted data is greater than 50 KB in size or where the response duration is above 2 seconds when the transmitted data is less than or equal to 50 KB in size.
Ratio of slow requests: The ratio of slow requests to all requests initiated by a mini program.
Calculation formula: Number of slow requests/Total number of requests
Number of requests: The total number of HTTP requests initiated by a mini program.
Slow request-affected users: The total number of users affected by slow requests (deduplicated).
Ratio of slow request-affected users: The ratio of users affected by slow requests to all users who initiated requests.
Calculation formula: Number of slow request-affected users/Total number of users
Number of users:The total number of users who initiated requests to a mini program (deduplicated).
Glossary of abnormal requests:
Number of error requests: The total number of requests whose status code is greater than or equal to 400.
Ratio of error requests: The ratio of error requests to all requests initiated by a mini program.
Calculation formula: Total number of error requests/Total number of requests
Number of requests: The total number of requests initiated by a mini program.
Error request-affected users: The total number of users affected by error requests (deduplicated).
Ratio of error request-affected users: The ratio of users affected by error requests to all users who initiated requests.
Calculation formula: Total number of error-affected users/Total number of users
Number of users: The total number of users who initiated requests to a mini program (deduplicated).
4.2 Feature description
4.2.1 Slow request analysis
By default, QAPM displays only successful requests in slow request analysis. This limit can be removed in the global filter.
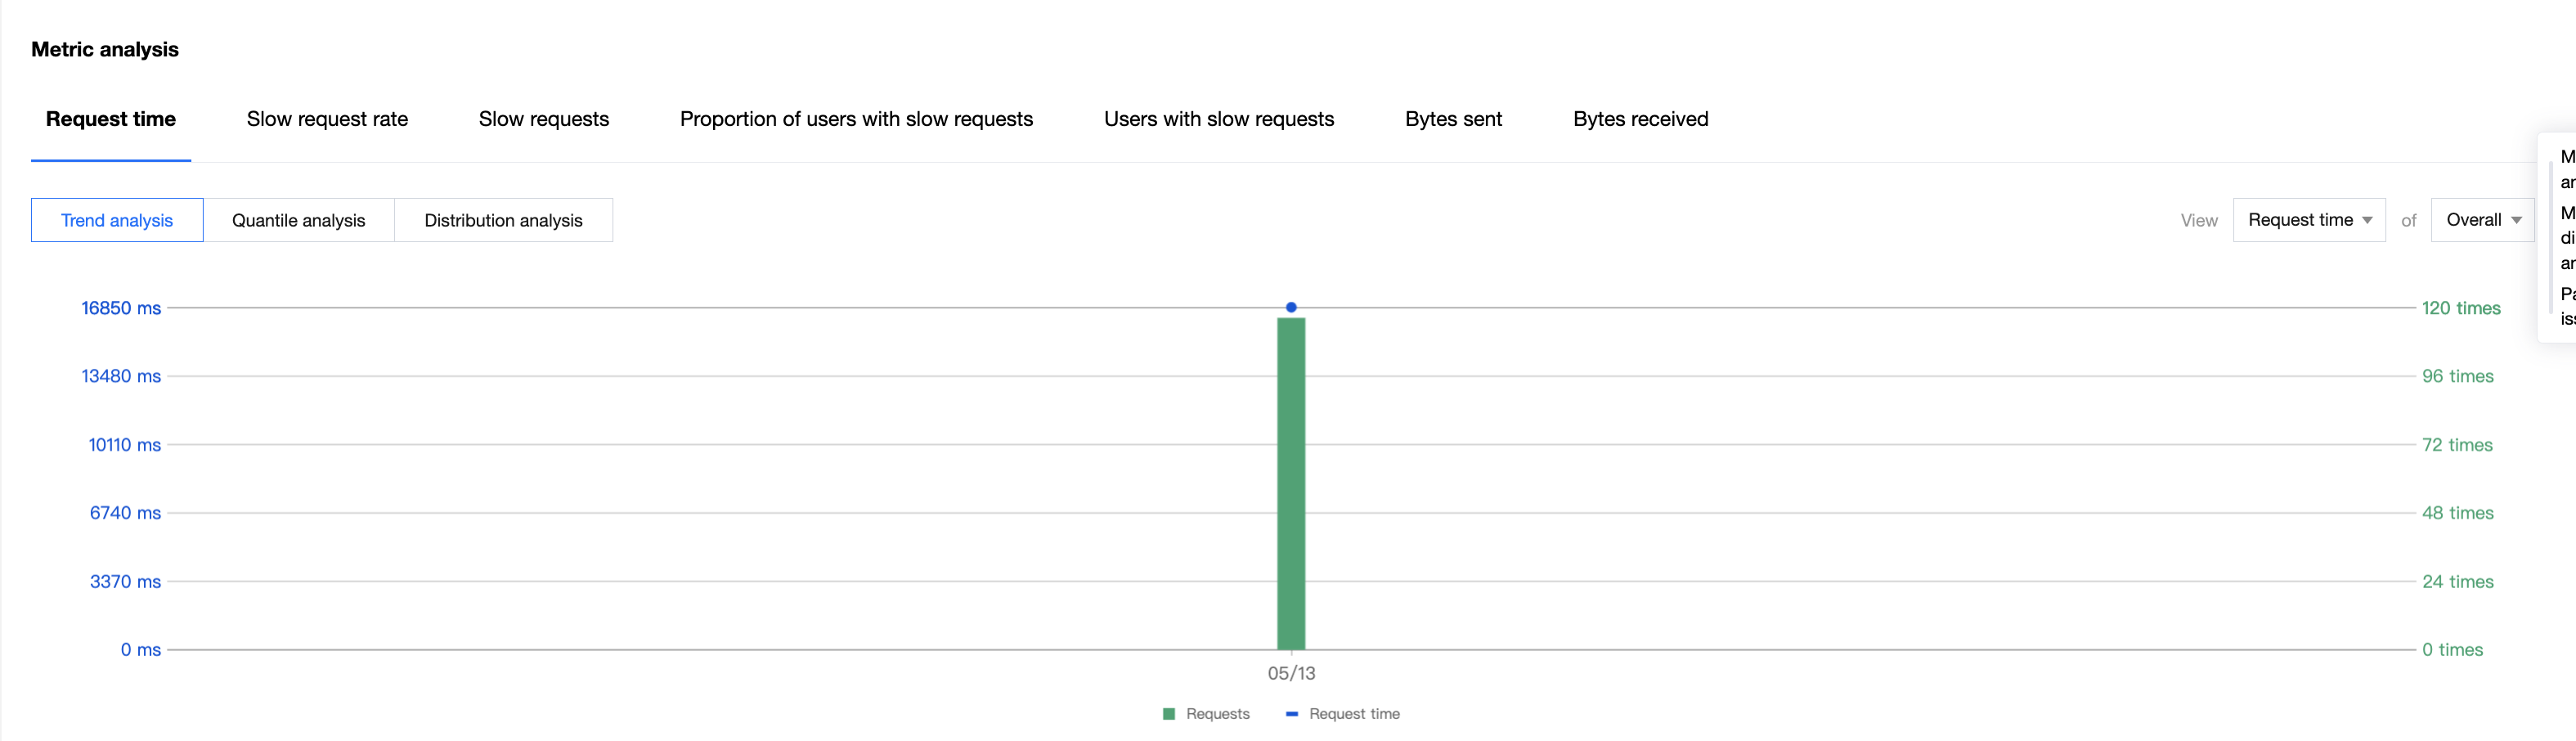
4.2.1.1 Trend analysis
Trend analysis supports the dimensions of request duration, ratio of slow requests, number of slow requests, ratio of slow request-affected users, number of slow request-affected users, number of bytes sent, and number of bytes received. It helps you understand network request conditions at different time points.
4.2.1.2 Combined analysis
The combined analysis of slow requests provides combined analysis capabilities in the dimensions of the mini program version, platform app version, system, system version, and device type. You can view the changes of top 7, 10, and 20 metrics in the selected dimensions and order.
4.2.1.3 Percentile analysis
Percentile analysis displays the percentile and average values of request duration, number of bytes sent, and number of bytes received for the selected filter. Percentile values help you comprehensively understand the layered trends of the sample data and locate the cause of abnormal fluctuations.
4.2.1.4 Distribution analysis
When you view the request duration, the distribution analysis feature divides the request duration into multiple segments based on a fixed increment of 100 ms by default. When you view the number of requested bytes and the number of received bytes, the distribution analysis feature divides the data into multiple segments based on a fixed increment of 10 bytes and 10 KB respectively by default. Distribution analysis allows you to observe the distribution of the overall network request data in the effective value range to help make a performance optimization plan, and it can provide clear evidence before and after optimization to help evaluate the optimization effect.
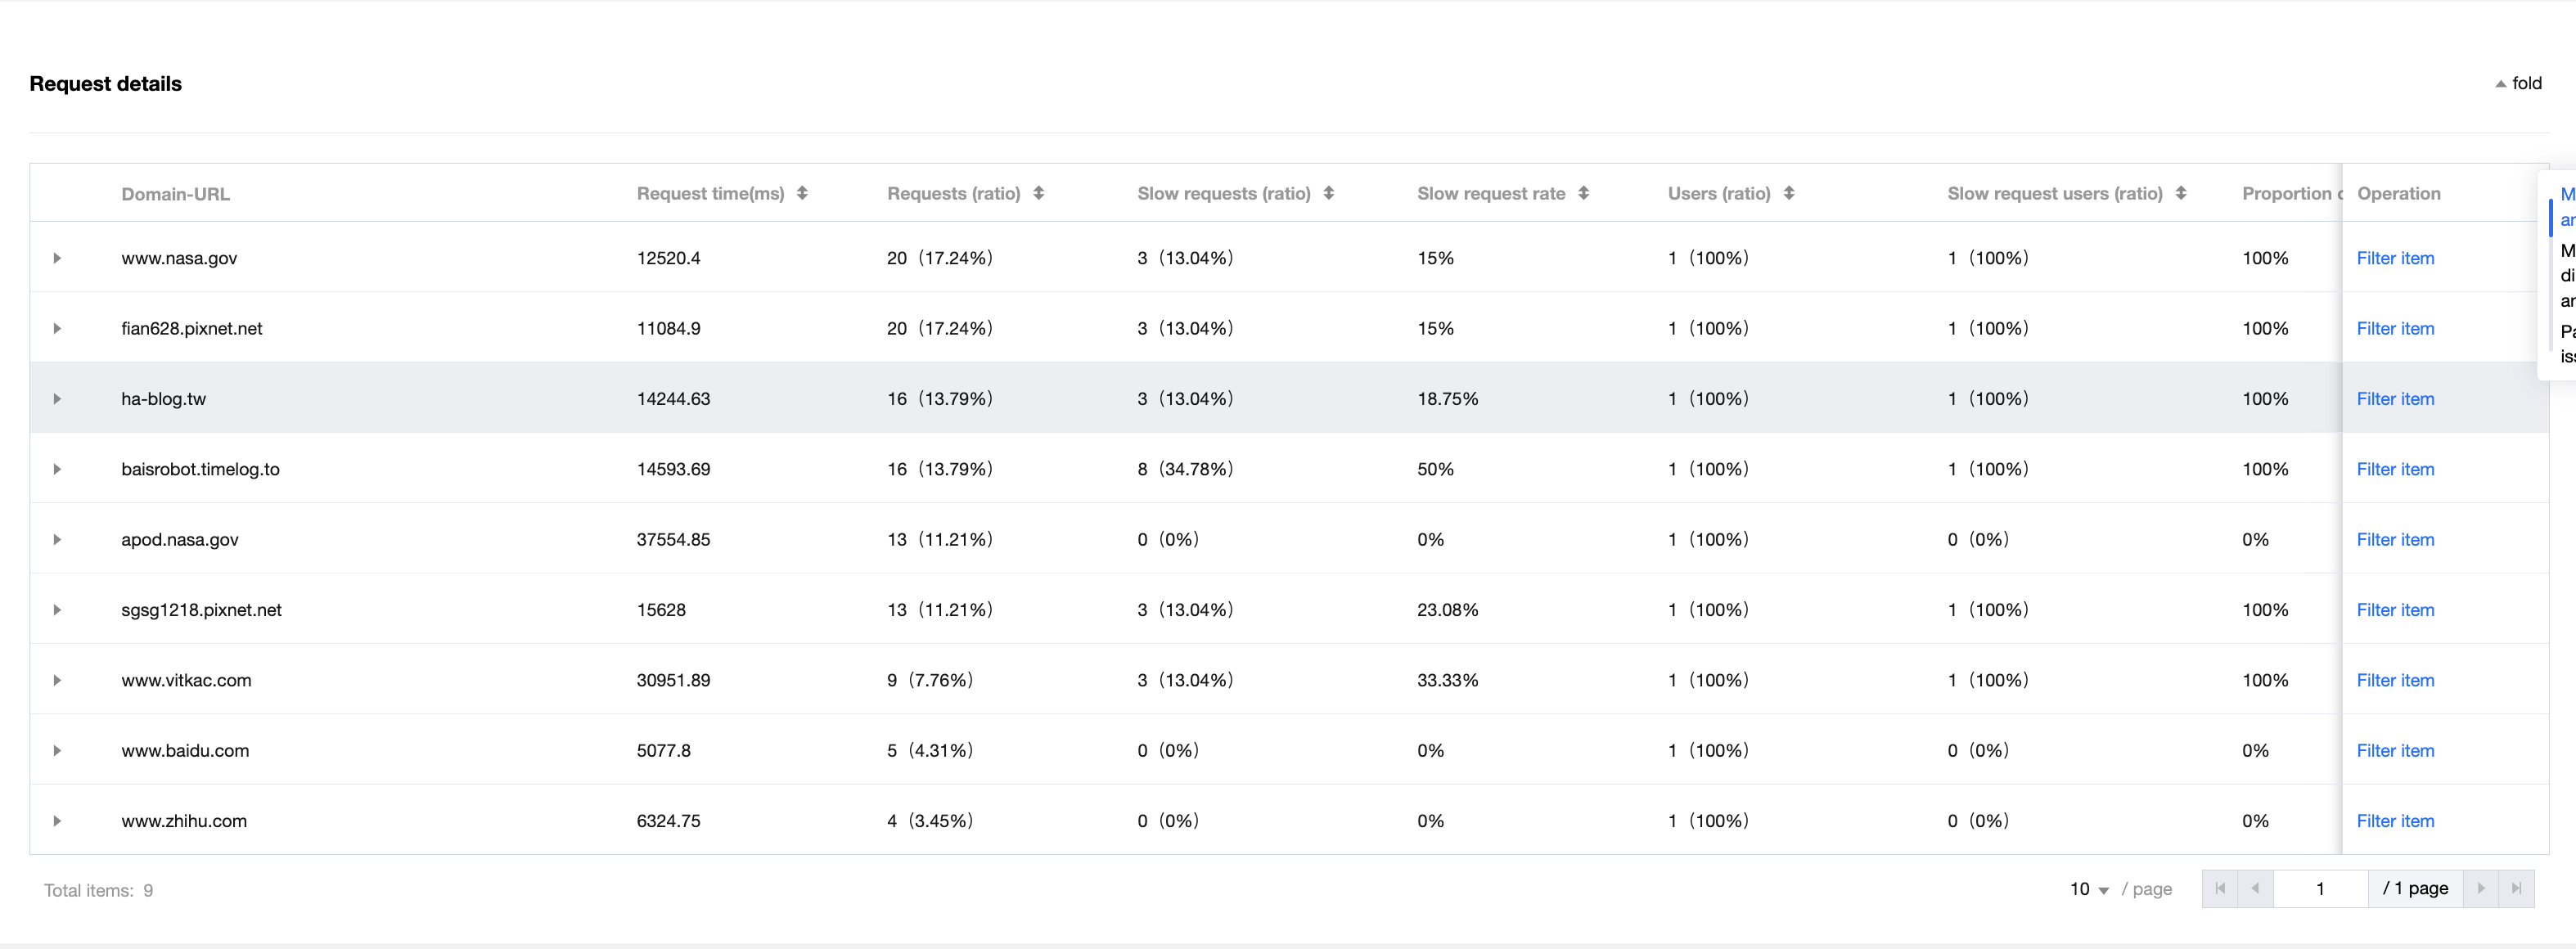
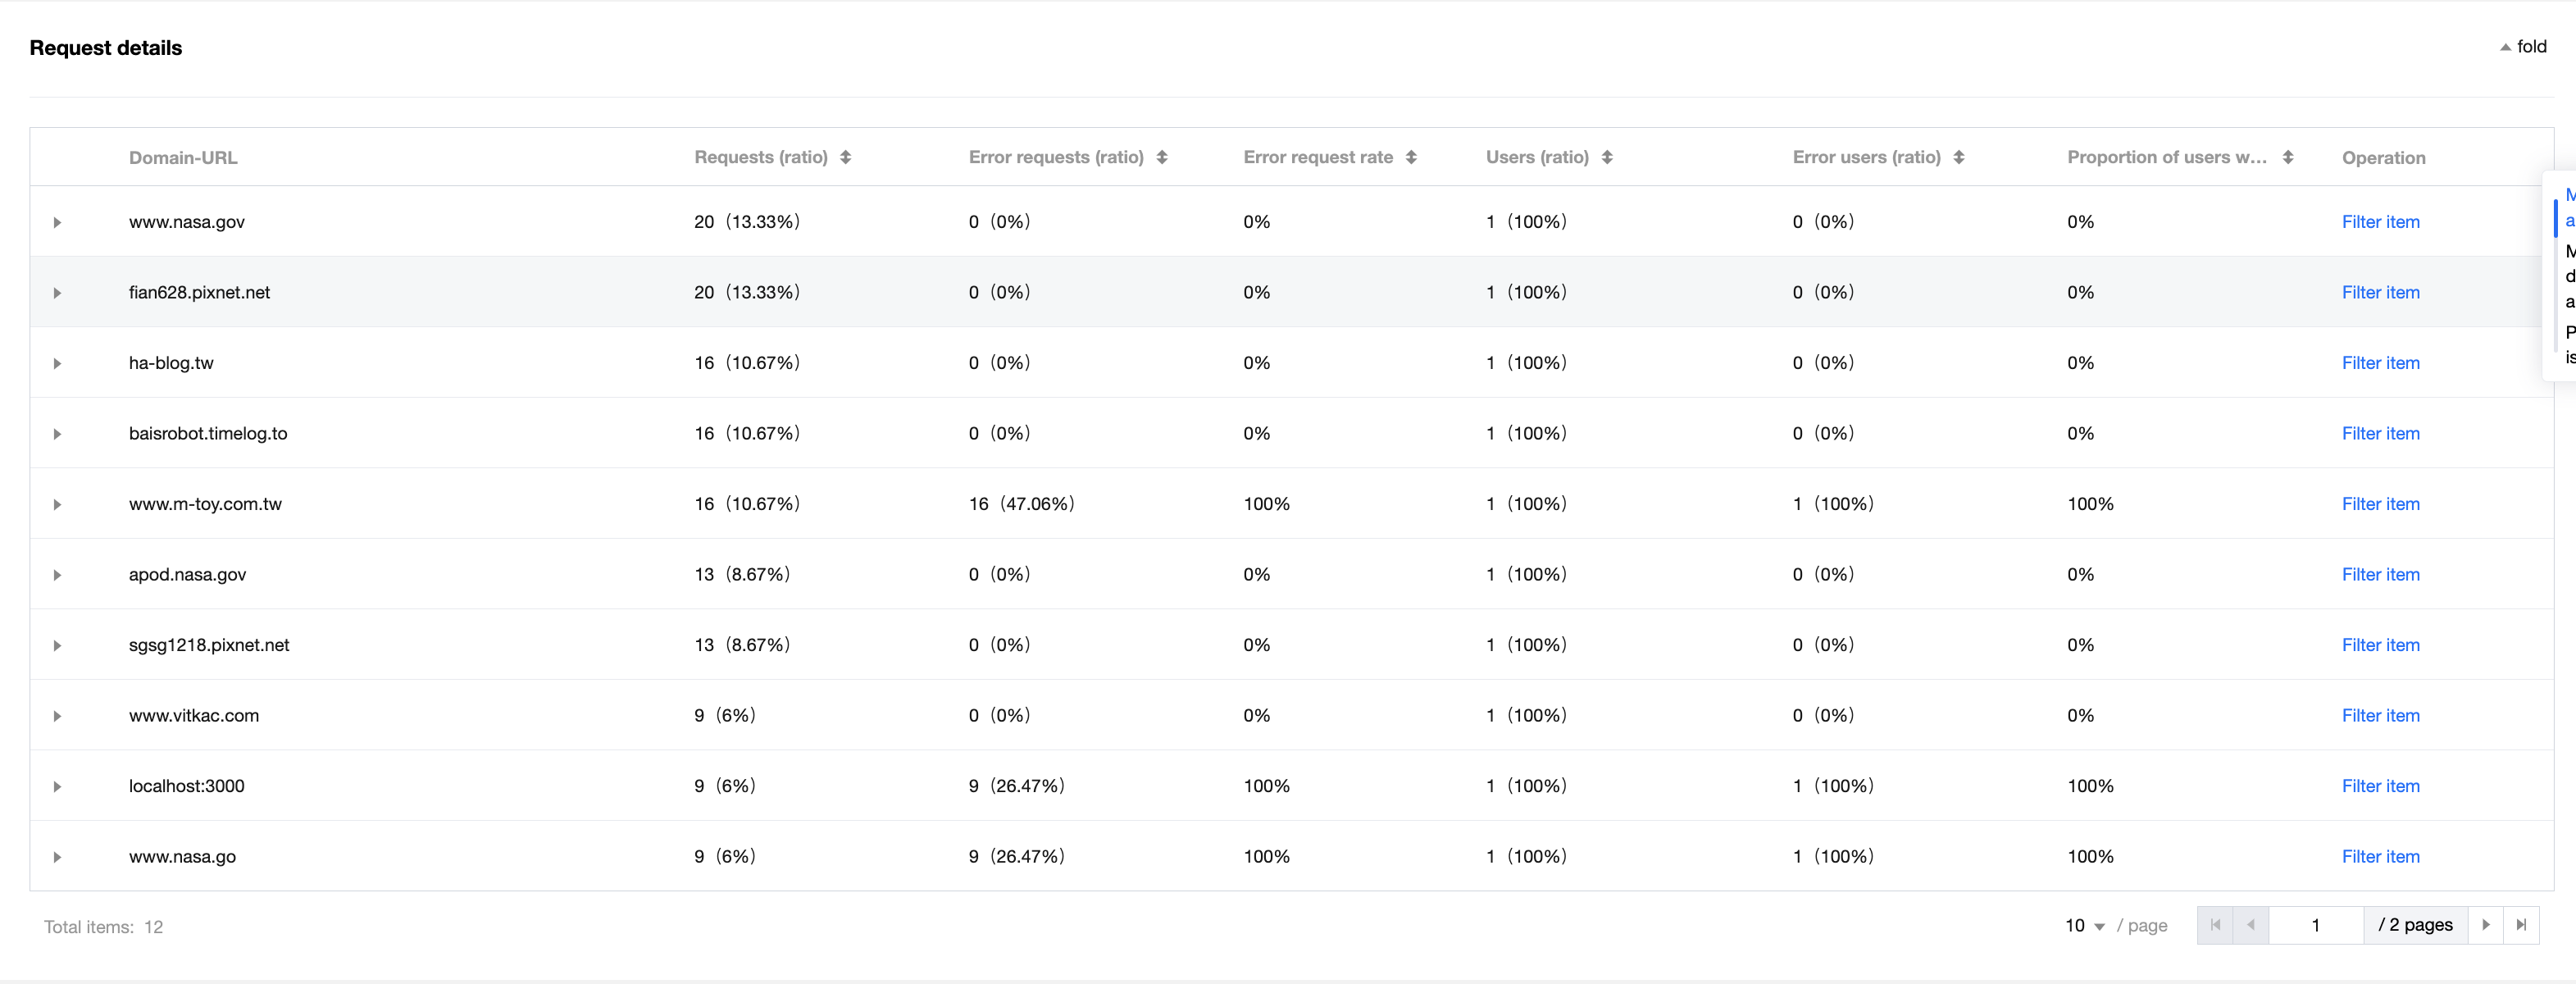
4.2.1.5 Request details
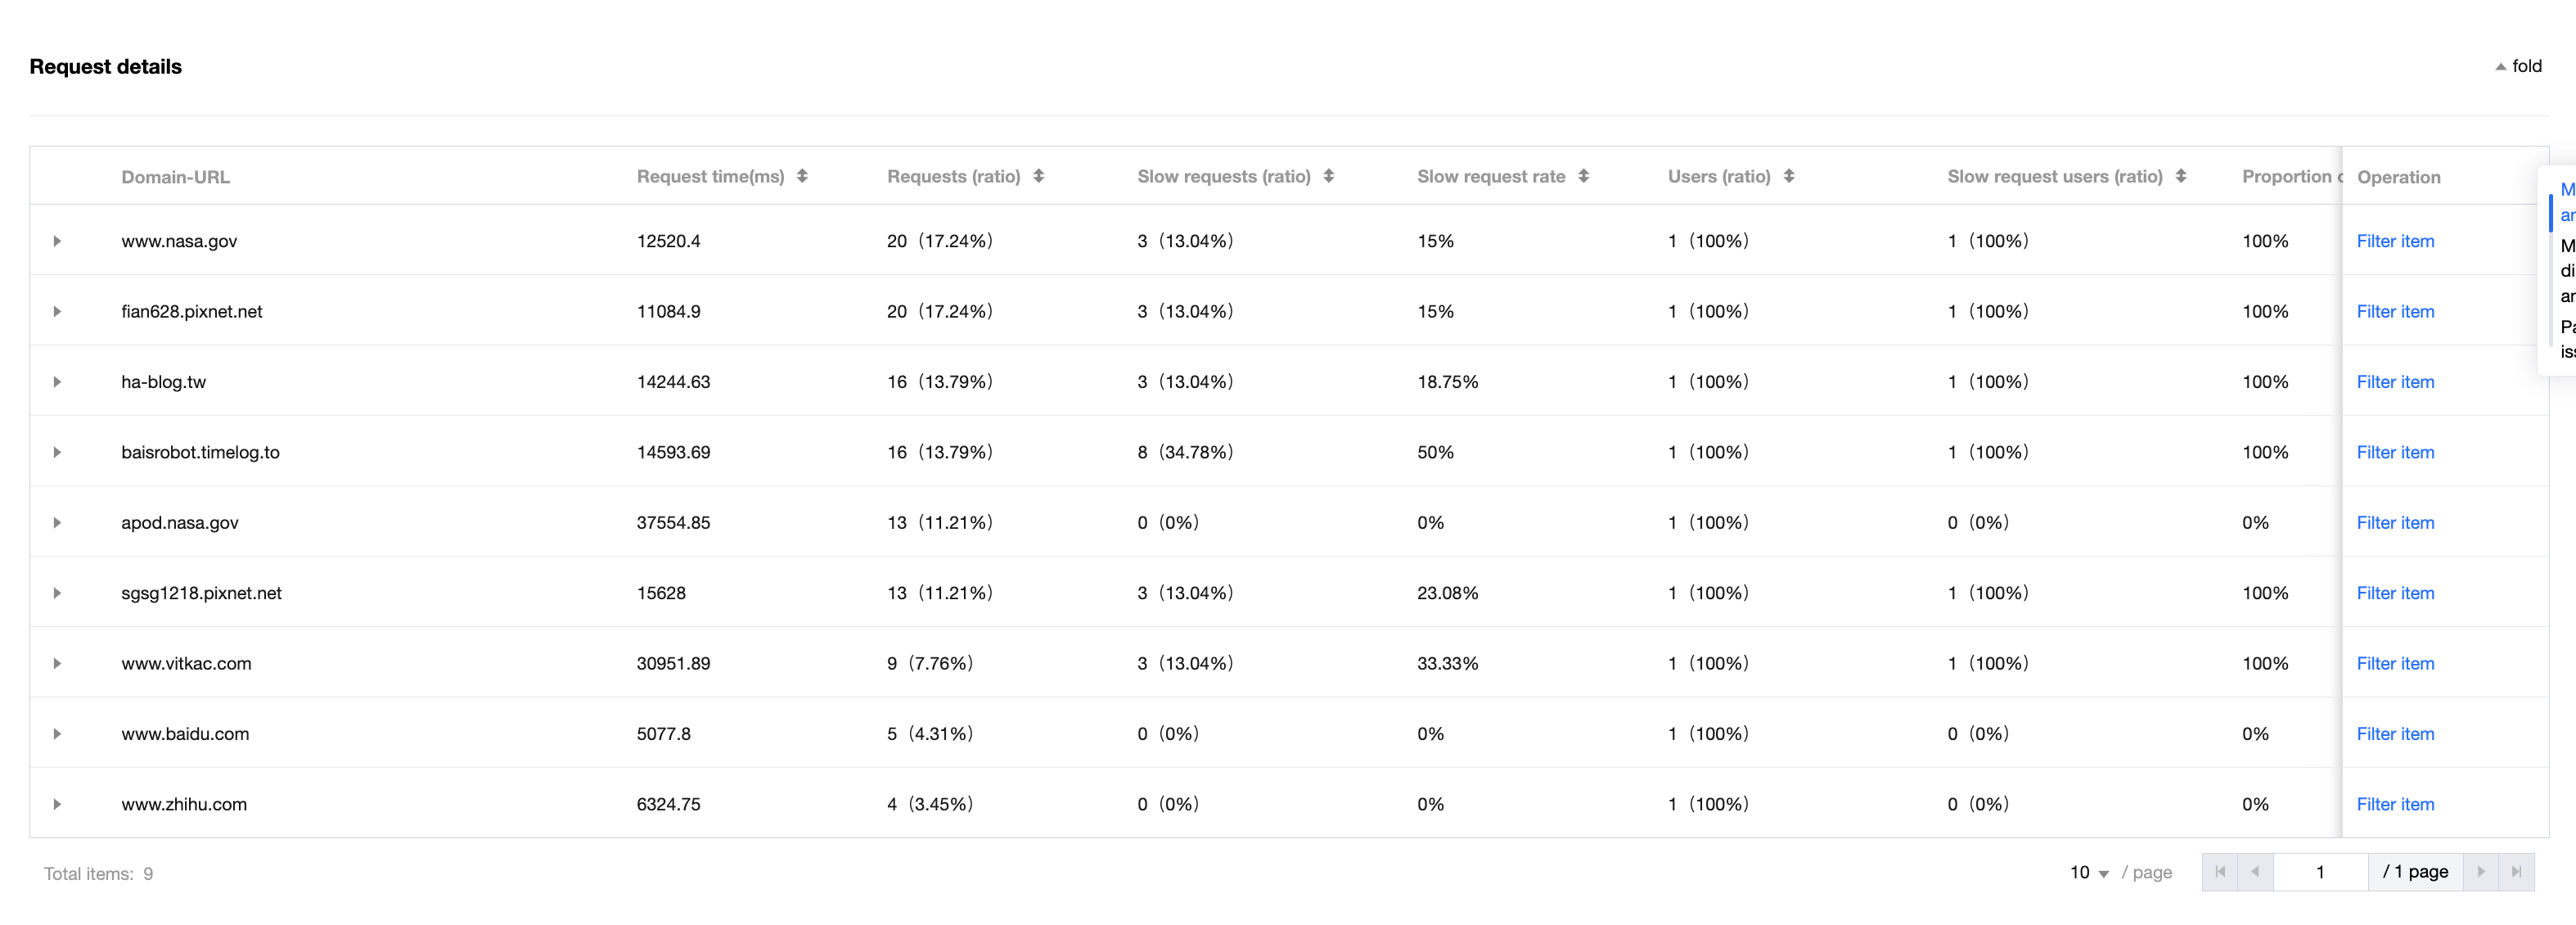
In request details, you can view the data of each domain, such as request duration, number of requests, number of slow requests, ratio of slow requests, number of users, number of slow request-affected users, ratio of slow request-affected users, number of bytes sent, and number of bytes received. You can sort the data by metric in ascending or descending order. You can click "Filter" in the "Operation" column to quickly set a scenario as a filter item. You can also click to view the metric data of a specific URL under the corresponding domain.
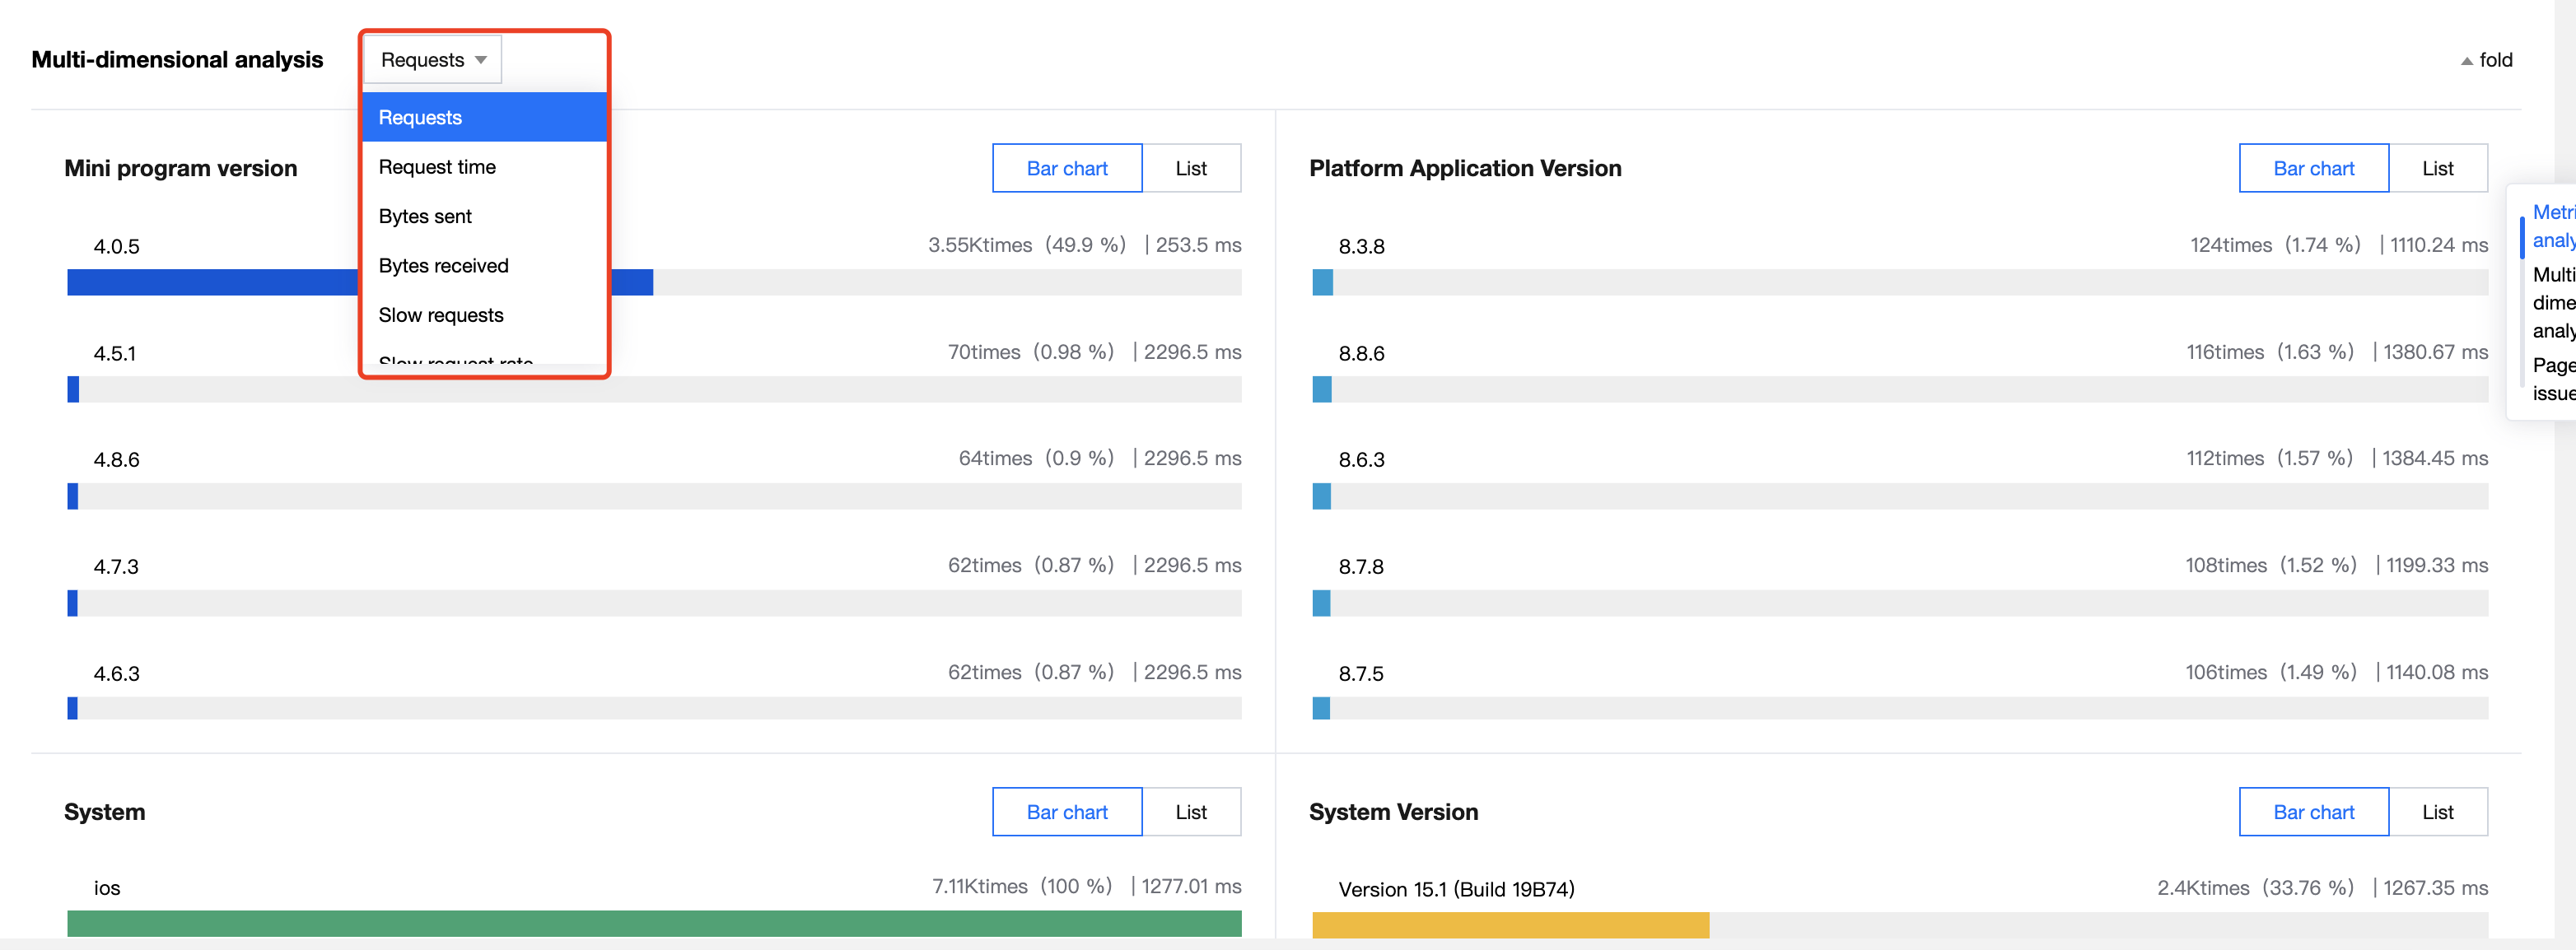
4.2.1.6 Multidimensional analysis
Slow request multidimensional analysis allows you to view data of the following metrics in different dimensions: request duration, number of successful requests, number of slow requests, number of successful request users, number of slow request users, number of sent bytes, and number of received bytes.
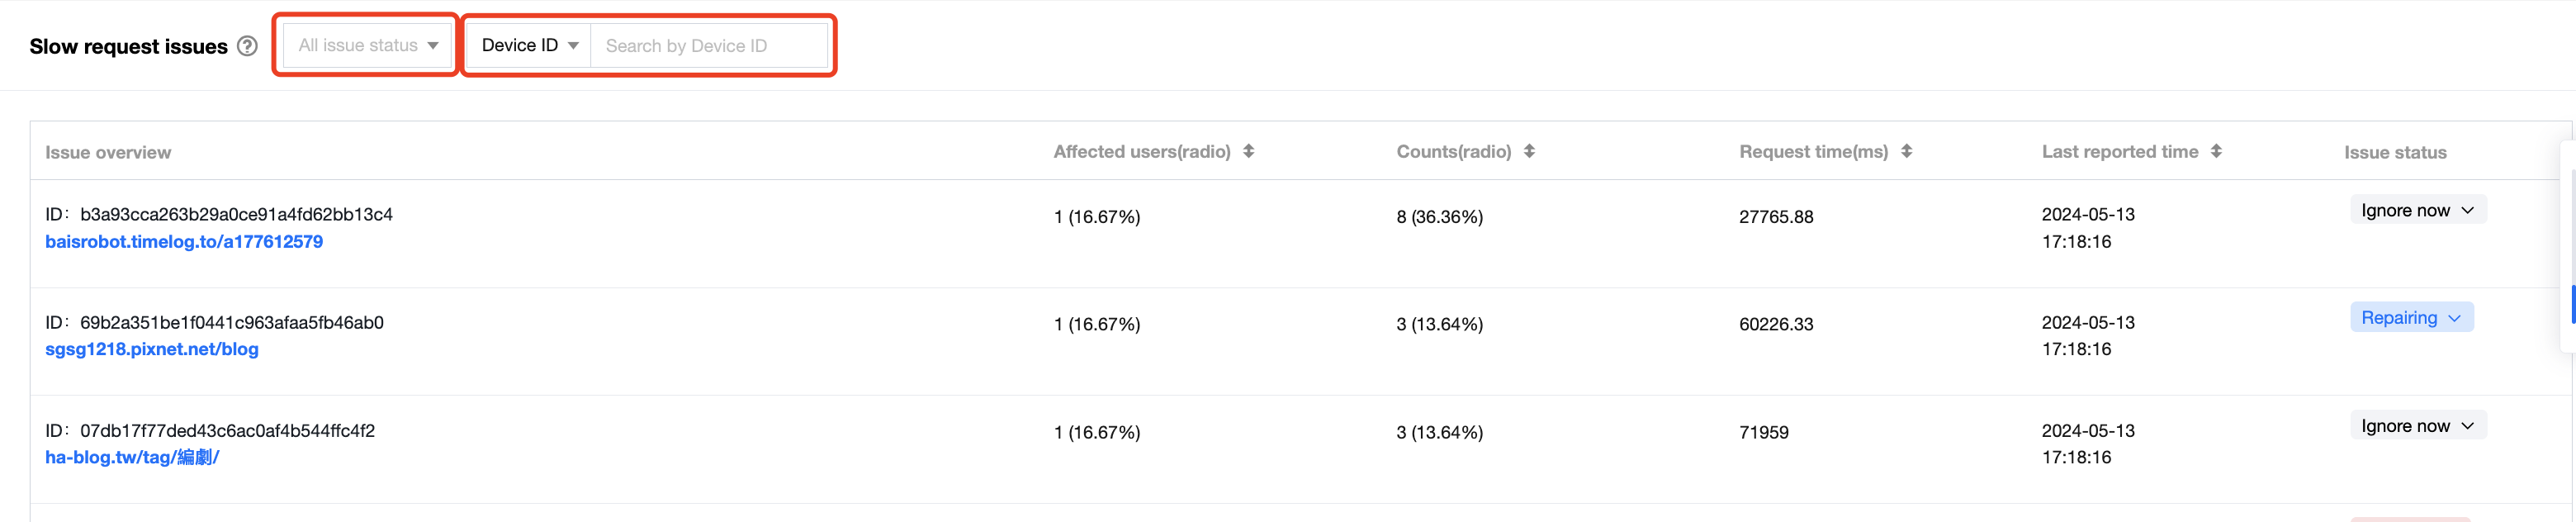
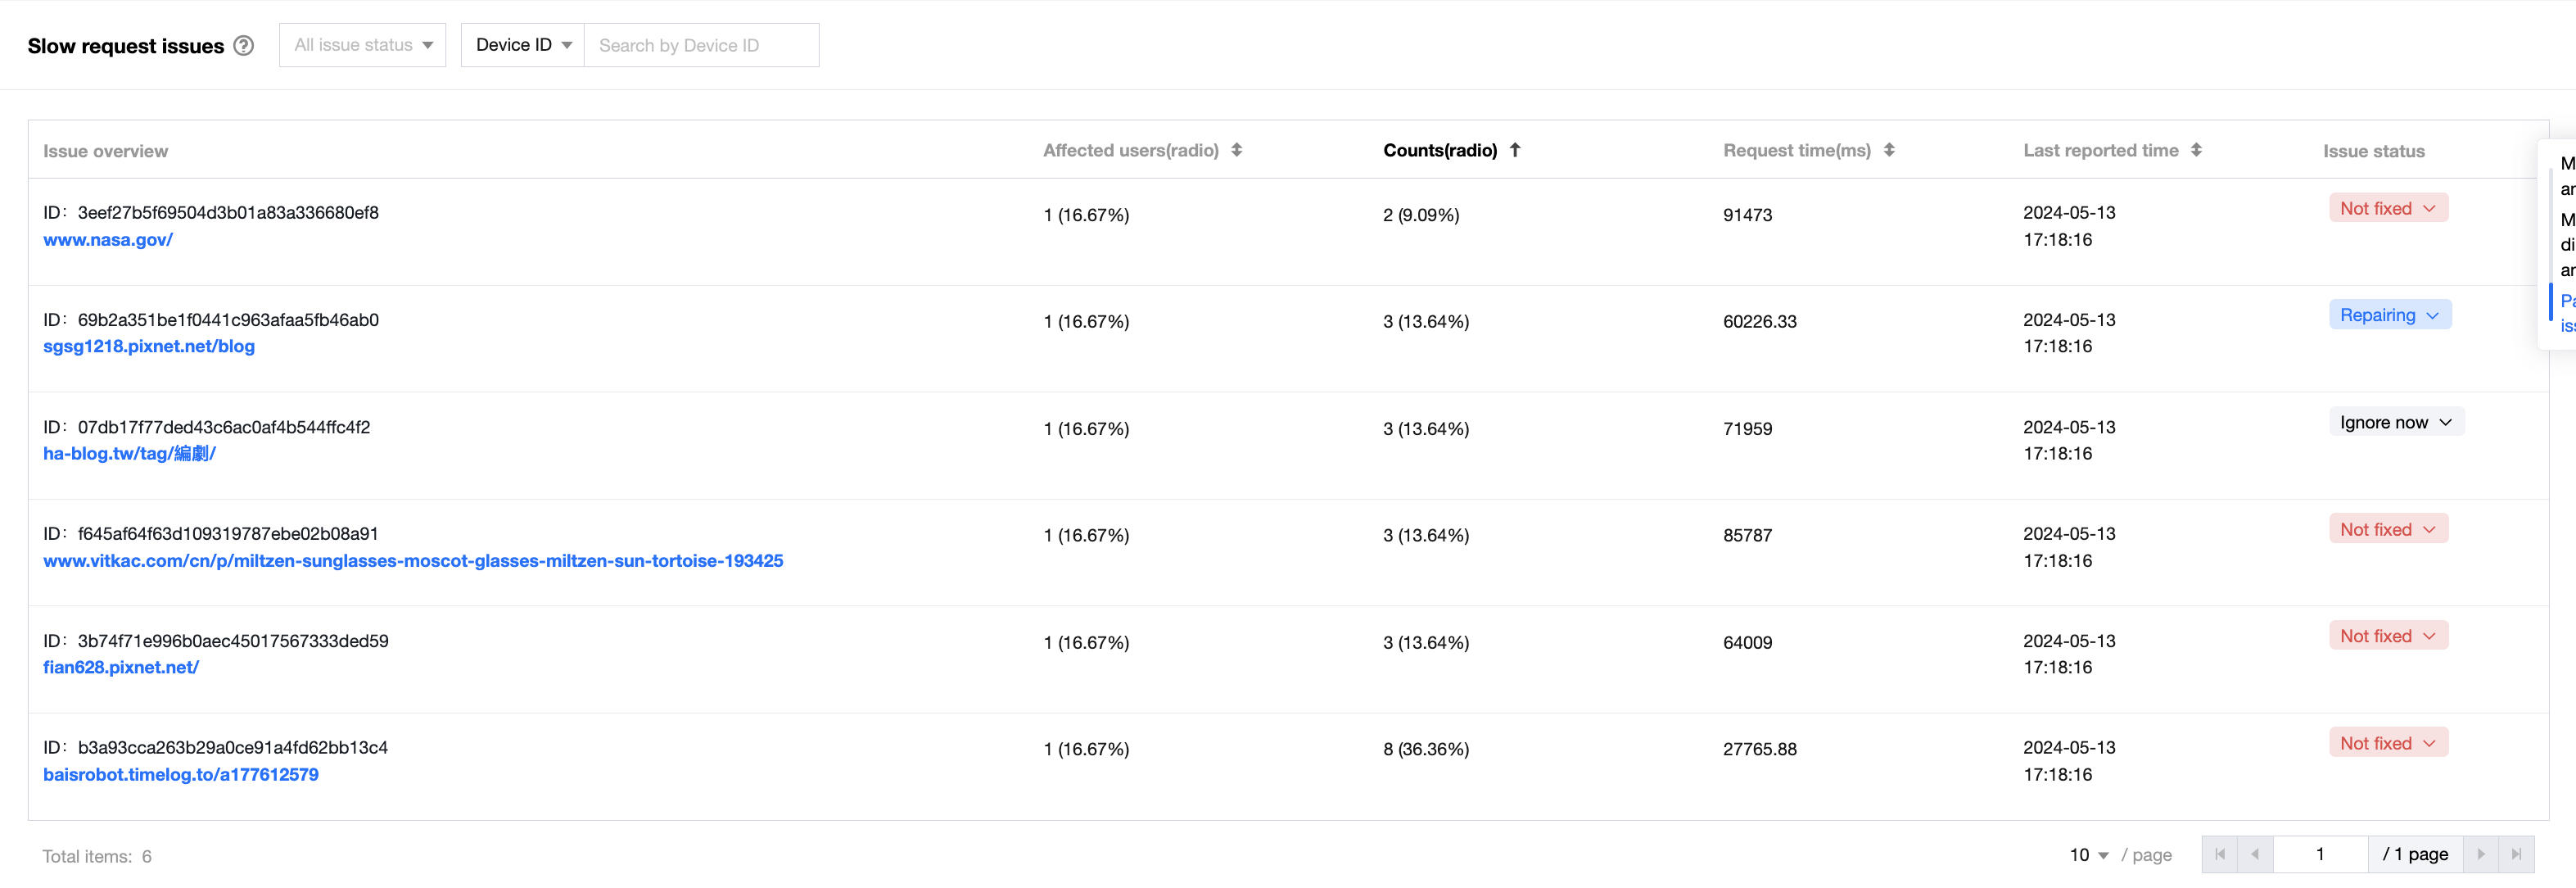
4.2.1.7 Issue list
A slow request is a request where the transfer rate is below 10 KB/s when the transferred data is greater than 50 KB in size or where the response duration is above 2 seconds when the transferred data is not greater than 50 KB in size. When an HTTP request meets the above condition, QAPM will identify it as a slow request and collect its data for reporting. It will also aggregate similar issues with the same characteristics based on Tencent's performance optimization experience.
In the list of slow requests, you can set the issue status, device ID, user ID, or issue ID as a filter, which takes effect only for the list.
The issue list also allows you to sort data by the number of slow request-affected users, number of slow requests, request duration, or last report time. The list of slow request issues displays the maximum duration of a slow request.
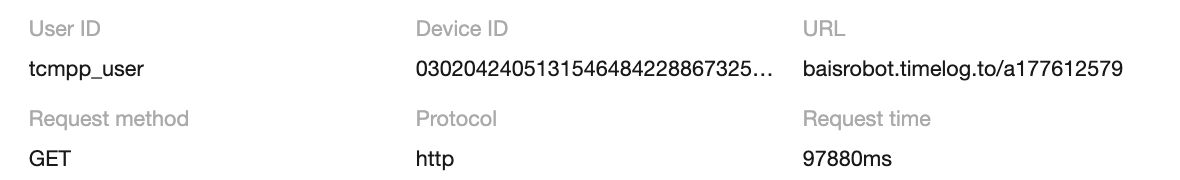
4.2.1.8 Issue details
On the issue details page, you can view the different sample data of a slow request and click a sample in the sample list to switch between samples. You can also filter samples by prioritized dimension.
Slow request issue details include the request and response information of each slow request.
As the request and response information may contain user information, QAPM reports the following headers by default (case-insensitive): "Age", "Allow", "Accept-CH", "Accept-CH-Lifetime", "Cache-Control", "Connection", "", "Content-Encoding"
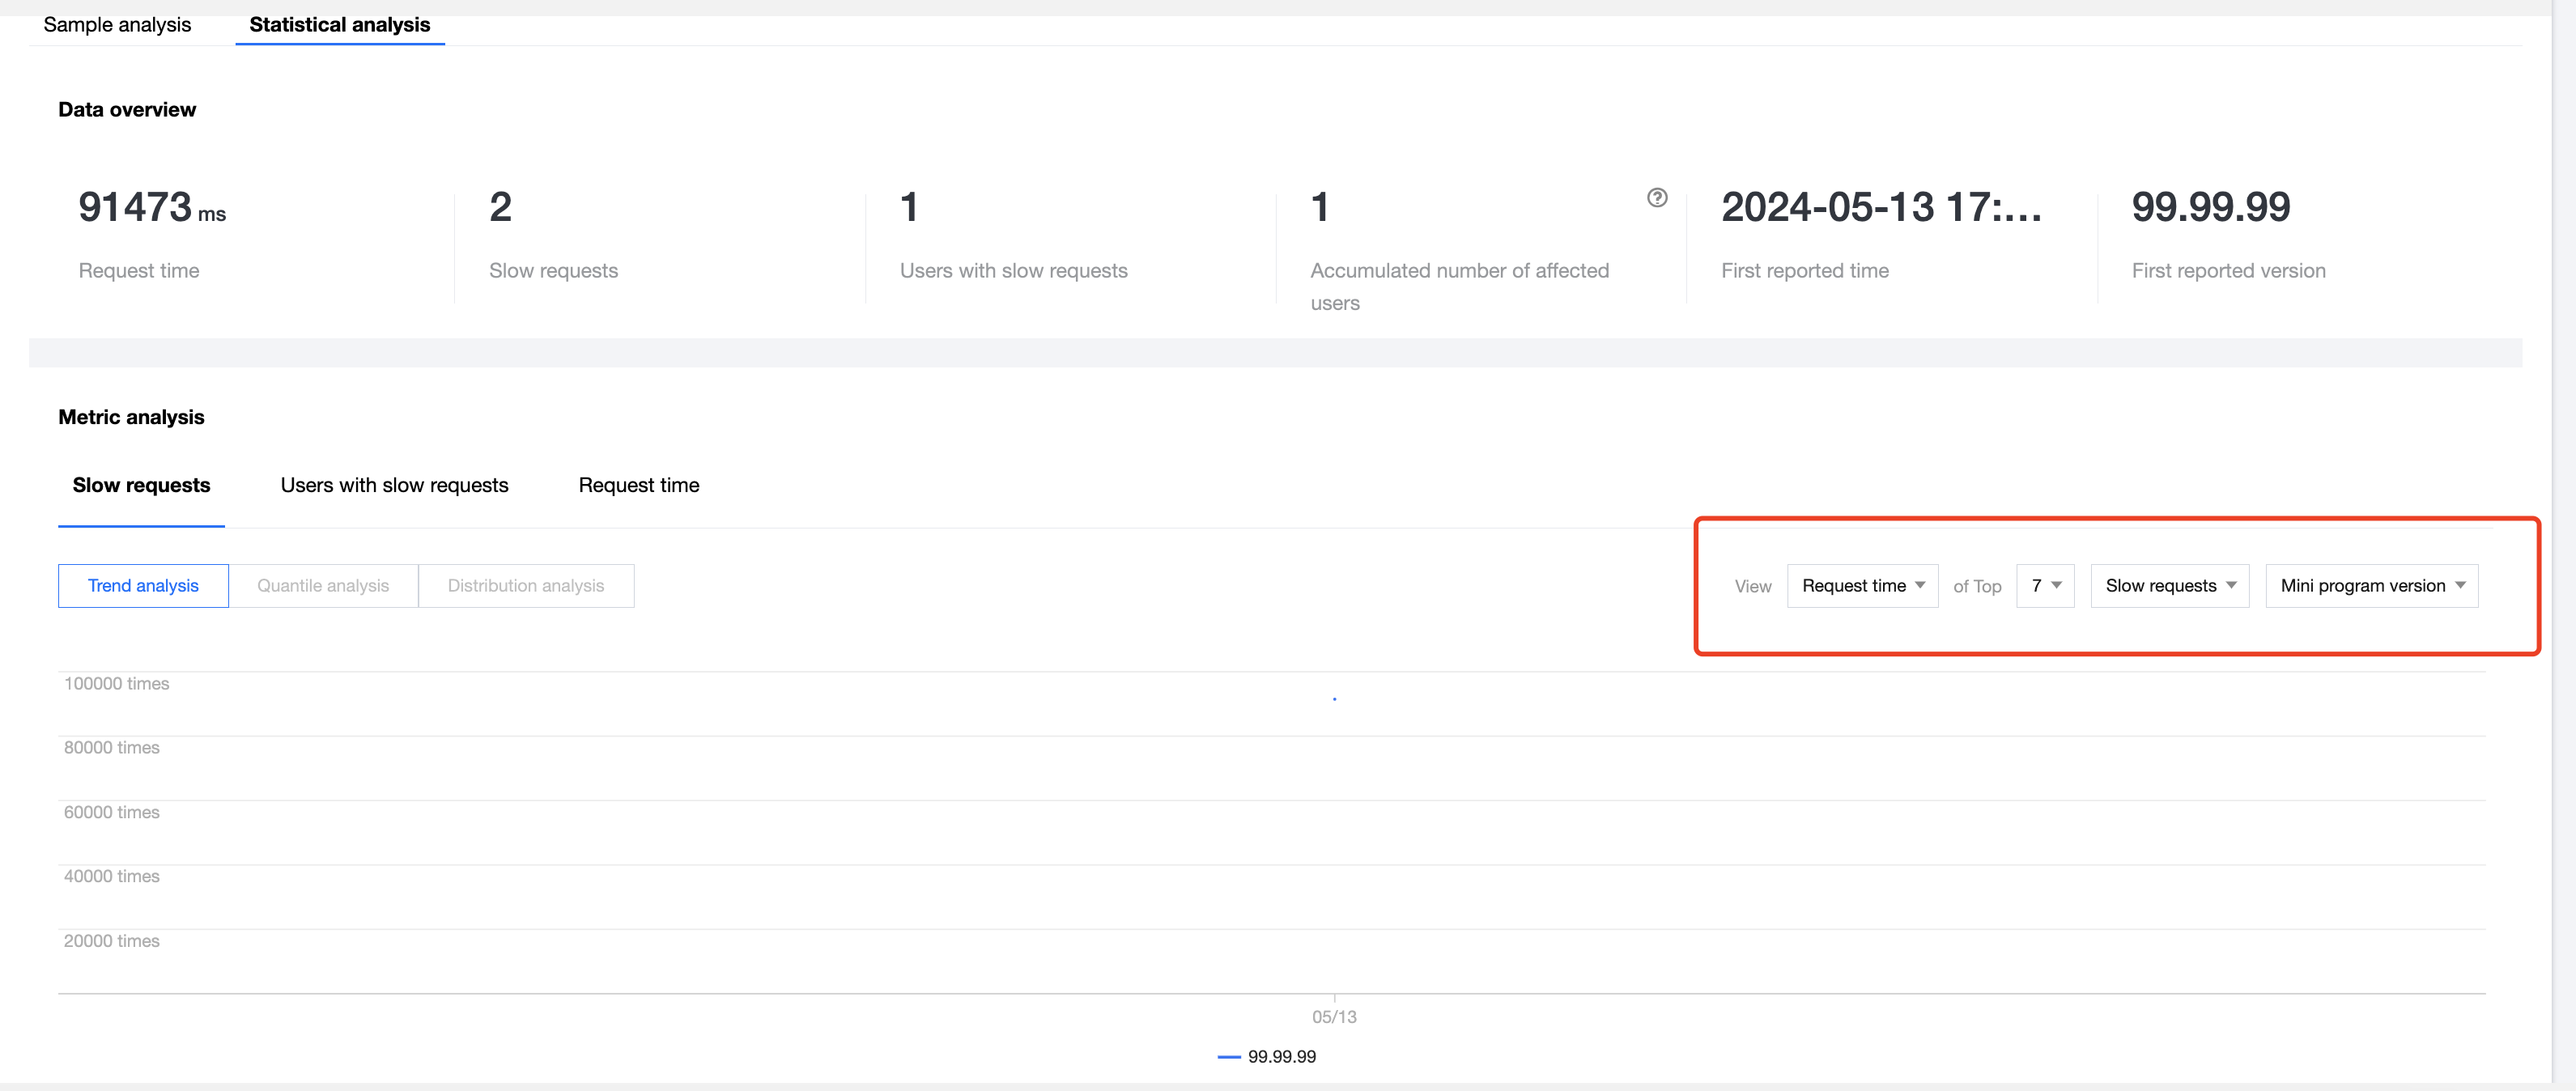
The statistical analysis capability of slow request analysis displays the trends of the request duration, number of slow requests, and number of slow request-affected users. It also provides combined analysis capabilities to help you get more information of an issue. Percentile analysis and distribution analysis are supported for the request duration.
2.2 Exception request analysis
4.2.2.1 Trend analysis
Trend analysis supports the following metrics: ratio of error request, number of error requests, ratio of error users, and number of error request users. You can quickly locate the time point when the number of abnormal requests surged or decreased and find out the cause.
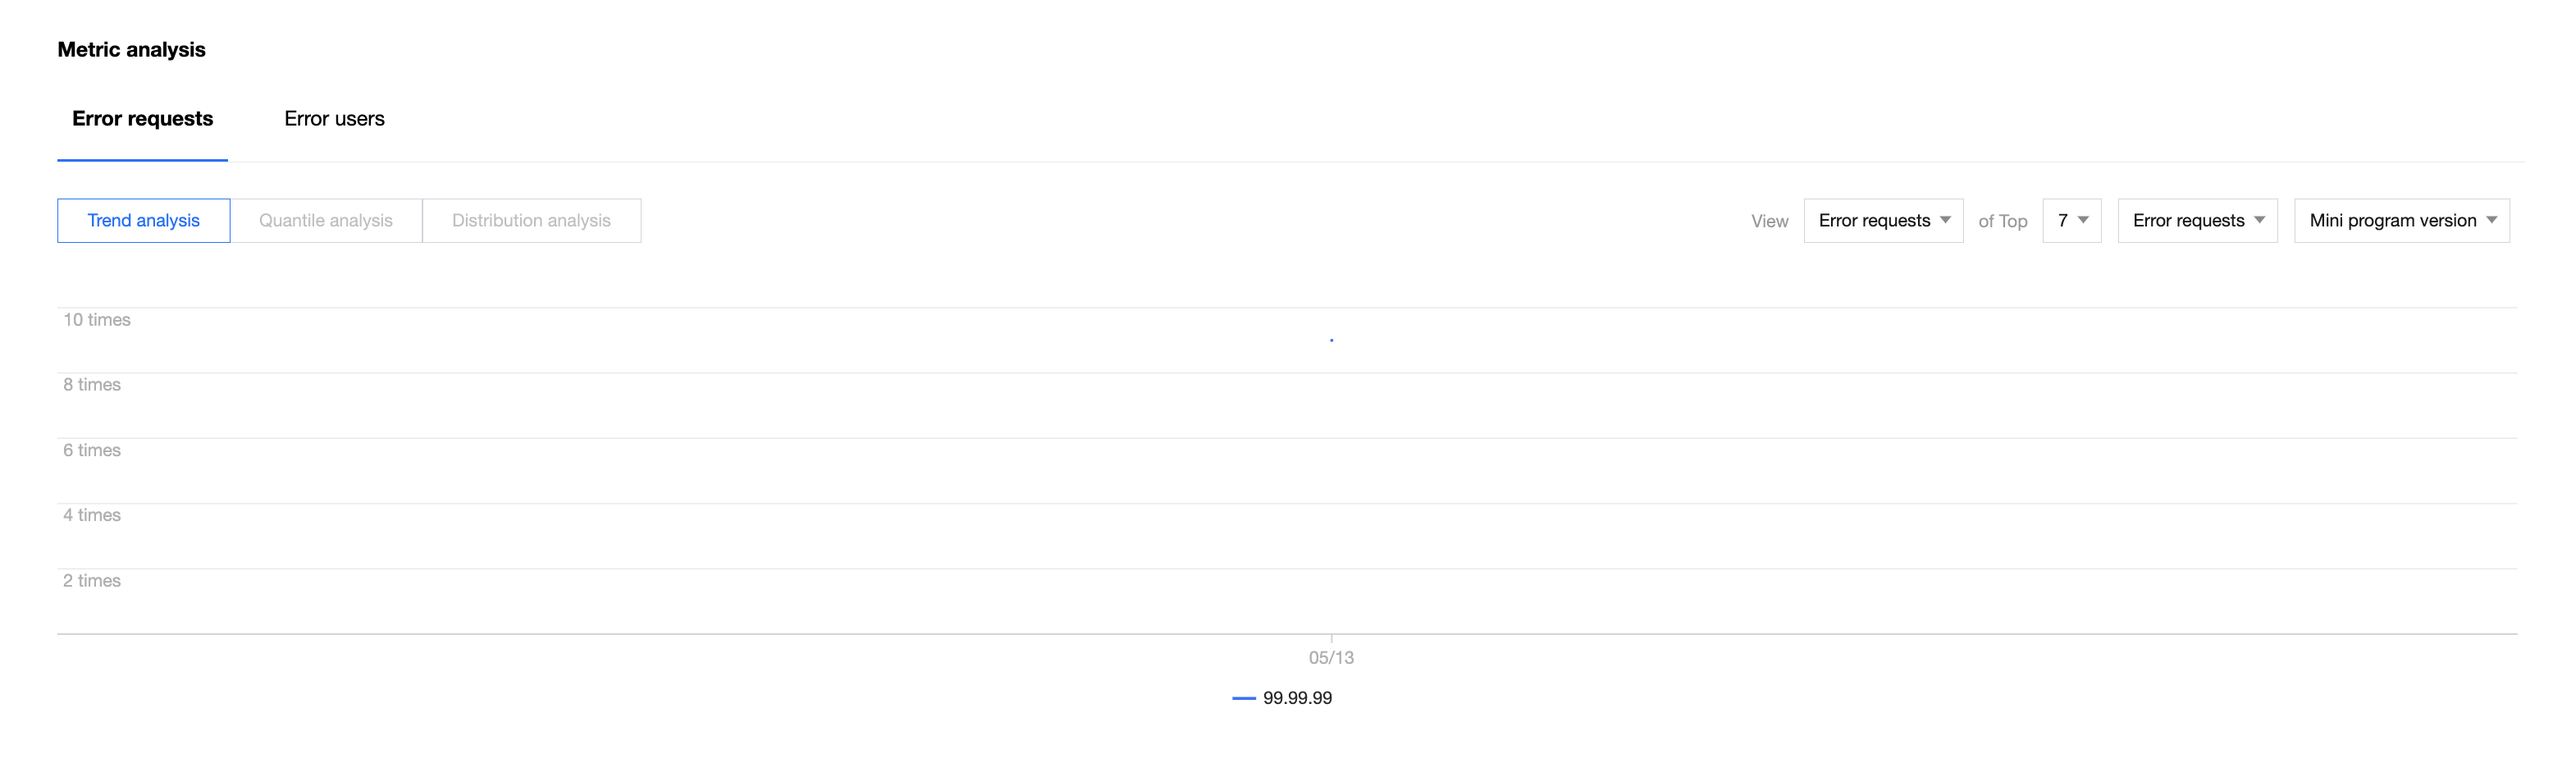
4.2.2.2 Combined analysis
Exception request combined analysis allows you to combine observation dimensions (mini program version, platform app version, system, system version, and device type) and sorting conditions to view the top 7, top 10, and top 20 metric changes.
4.2.2.3 Request details
In page details, you can view the data of each domain, such as number of requests, number of exception requests, ratio of exception requests, number of users, number of affected users, and ratio of affected users. You can sort the data by metric in ascending or descending order. You can click "Filter" in the "Operation" column to quickly set a scenario as a filter item. You can also click to view the metric data of a specific URL under the corresponding domain.
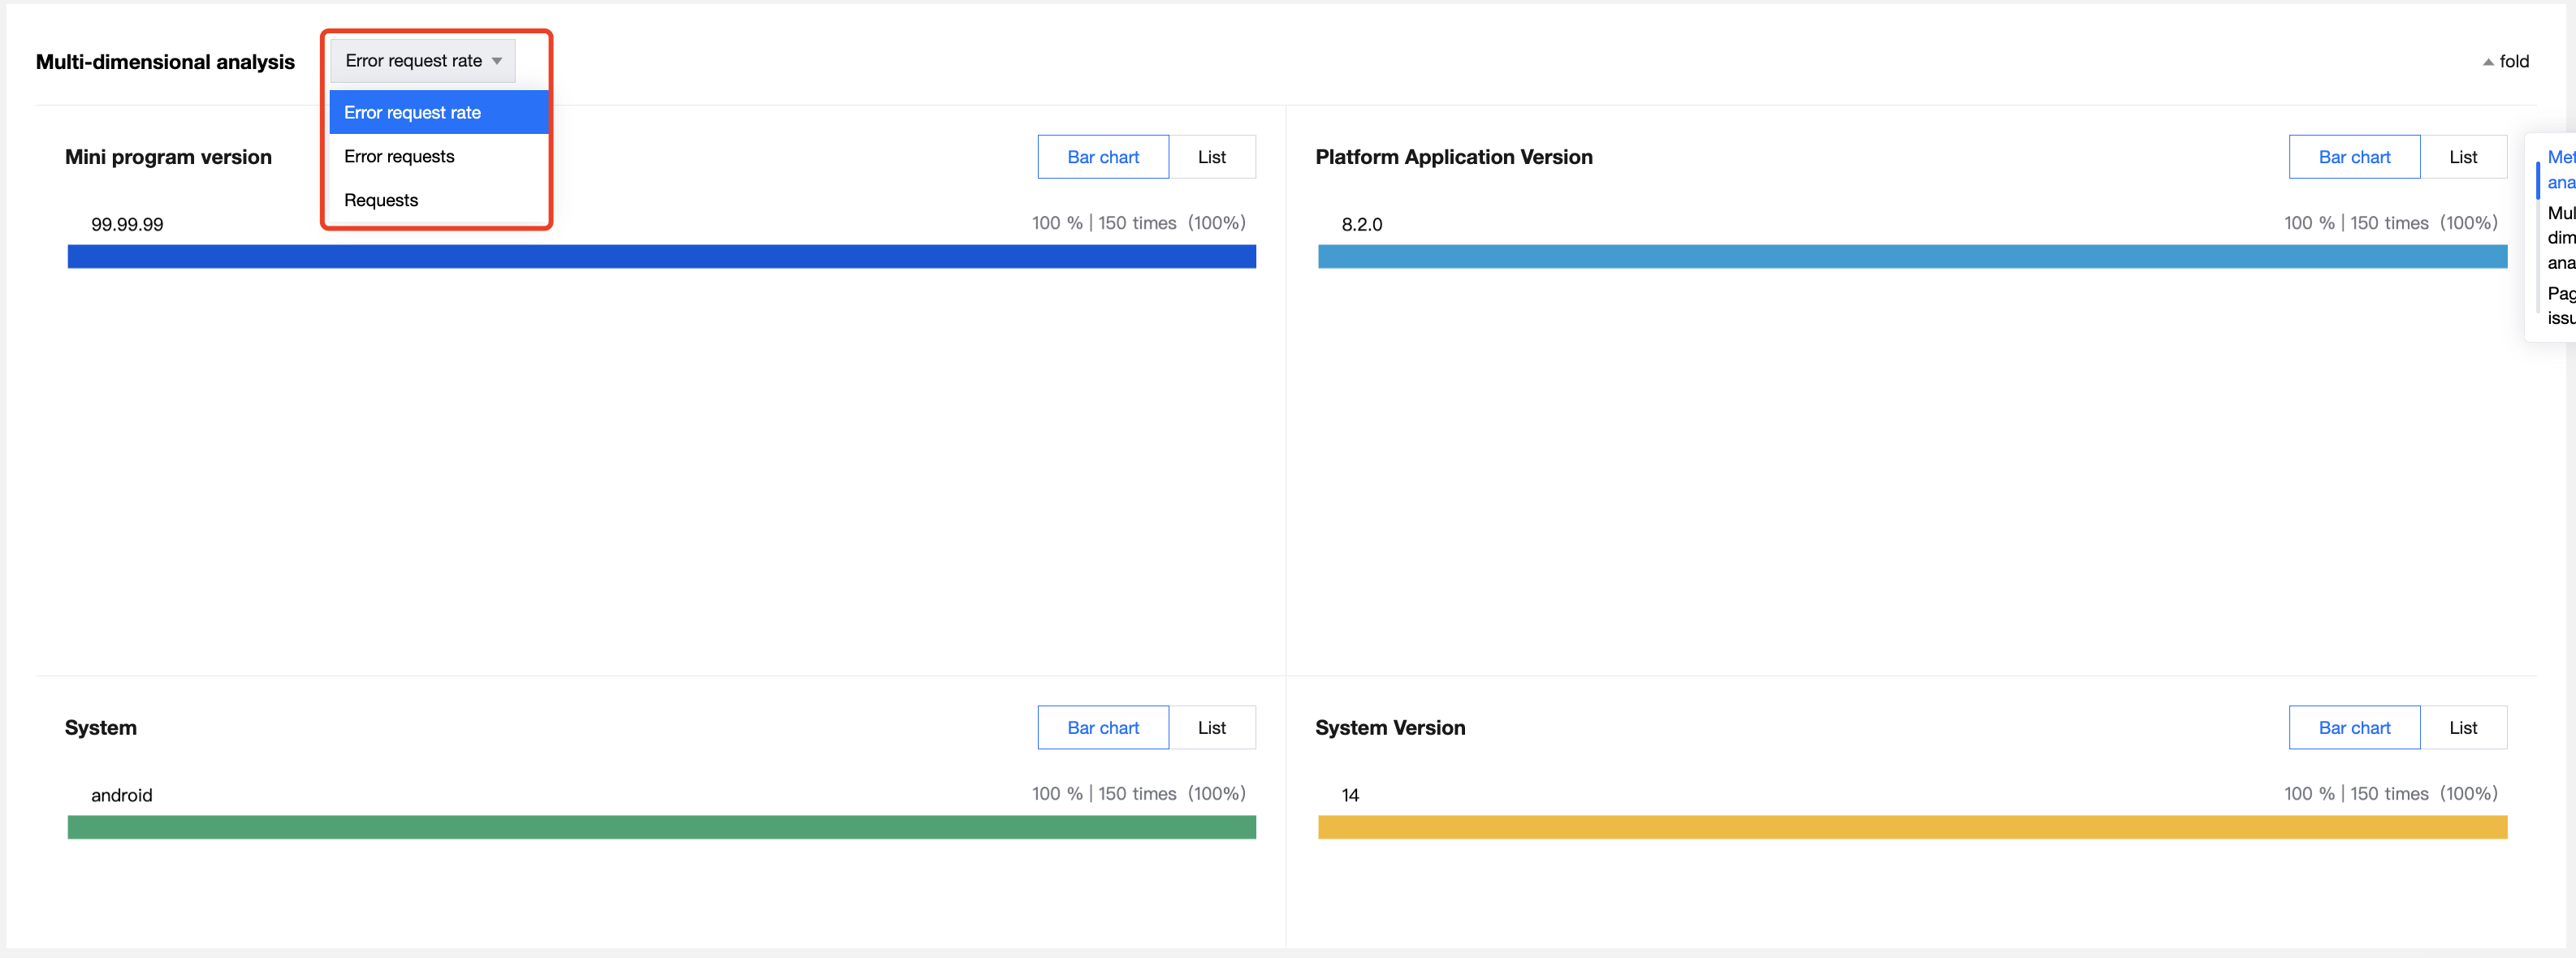
4.2.2.4 Multi-dimensional analysis
When you view the error ratio or number of error requests in trend analysis, you can choose to view the error ratio, number of error requests and the number of requests to view related data. You can determine the situation of exception requests in a certain dimension based on the data.
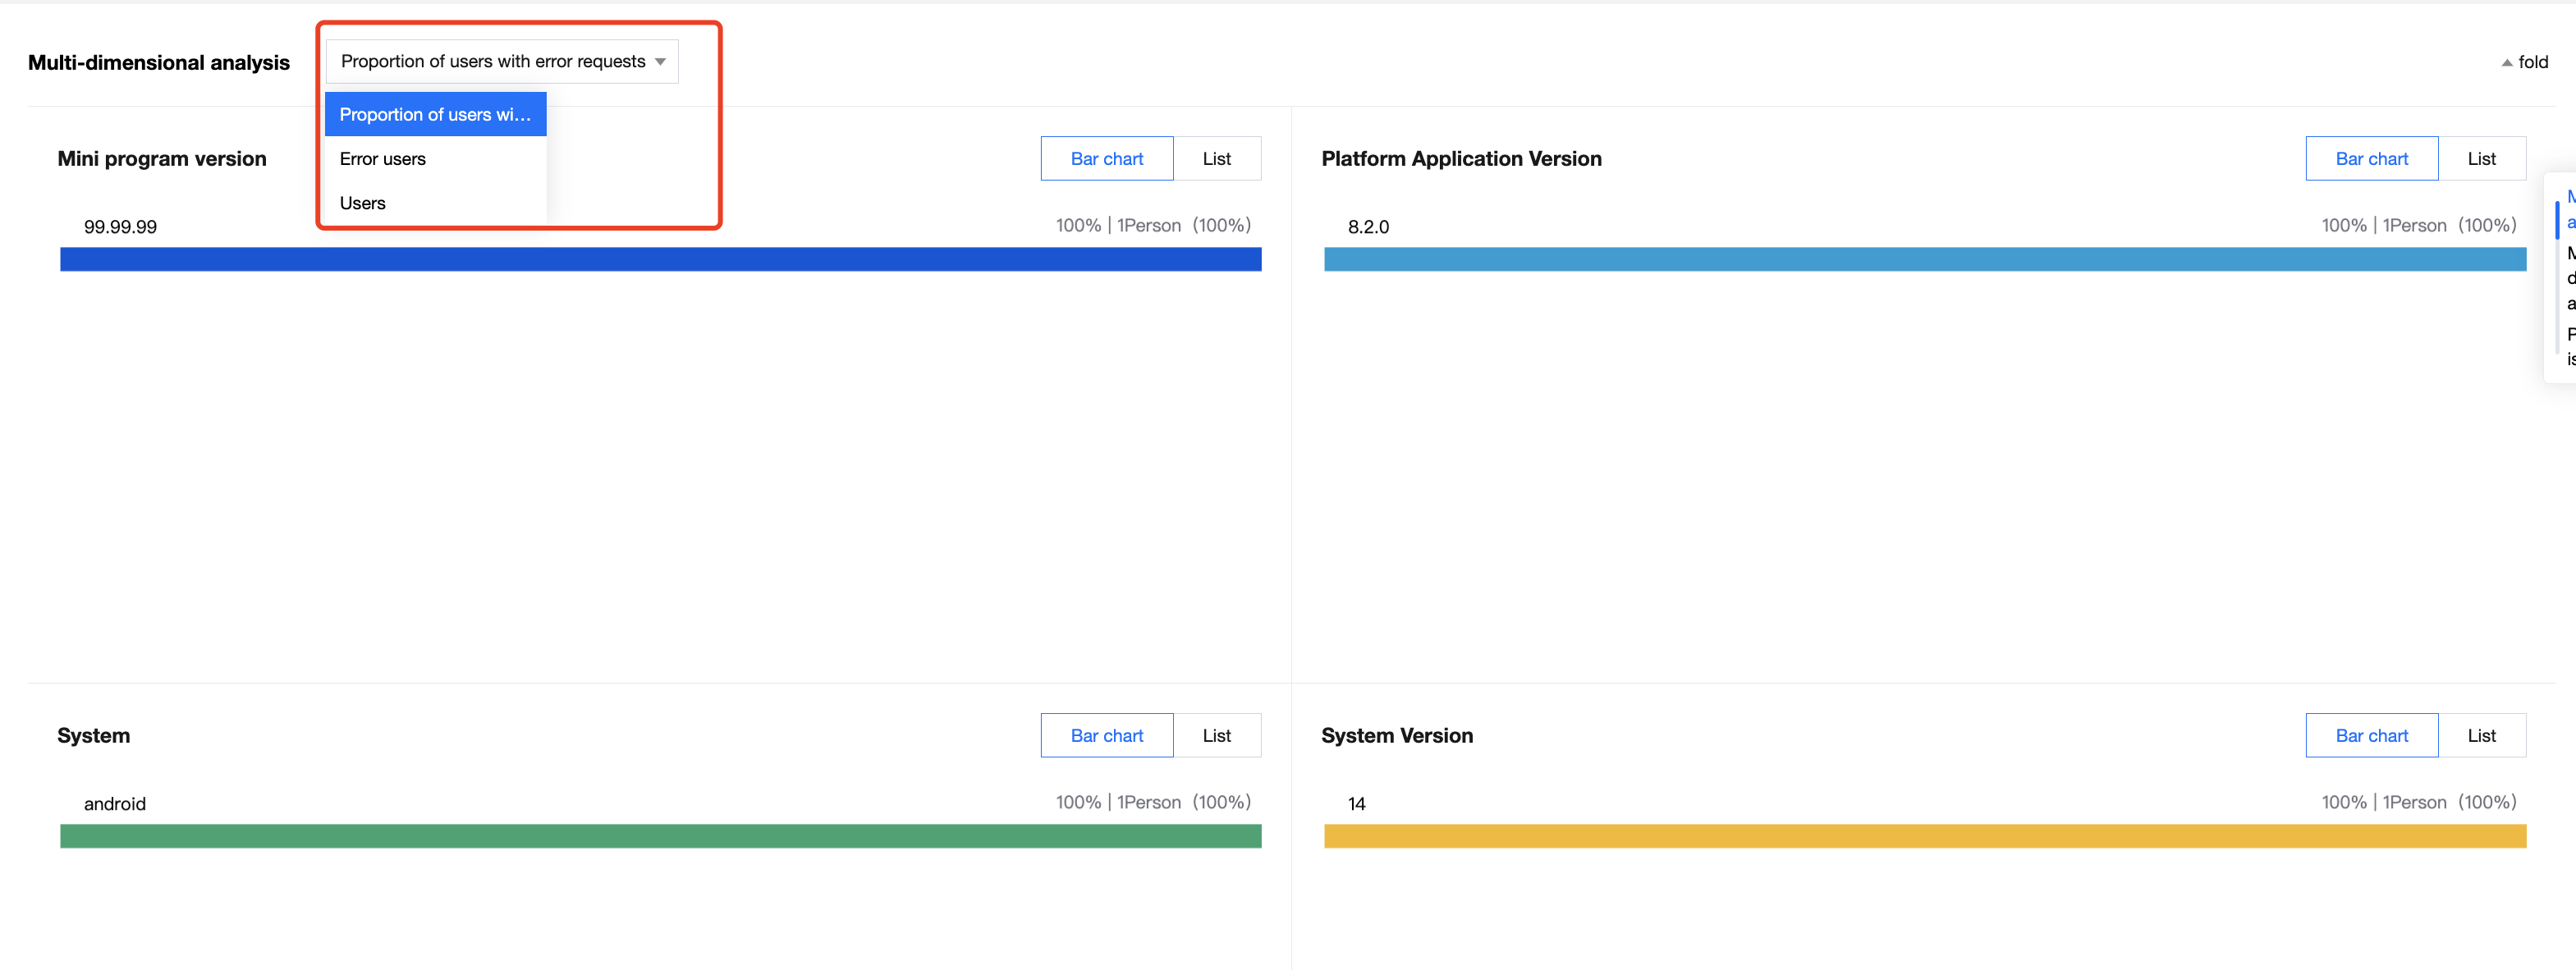
When you view the ratio of error-affected users and the number of error-affected users in trend analysis, you can choose to view the number of error-affected users or total number of users to view related data.
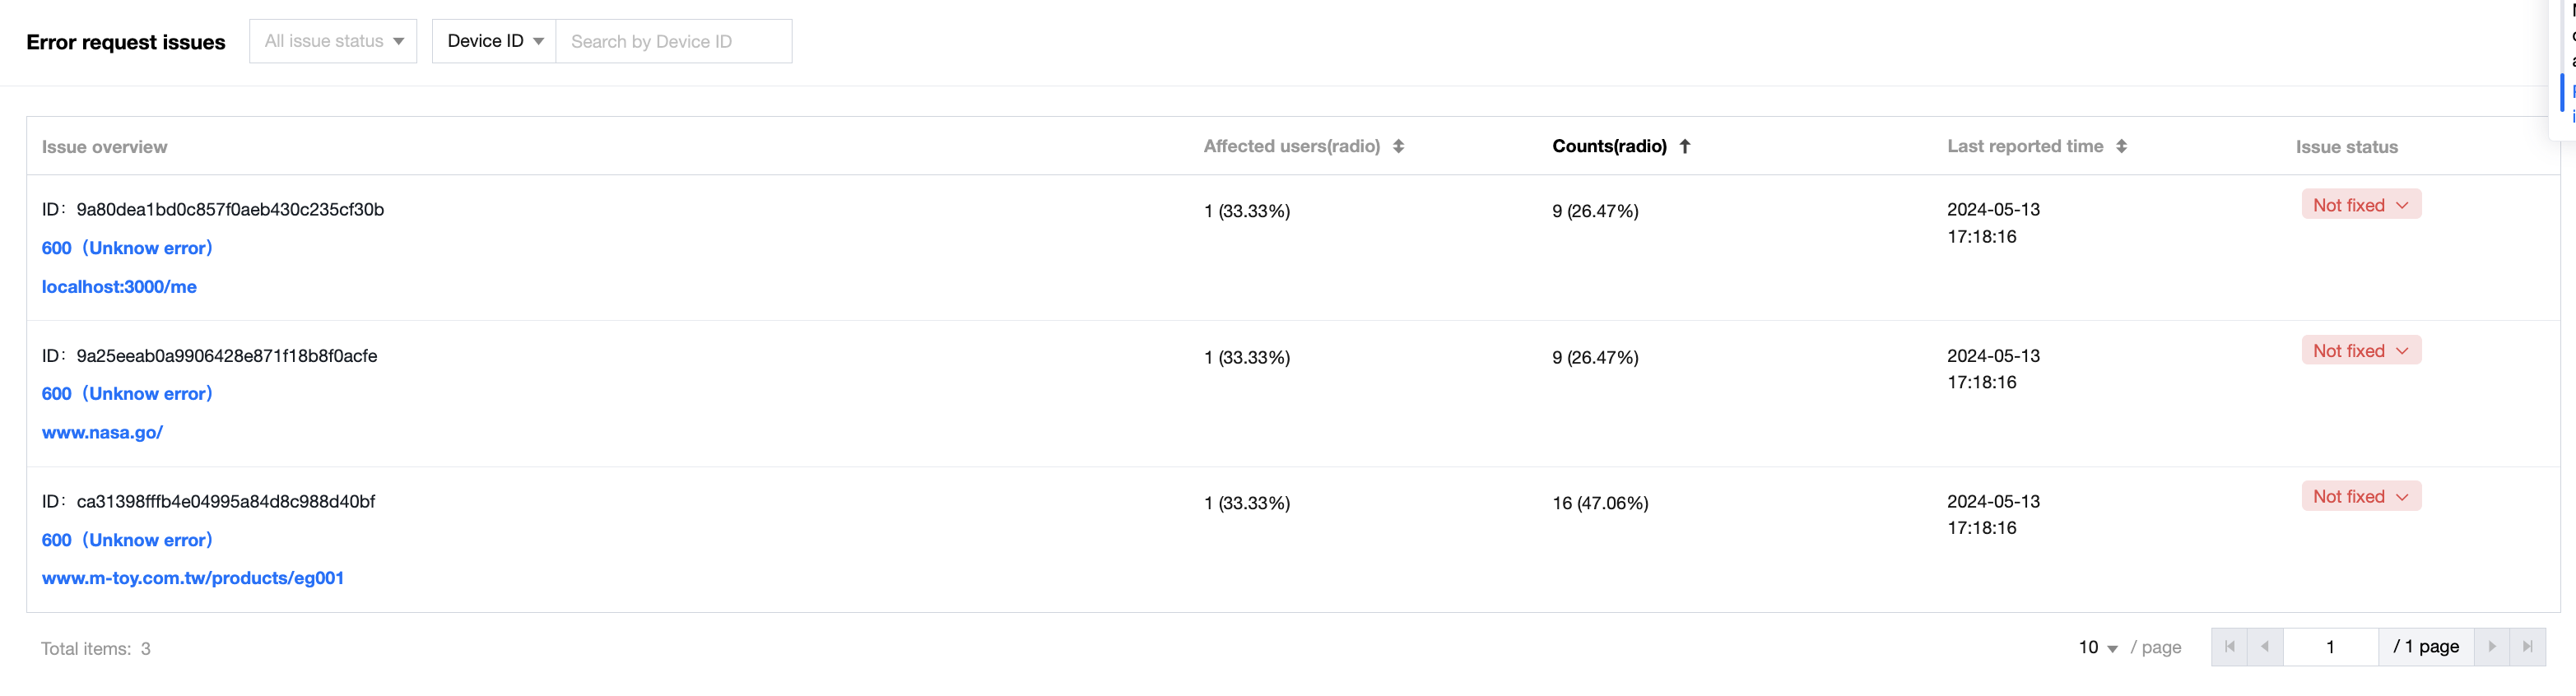
4.2.2.5 Issue list
If an HTTP request sample has a status code greater than or equal to 400, QAPM will identify it as an abnormal request and collect its data for reporting. It will also aggregate similar issues with the same characteristics based on Tencent's performance optimization experience.
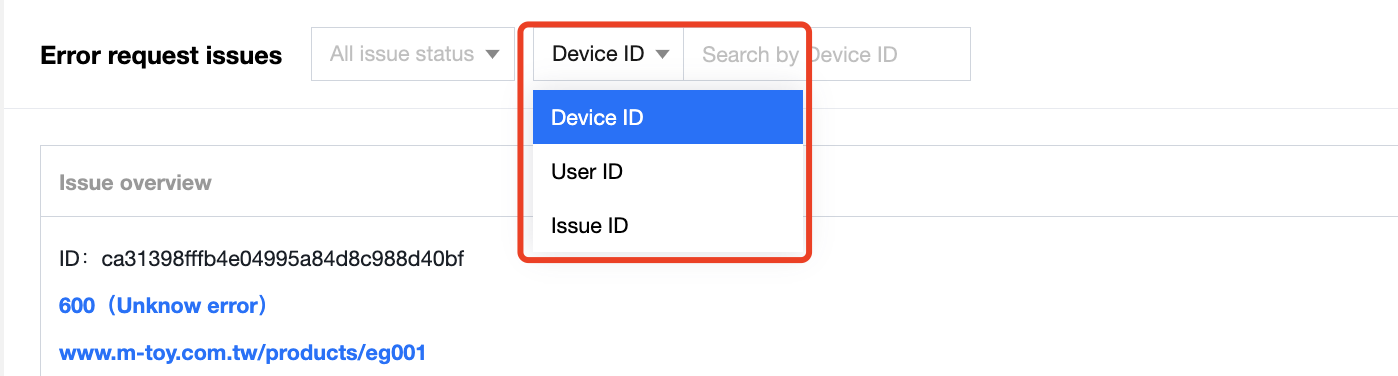
In the list of abnormal requests, you can set the issue status, device ID, user ID, or issue ID as a filter, which takes effect only for the list.
The issue list also allows you to sort data by the number of affected users, occurrences, or the last report time.
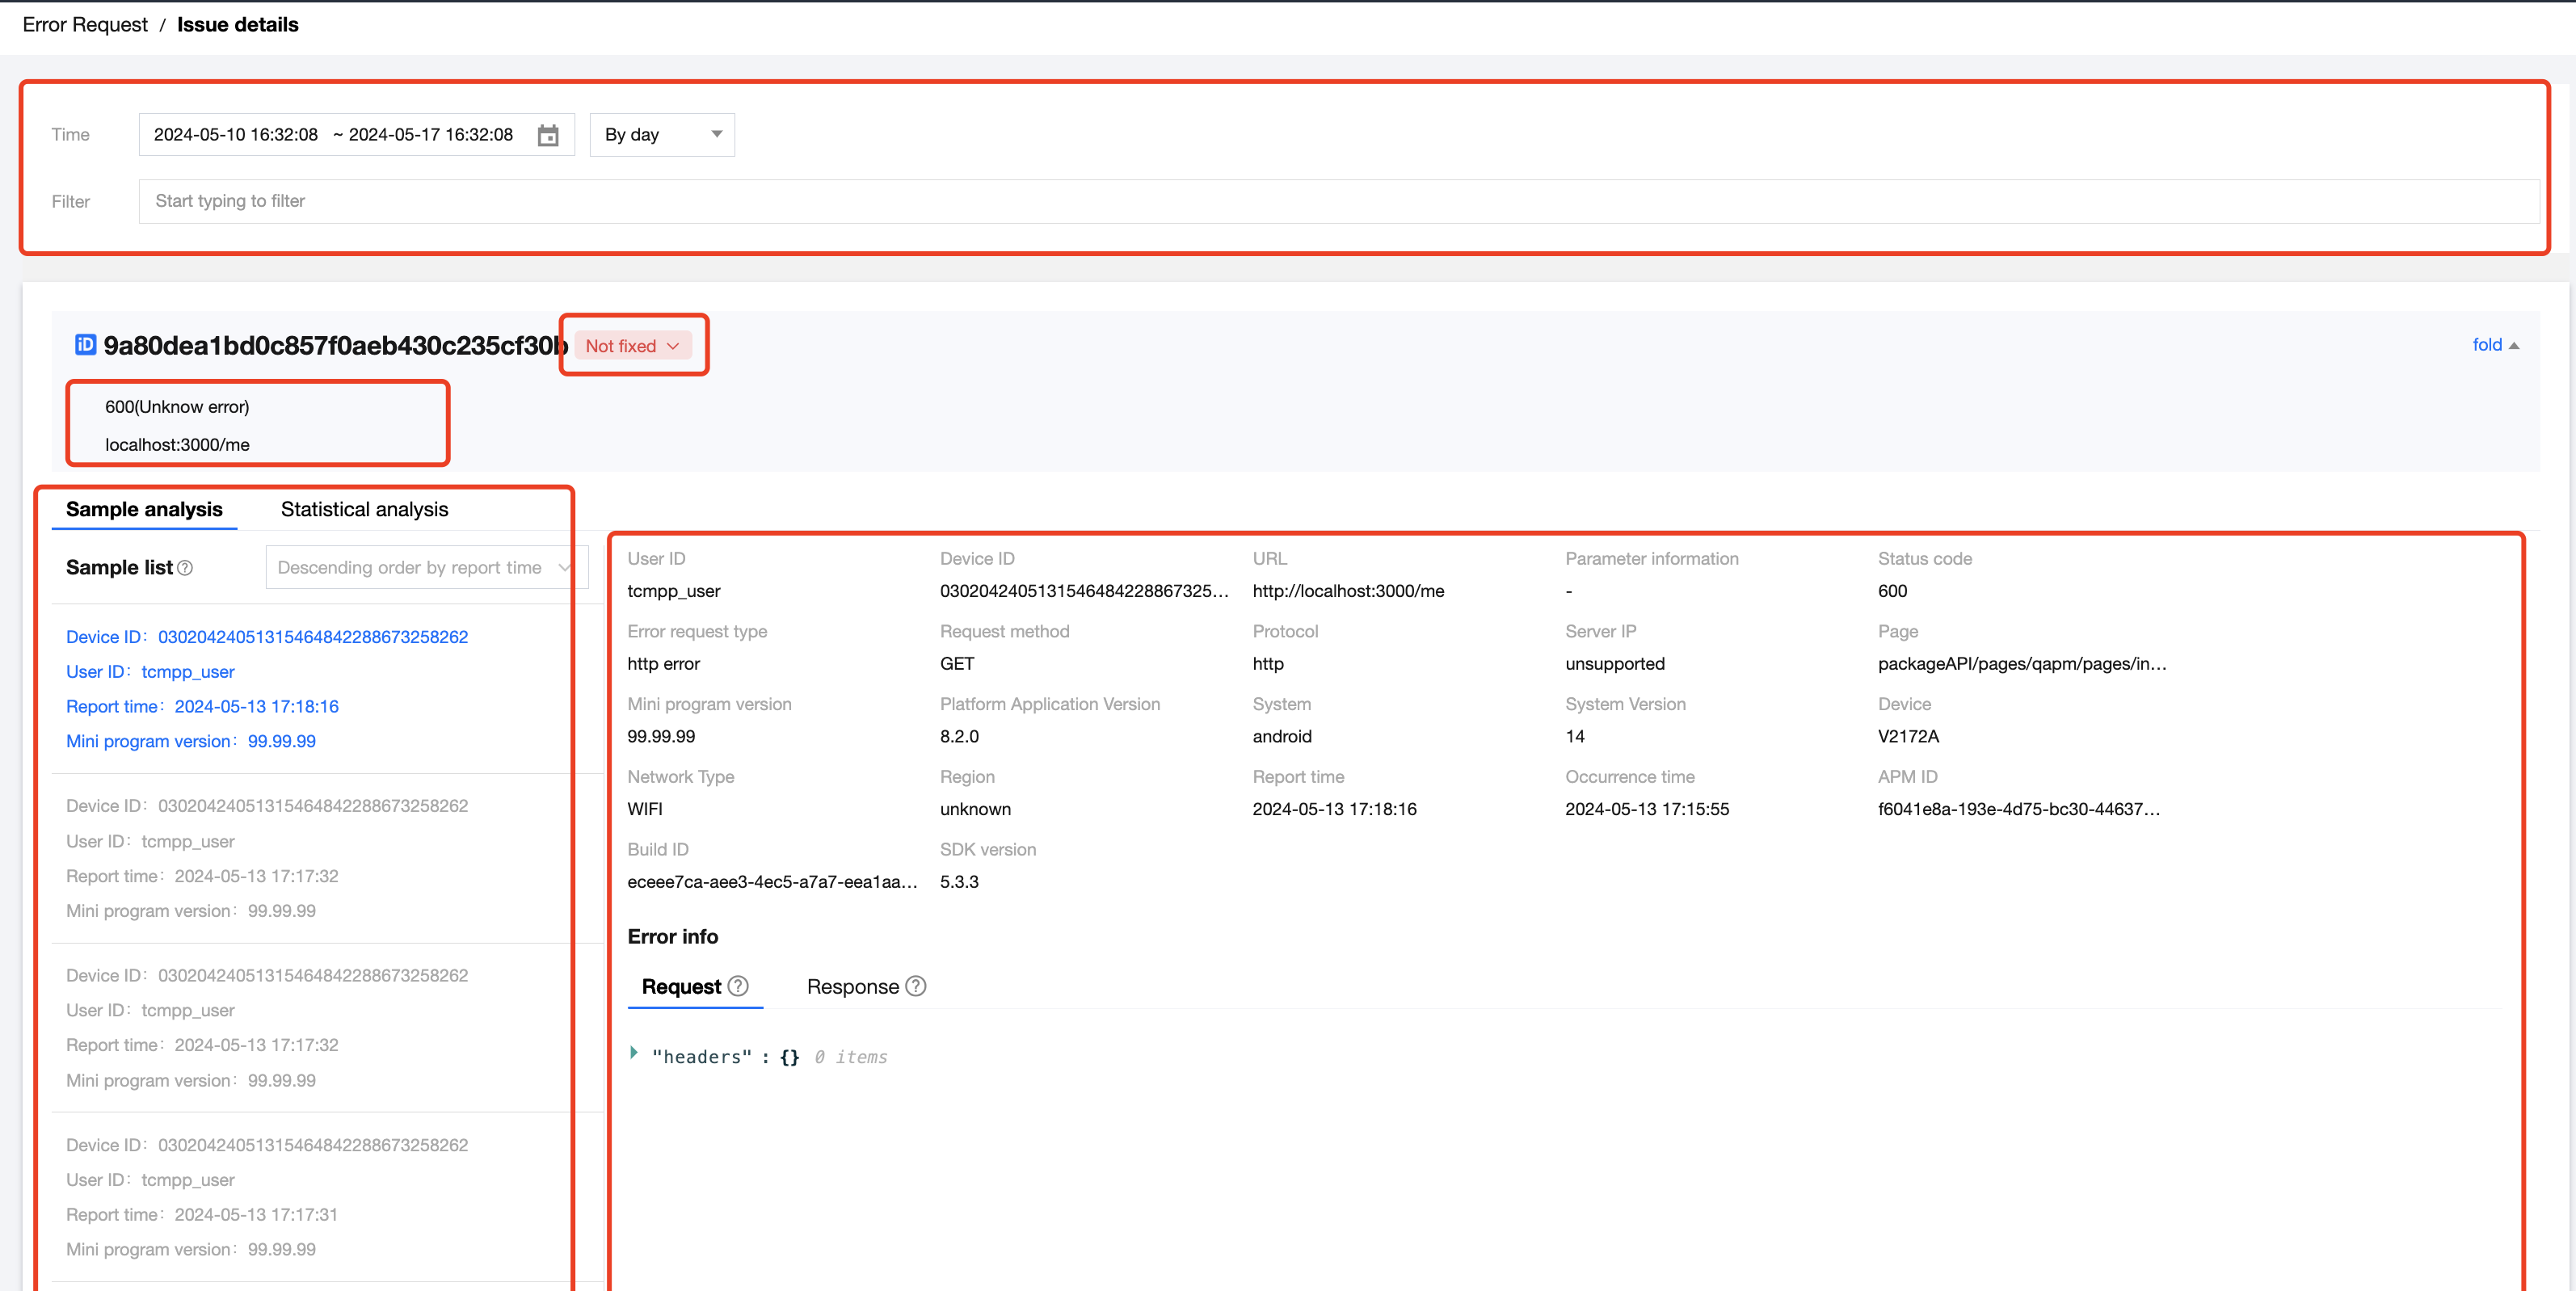
4.2.2.6 Issue details
On the issue details page, you can view the different sample data of an abnormal request and click a sample in the sample list to switch between samples. You can also filter samples by prioritized dimension.
The abnormal request issue details contain the request and response information of each request, and only the information in the specified headers is reported according to the same rules as slow requests.
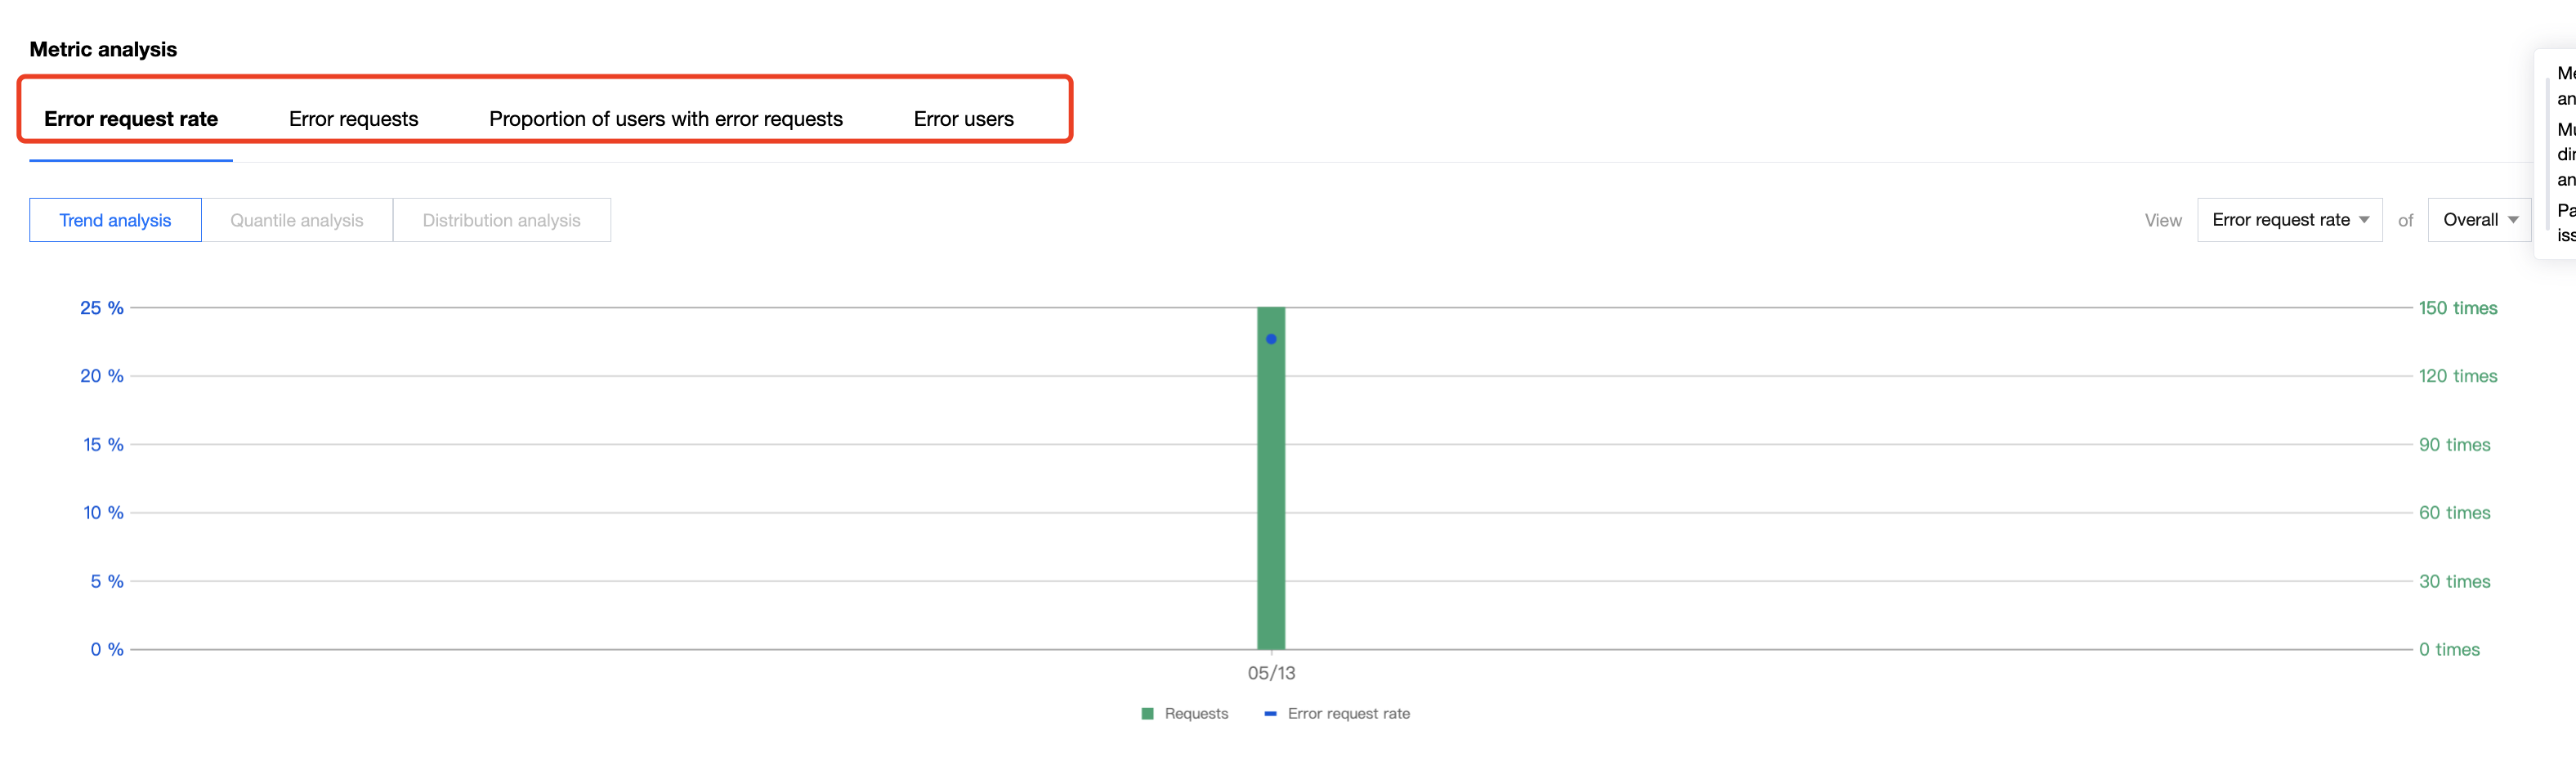
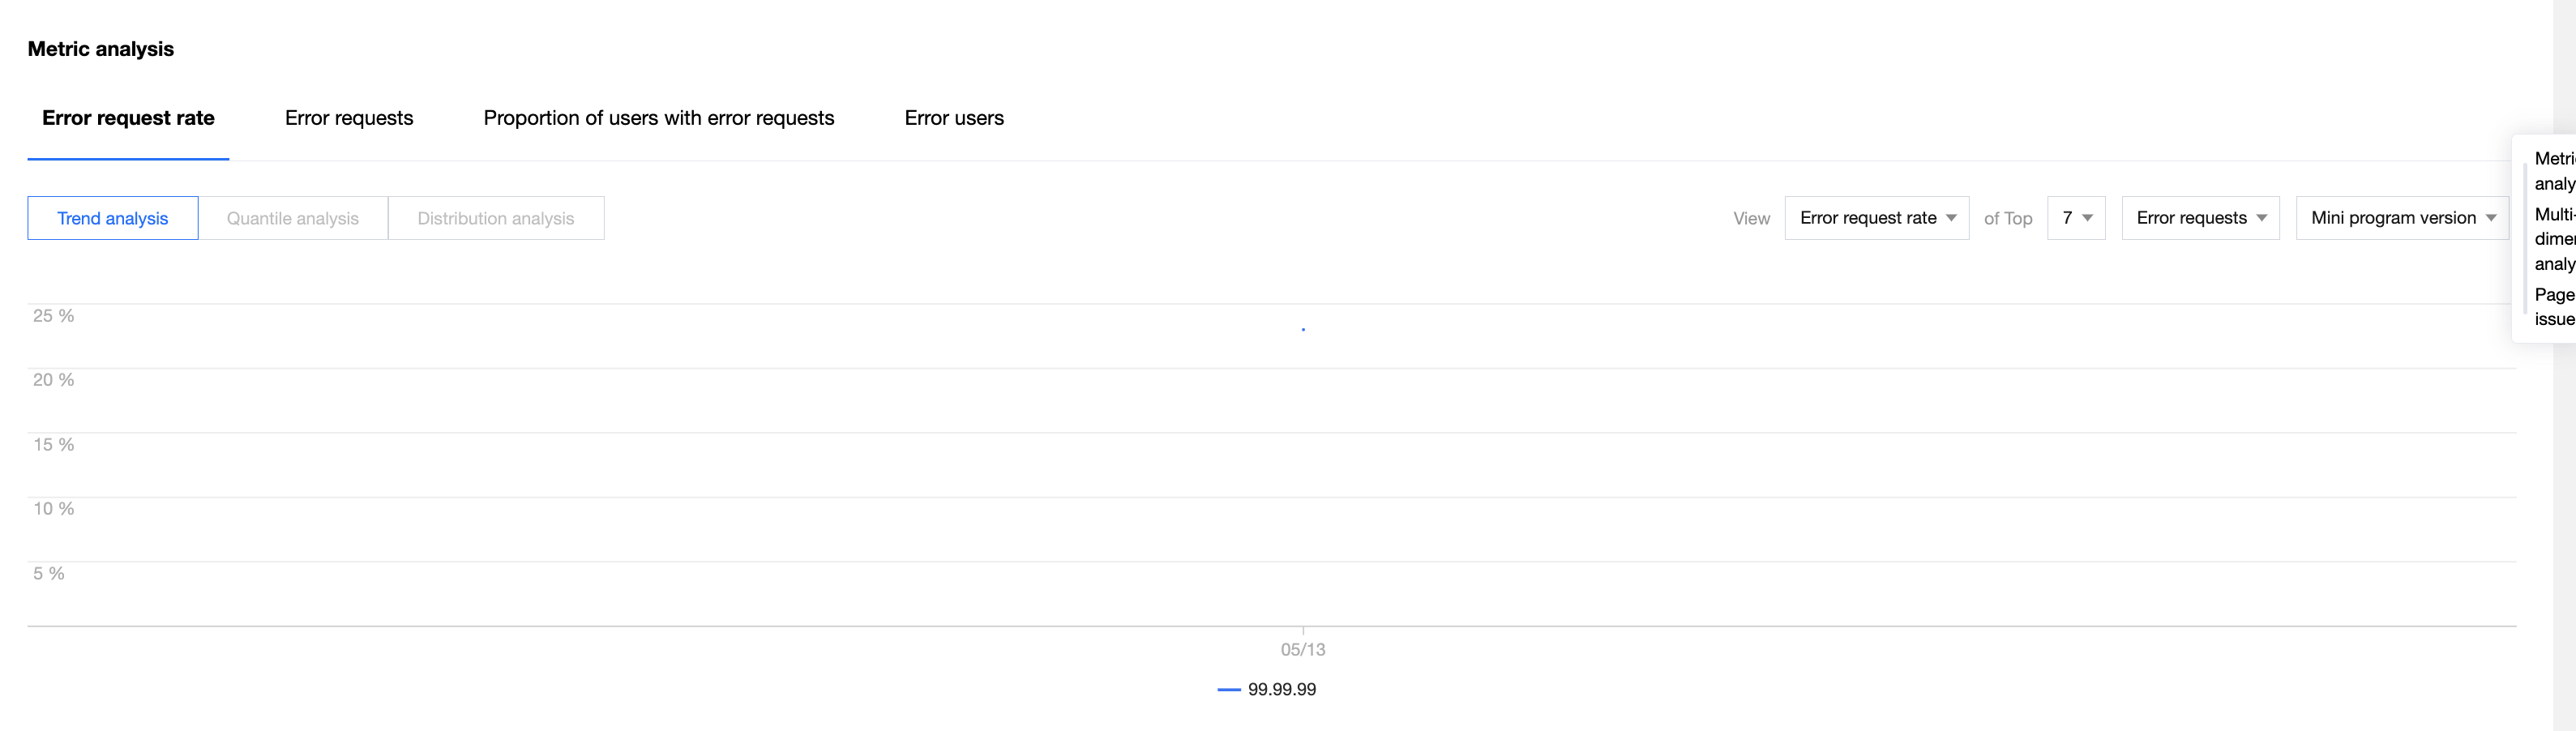
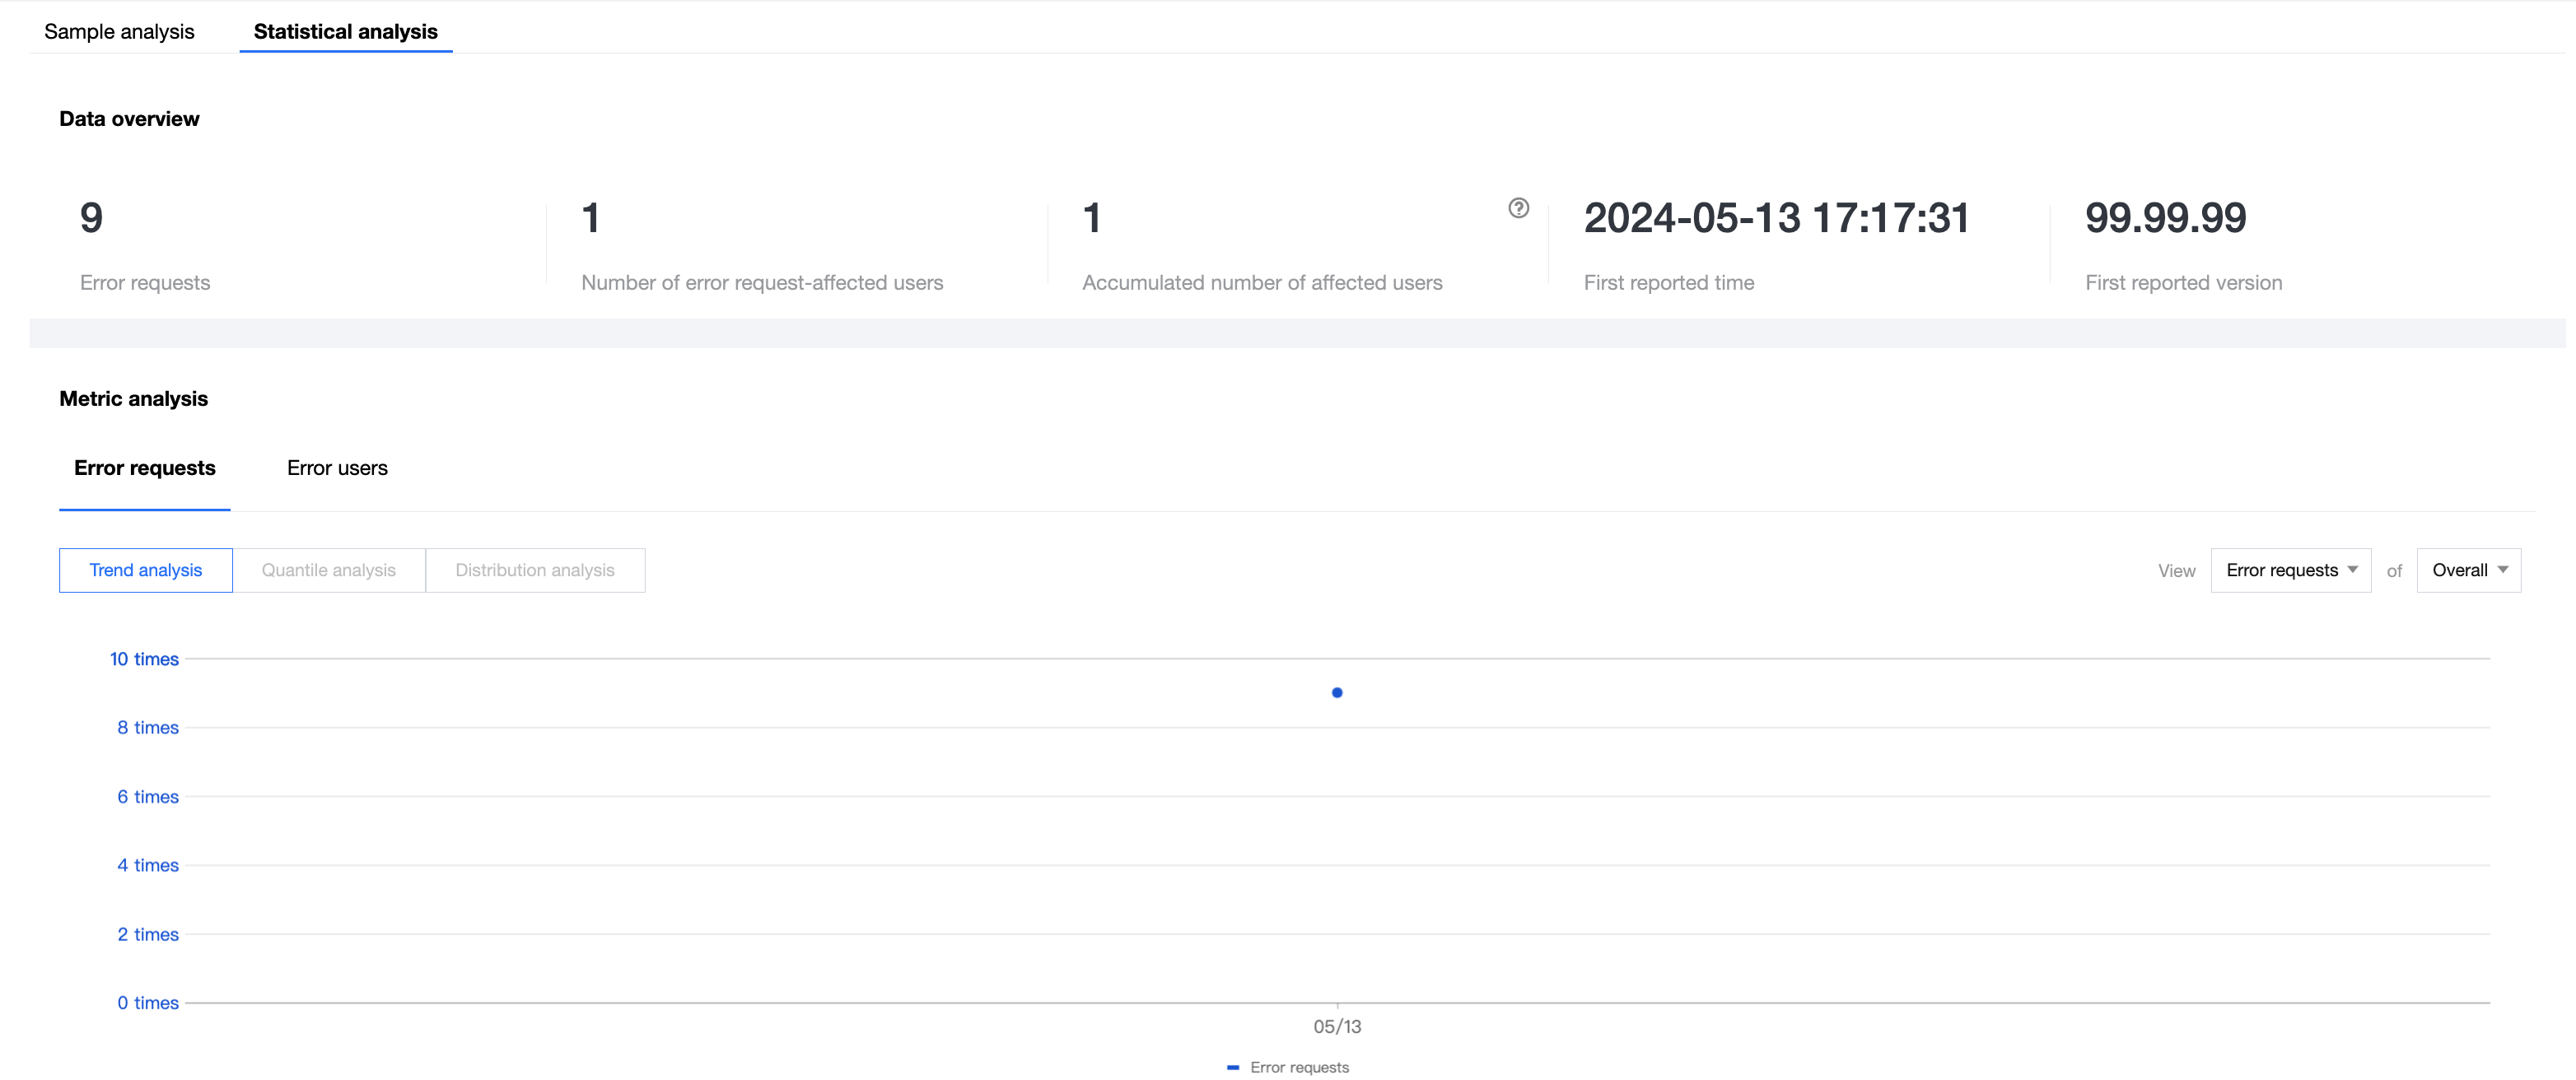
The statistical analysis capability of abnormal request analysis displays the trends of the numbers of error requests and error request-affected users. It also provides combined analysis capabilities to help you get more information of an issue.
5. JS error analysis
5.1 Feature introduction
JS error analysis aims to help you resolve JS errors of mini programs.
Glossary:
JS error occurrences: The total number of JS runtime errors that occurred when the user triggered the mini program page switch.
Ratio of JS errors: The average number of JS runtime errors that occurred when the user triggered the mini program page switch.
Calculation formula: Number of JS errors/Number of page switches
Page switches: The total number of mini program page switches triggered.
JS error-affected users: The total number of users affected by JS errors (deduplicated).
Ratio of JS error-affected users: The ratio of users affected by JS errors to the total number of users who triggered the mini program page switch.
Calculation formula: Number of JS error-affected users/Total number of users
Number of users: The total number of users who triggered the mini program page switch (deduplicated).
5.2 Feature description
5.2.1 Trend analysis
Trend analysis supports the dimensions of the ratio of JS errors, number of JS errors, ratio of JS error-affected users, and number of JS error-affected users You can quickly locate the time point when the number of JS errors surged or decreased and find out the cause.
5.2.2 Combined analysis
JS error combined analysis allows you to combine sorting objects and sorting conditions (app version, system version, device type, domain, and network type) to view the top 7, top 10, and top 20 metric changes.
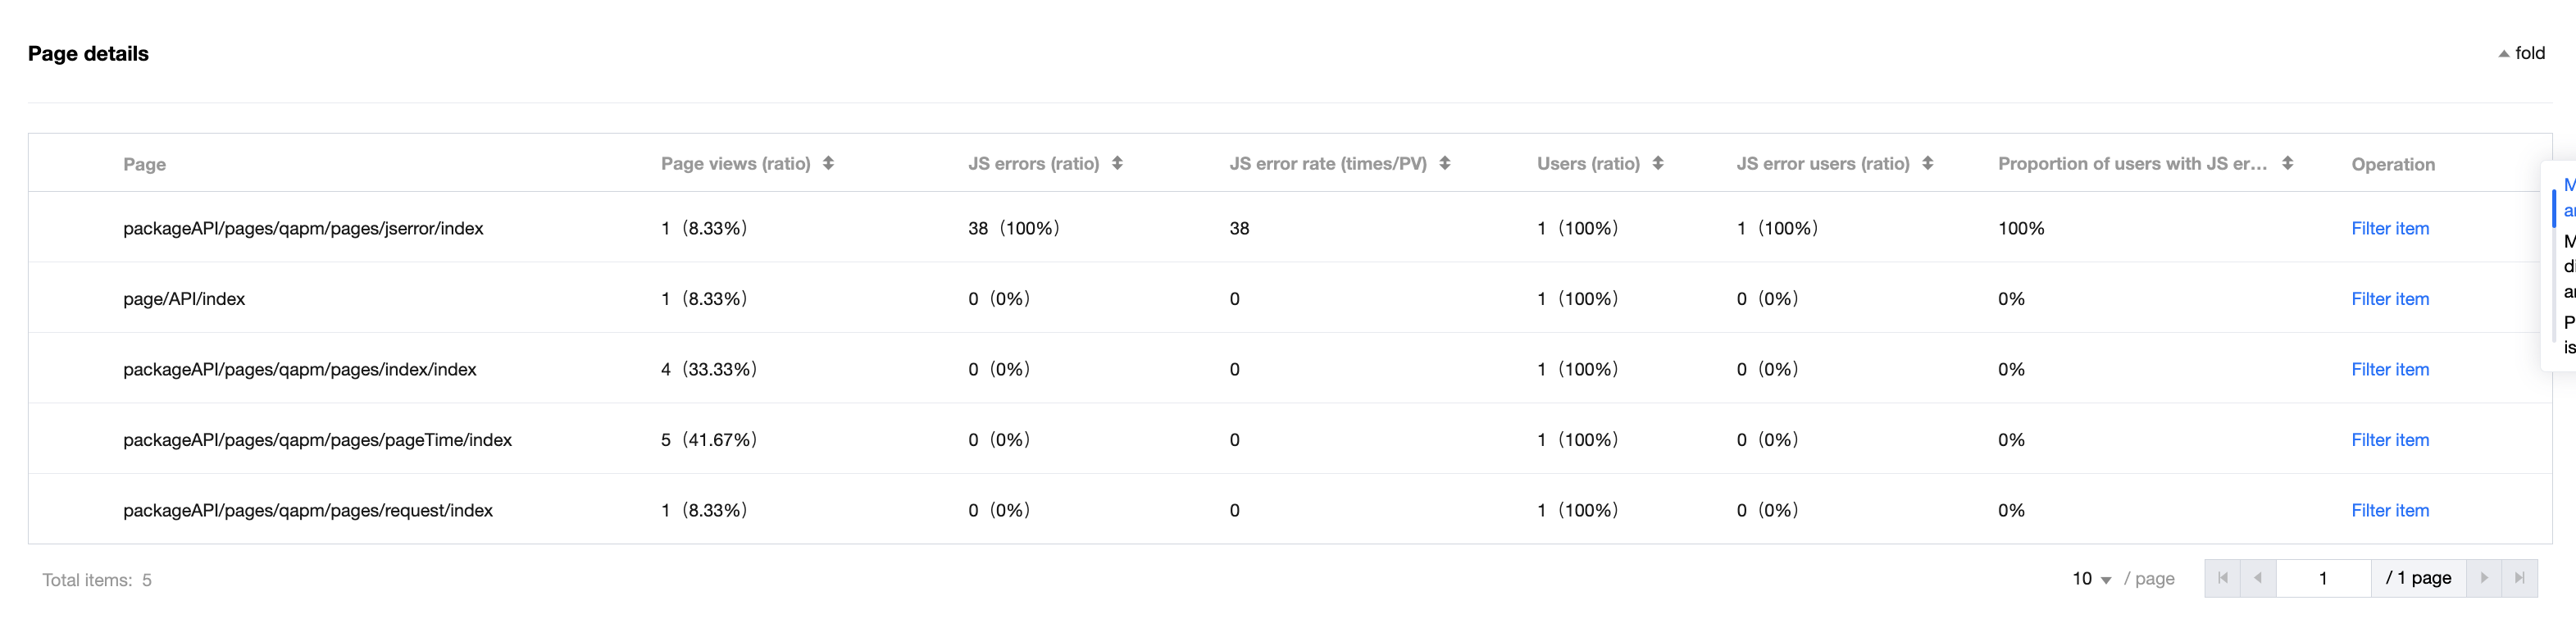
5.2.3 Page details
In page details, you can view the data of each page, such as number of page switches, number of JS errors, ratio of JS errors, number of users, number of JS error-affected users, and ratio of JS error-affected users. You can sort the data by metric in ascending or descending order.
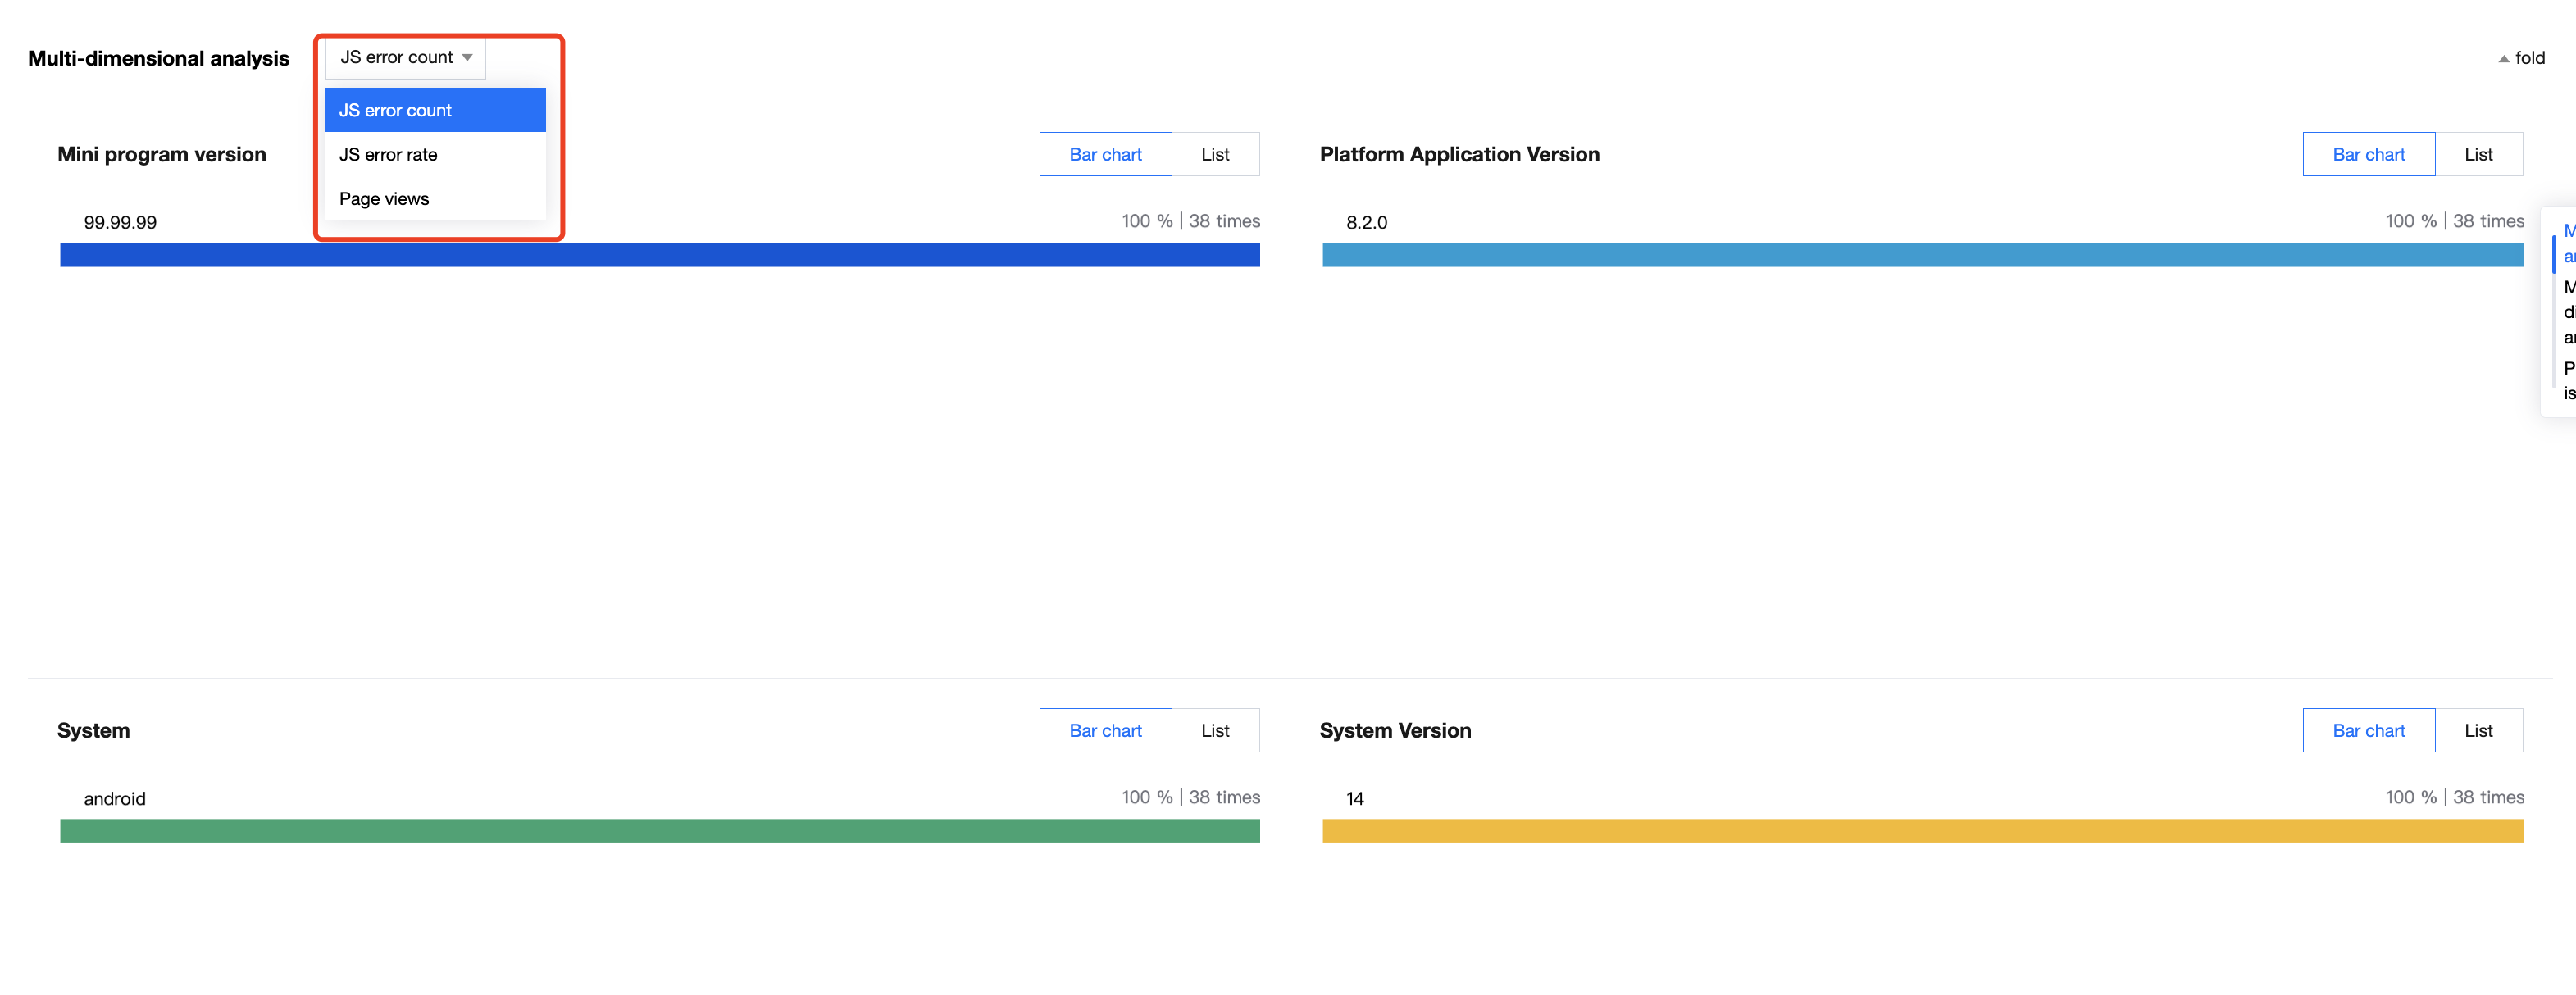
5.2.4 Multidimensional analysis
When you view the JS error ratio or number of JS errors in trend analysis, you can choose to view the number of JS errors and the number of page loads to view related data.
When you view the ratio of JS error-affected users and the number of JS error-affected users in trend analysis, you can choose to view the number of JS error-affected users or total number of users to view related data.
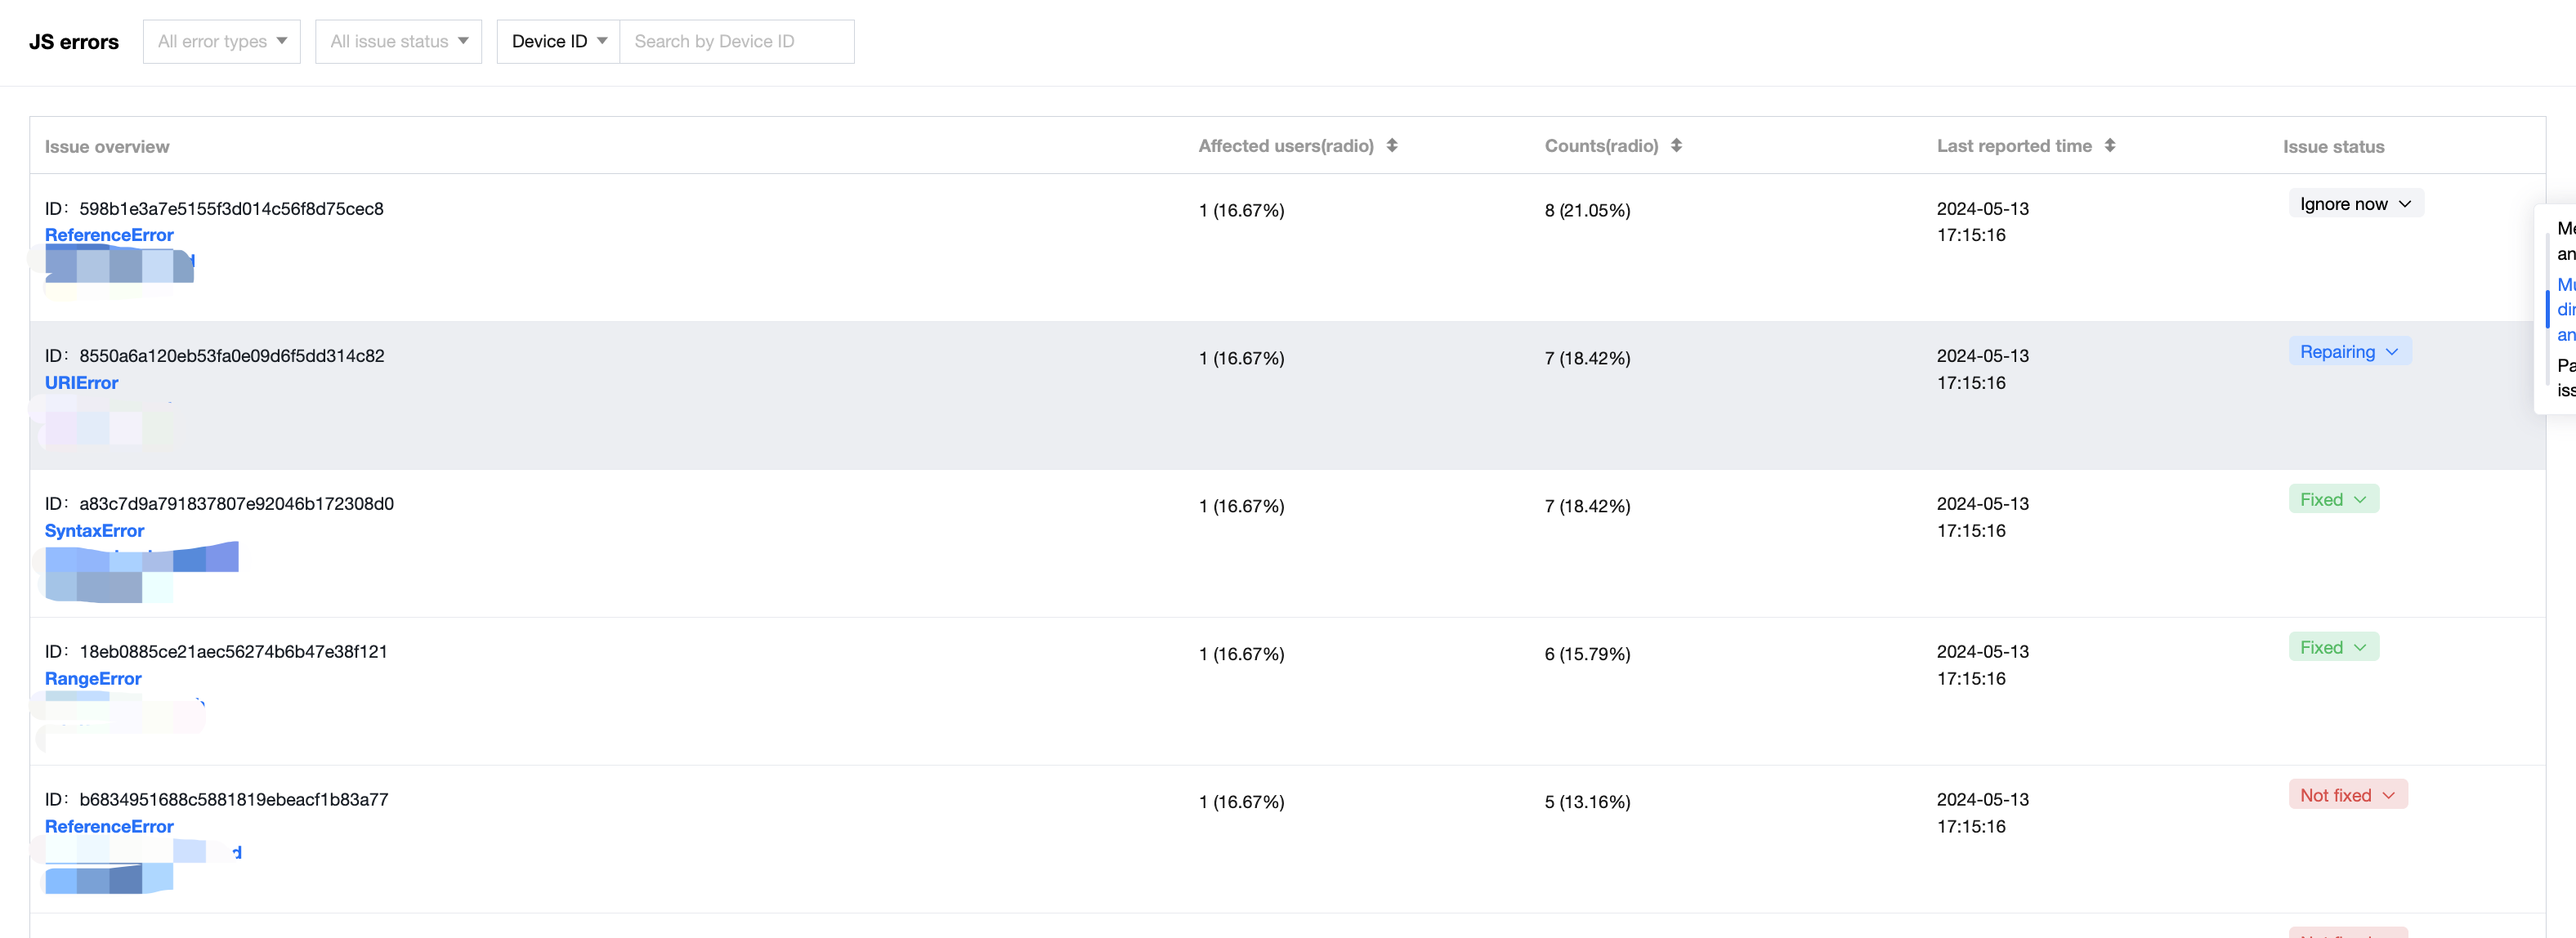
5.2.5 Issue list
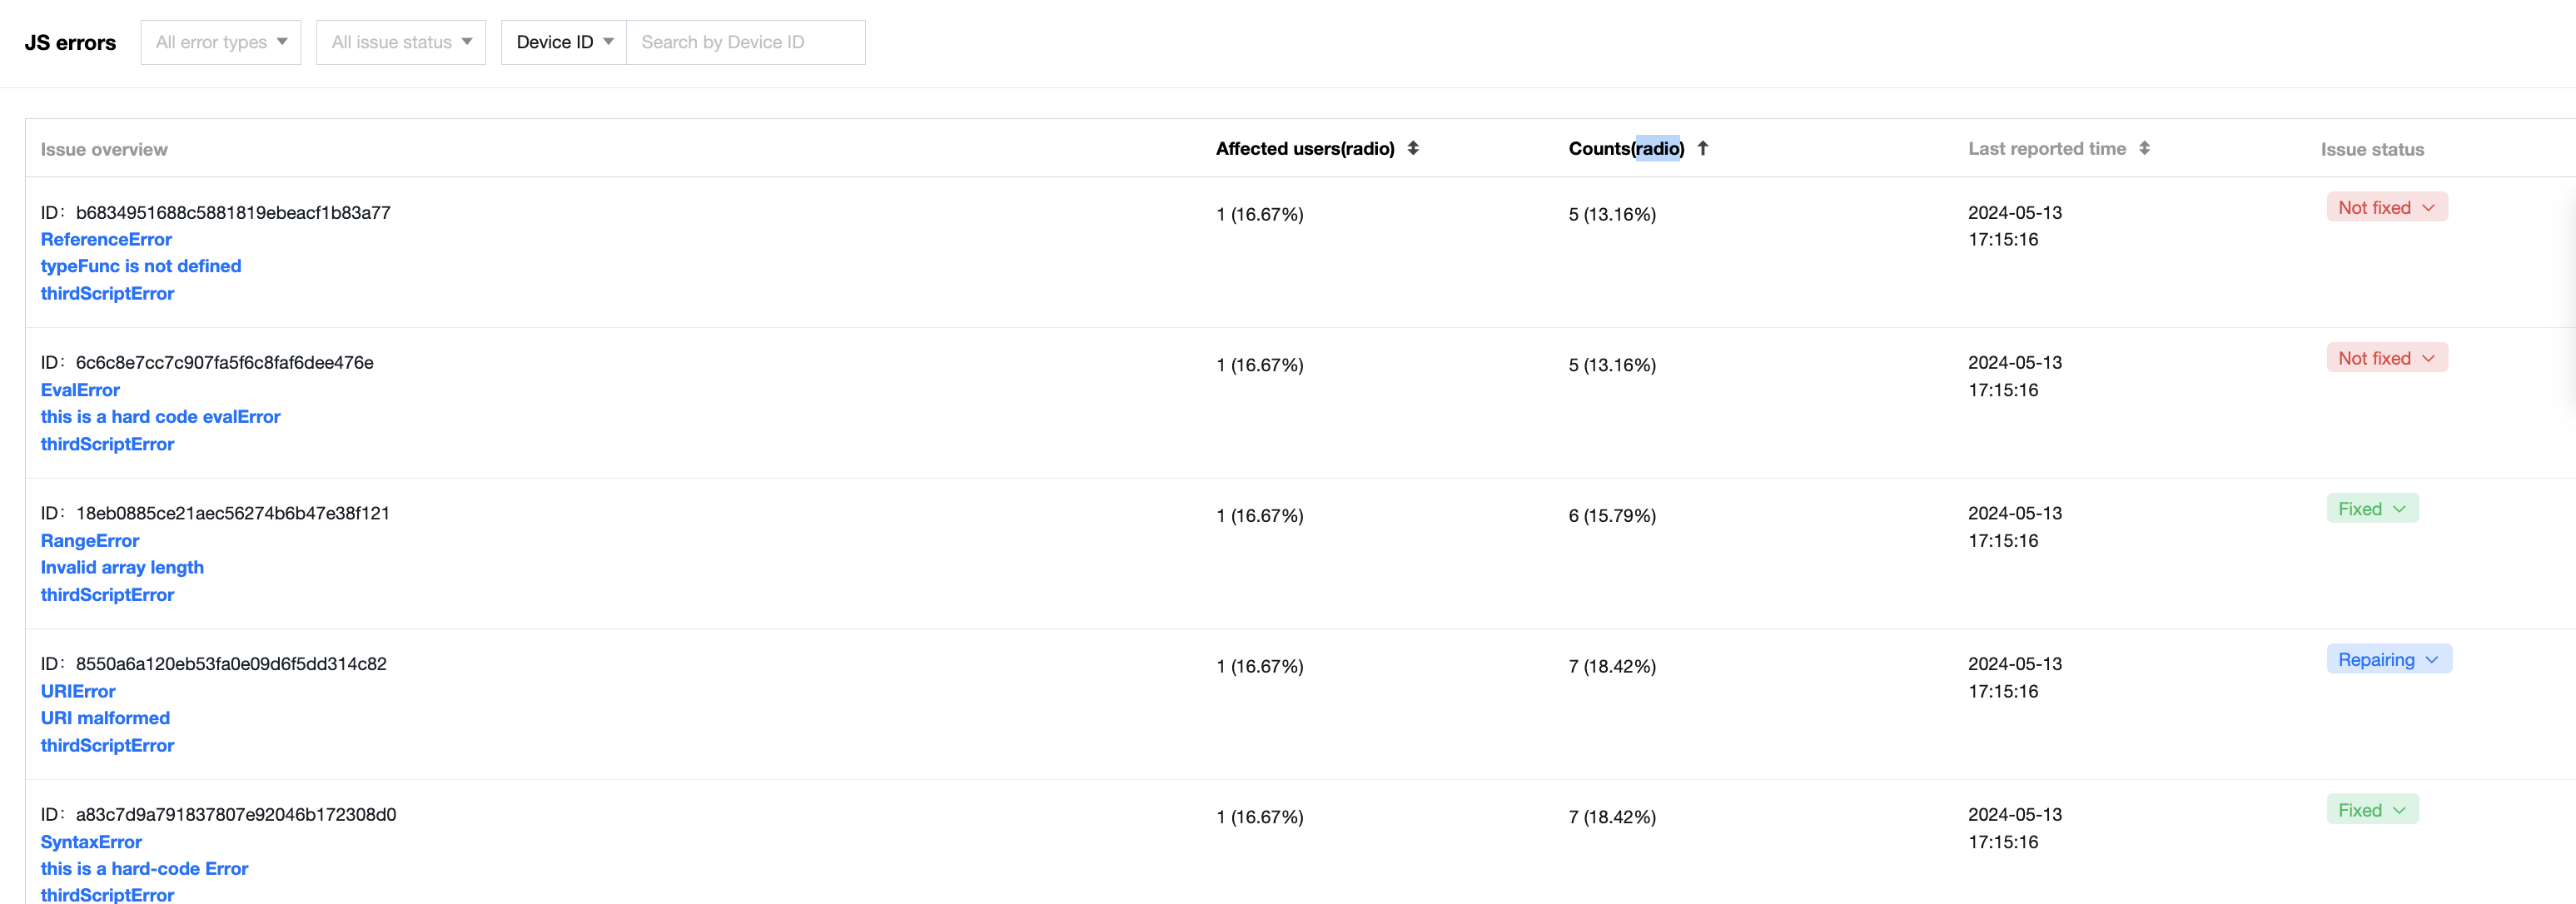
QAPM will extract the issue characteristics based on the stack information and aggregate similar issues according to Tencent's performance optimization experience. Each row in the list represents a separate performance issue.
In the list of JS errors, you can set the error type, issue status, device ID, user ID, or issue ID as a filter, which takes effect only for the list.
The issue list also allows you to sort data by the number of affected users, occurrences, or the last report time.
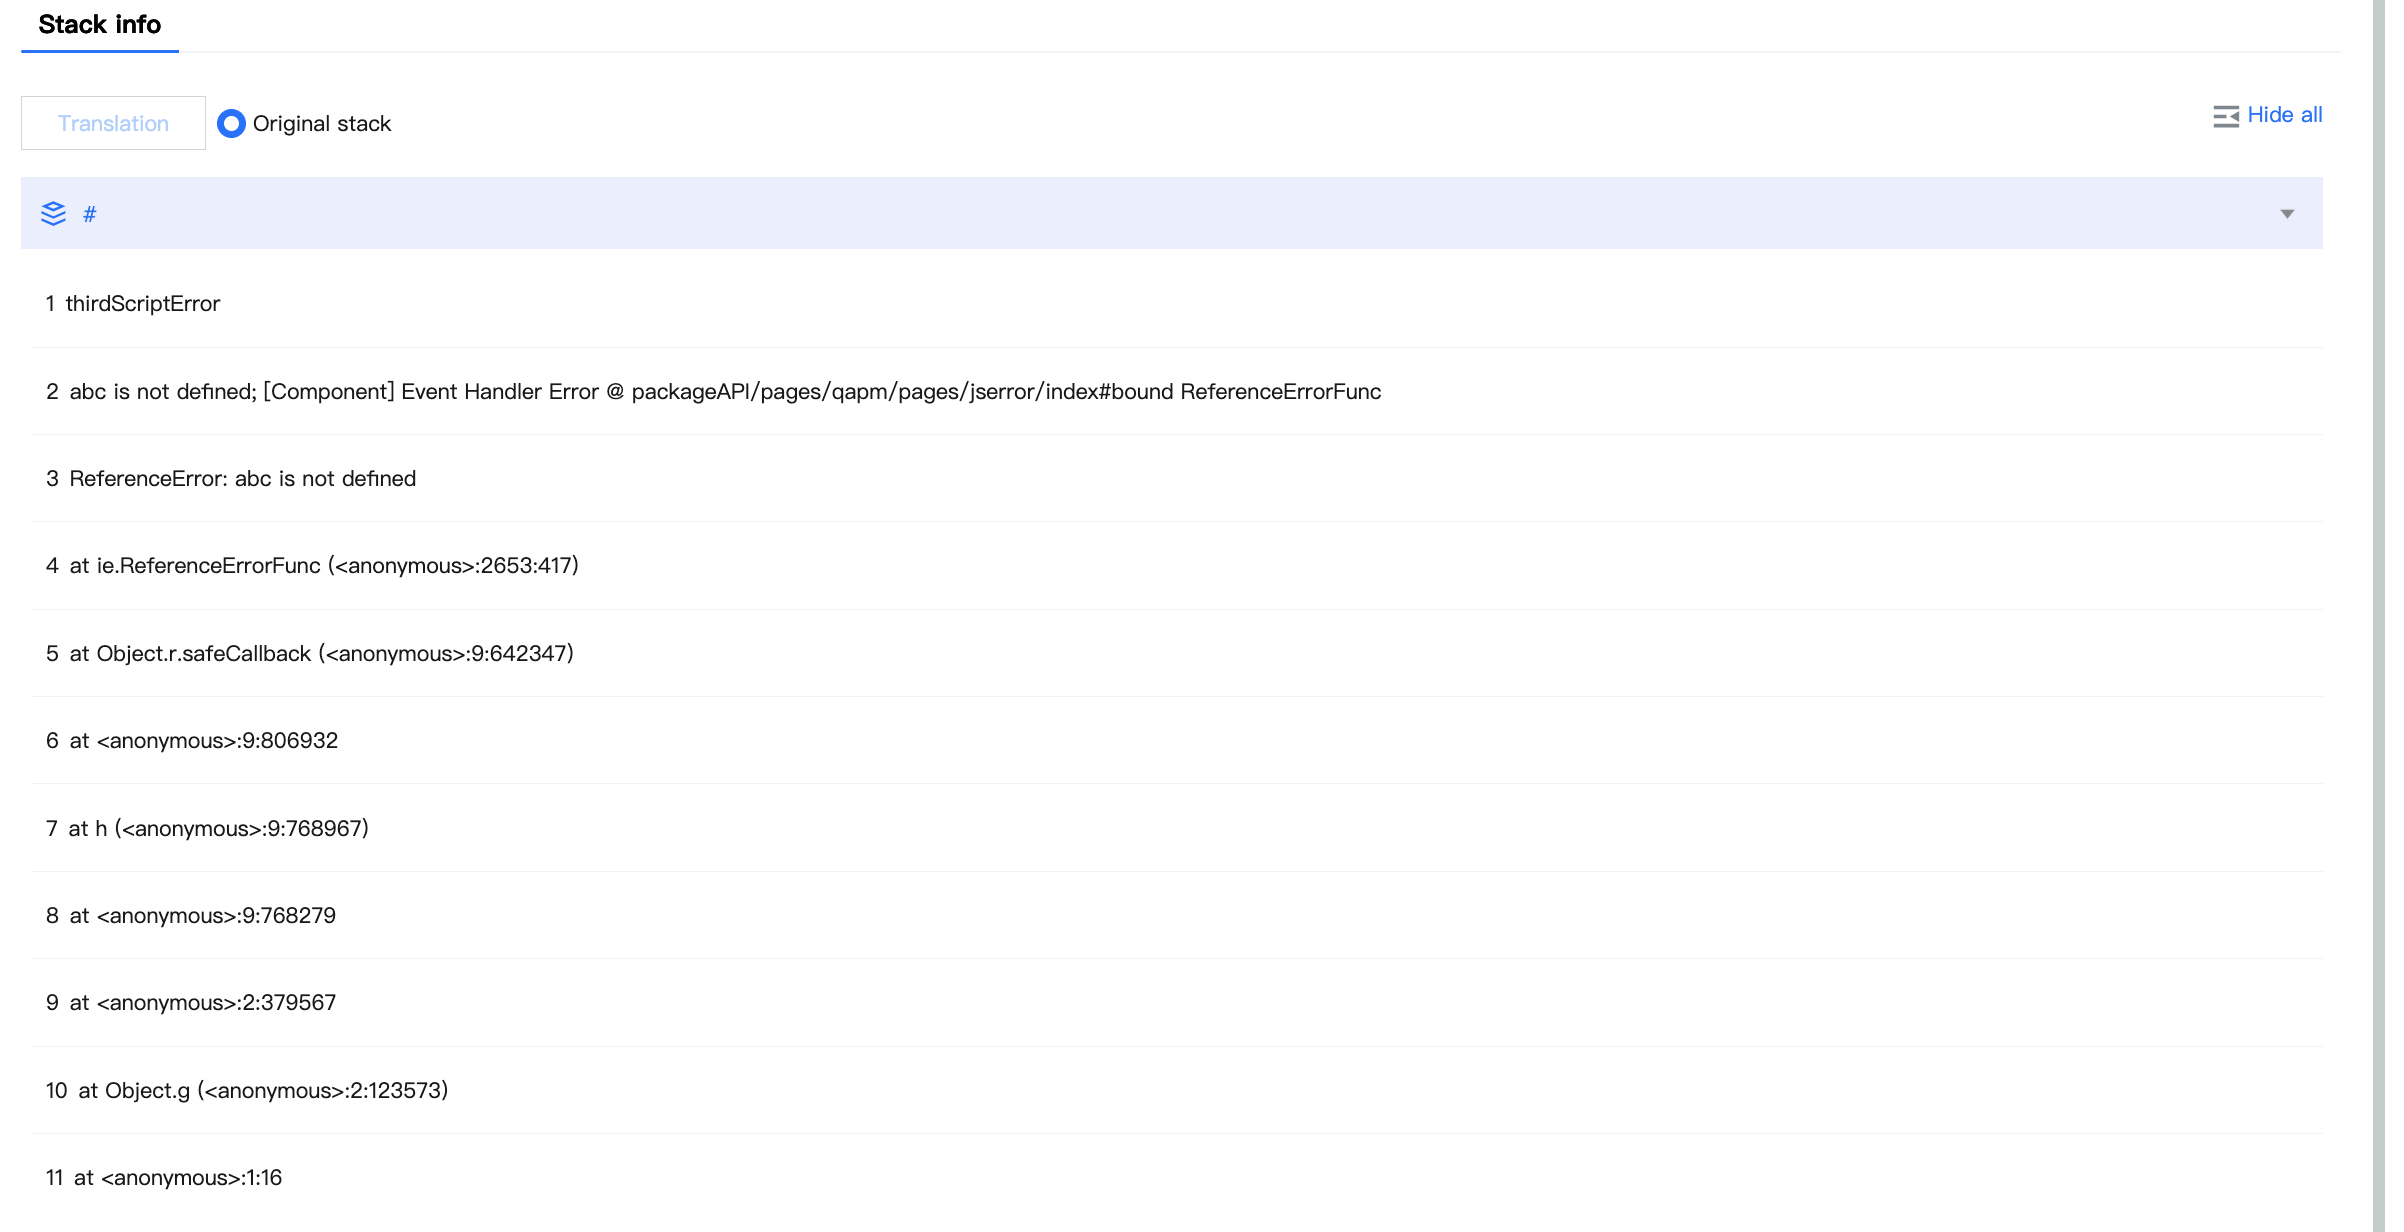
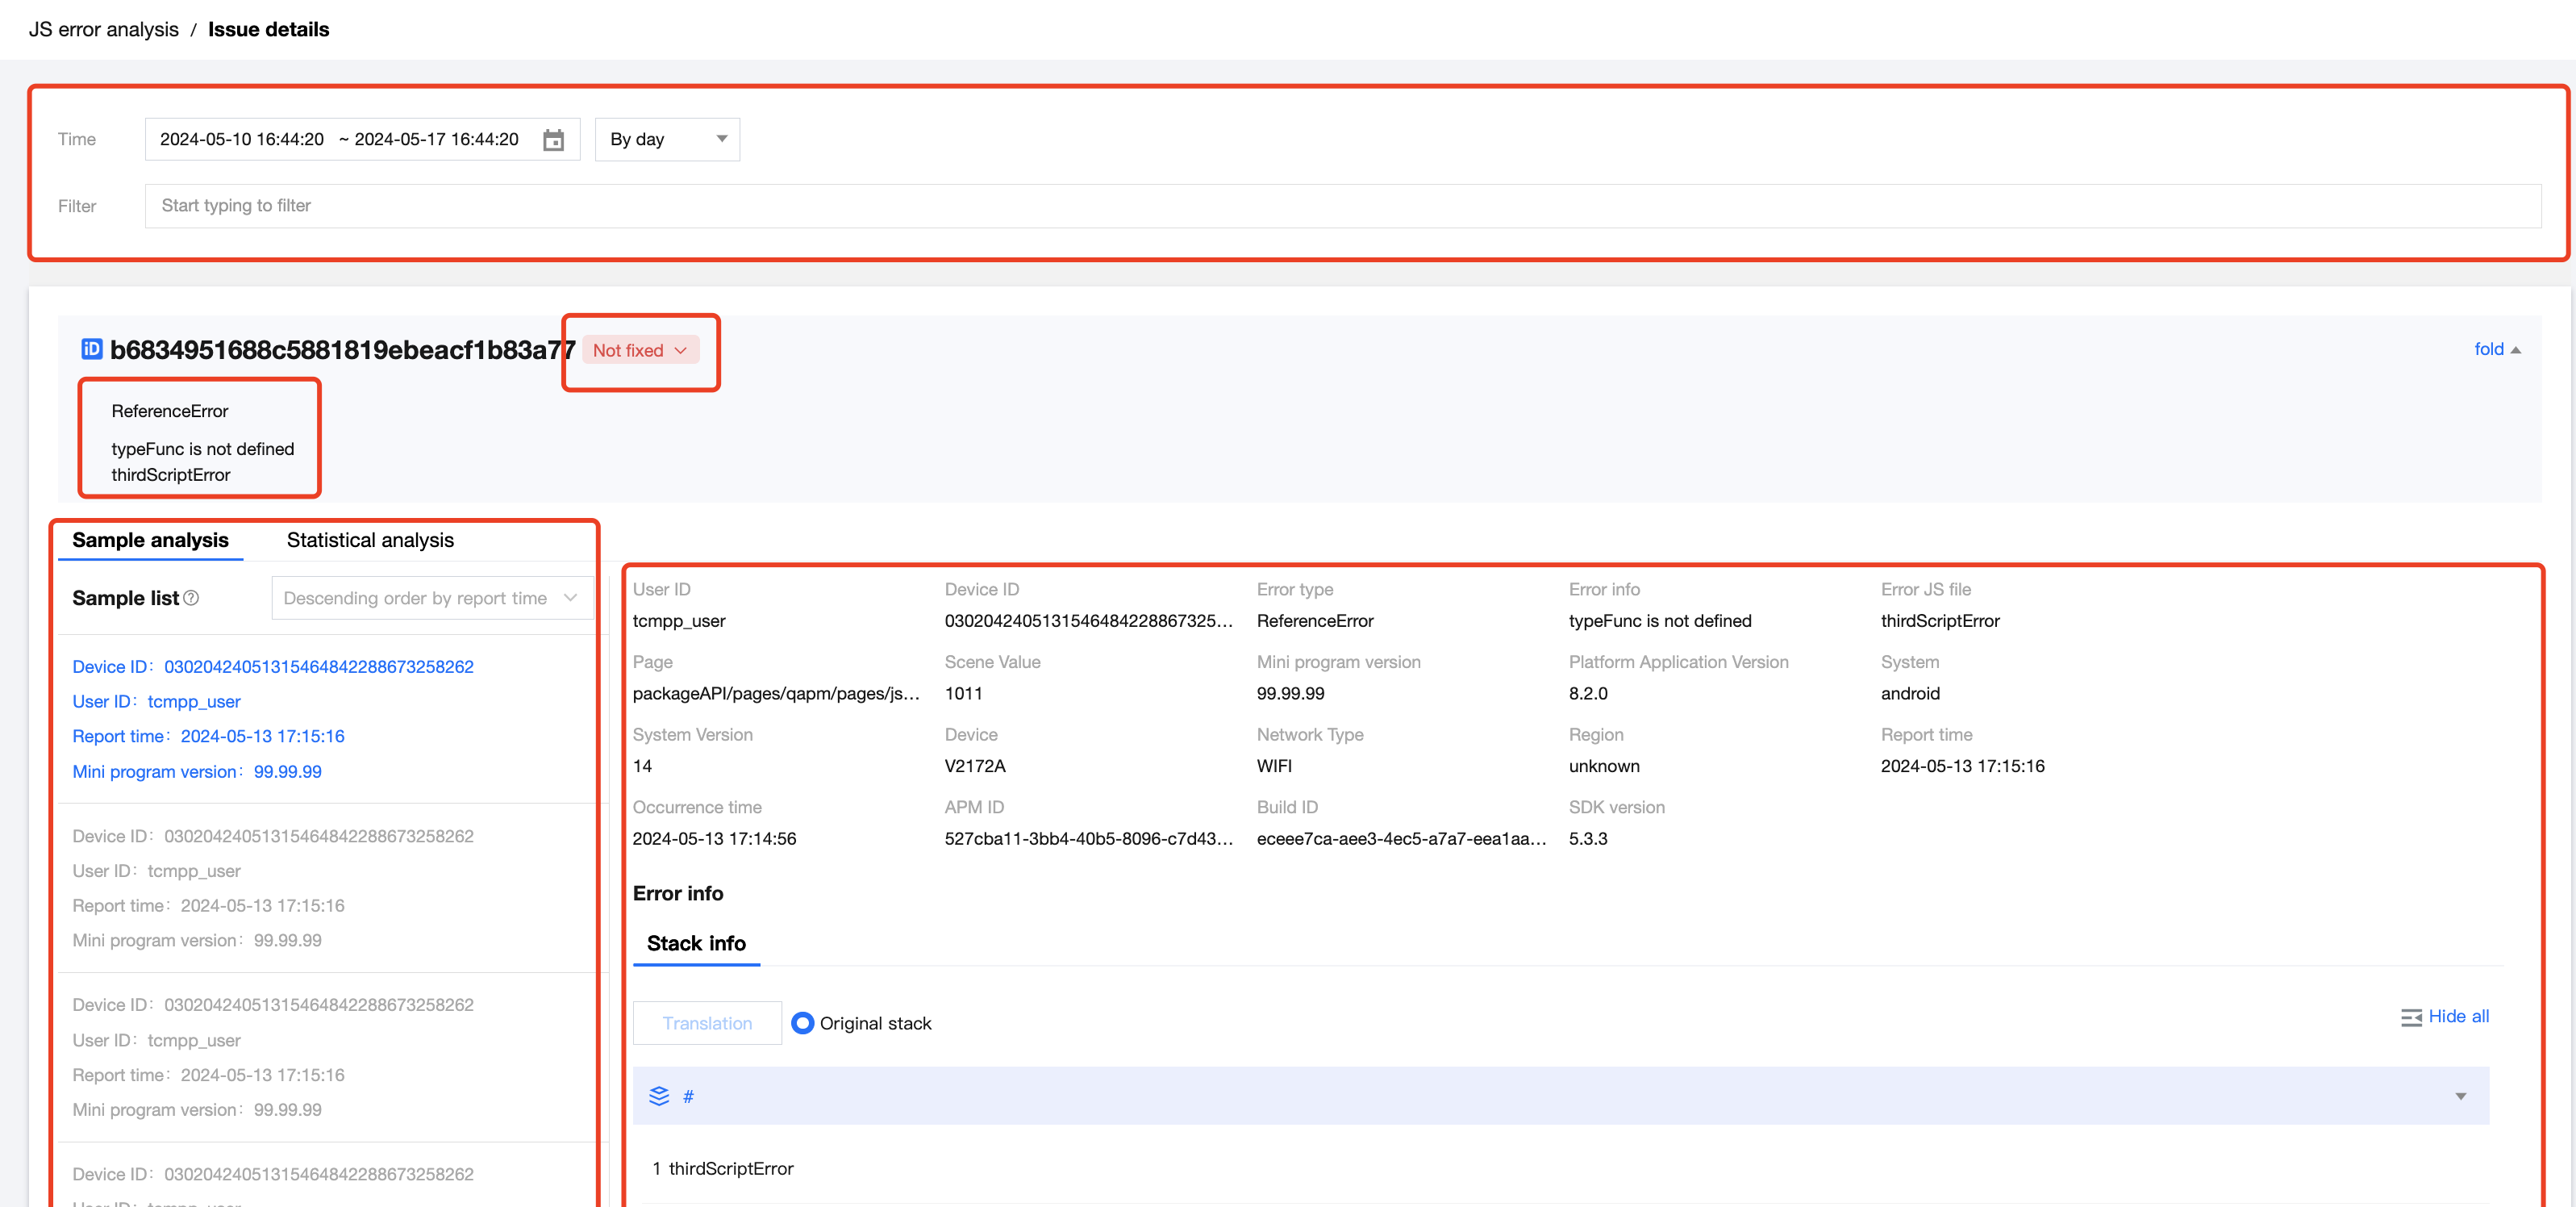
5.2.6 Issue details
On the issue details page, you can view the different sample data of a JS error and click a sample in the sample list to switch between samples. You can also filter samples by prioritized dimension.
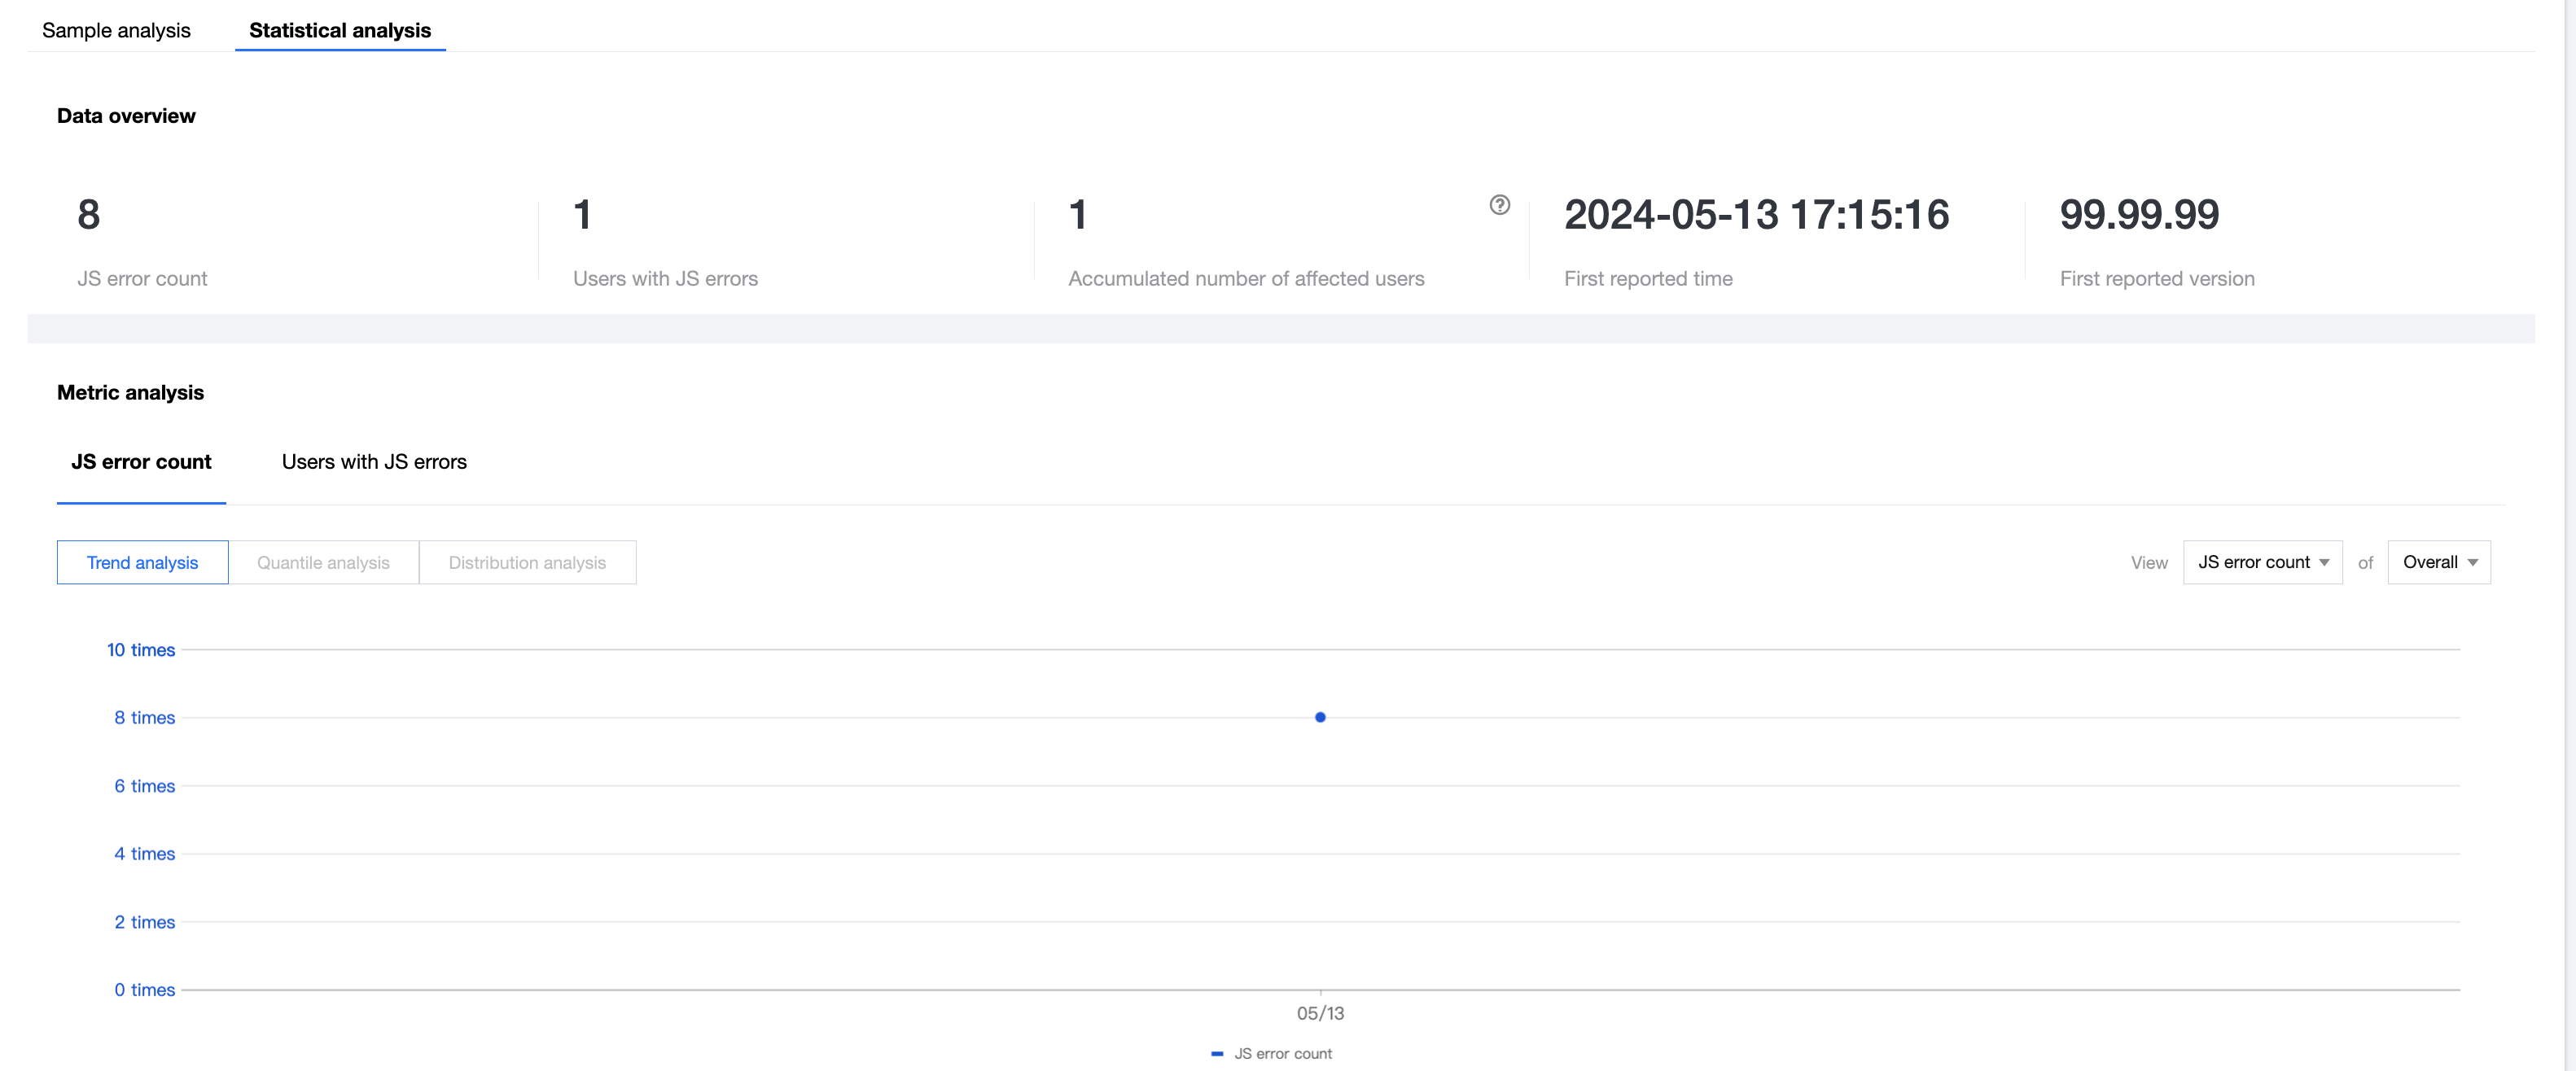
The statistical analysis capability of JS error analysis allows you to view the issue's trends of number of JS times and number of JS-affected users. You can also use combined analysis to obtain more issue statistics.
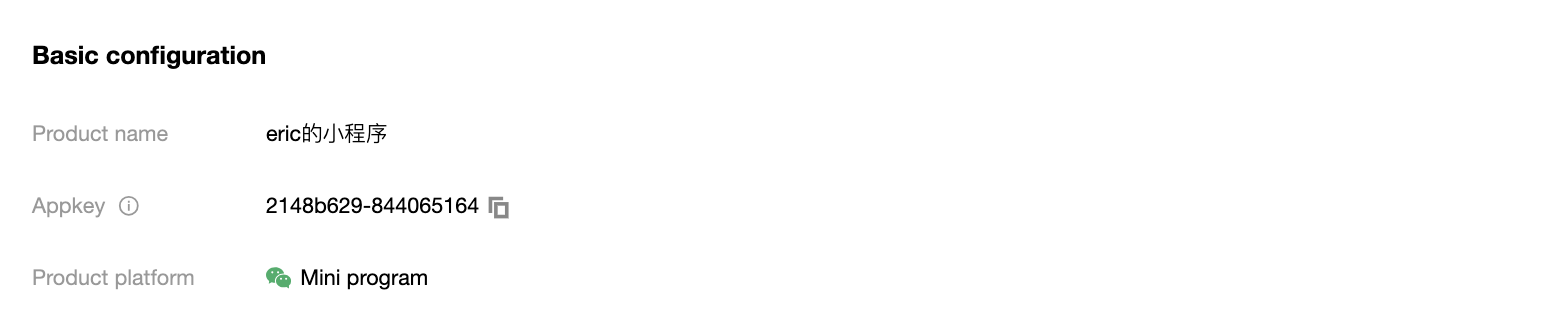
6. Product configuration
6.1. Basic configuration
The basic configuration section displays basic product information, such as the product name, AppKey, and product platform.
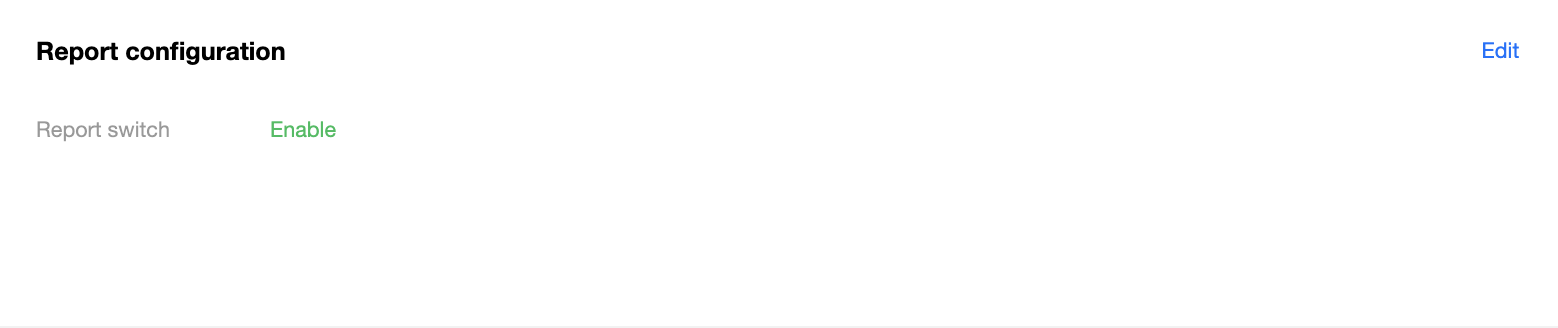
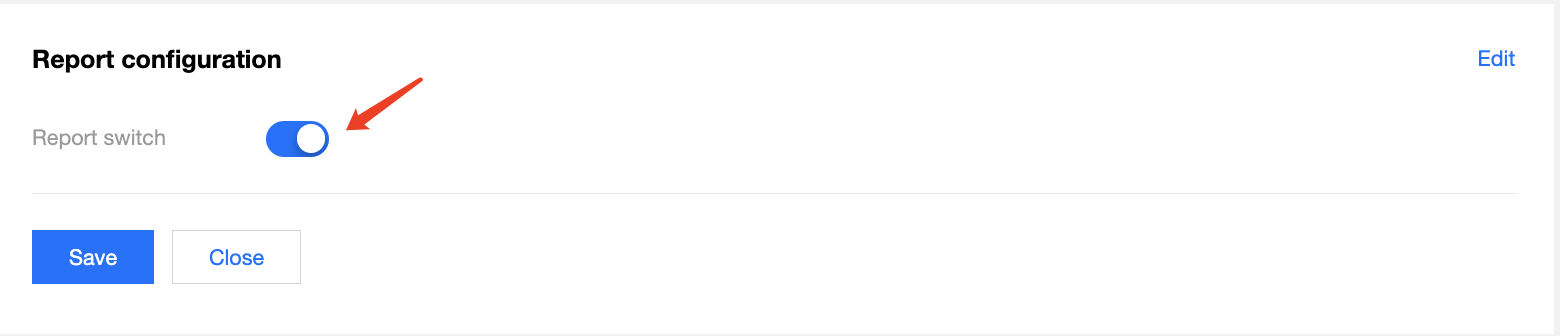
6.2. Reporting configuration
Report configuration allows you to toggle on or off the reporting switch.
Click "Edit" to edit the report configuration, where you can configure the report switch.
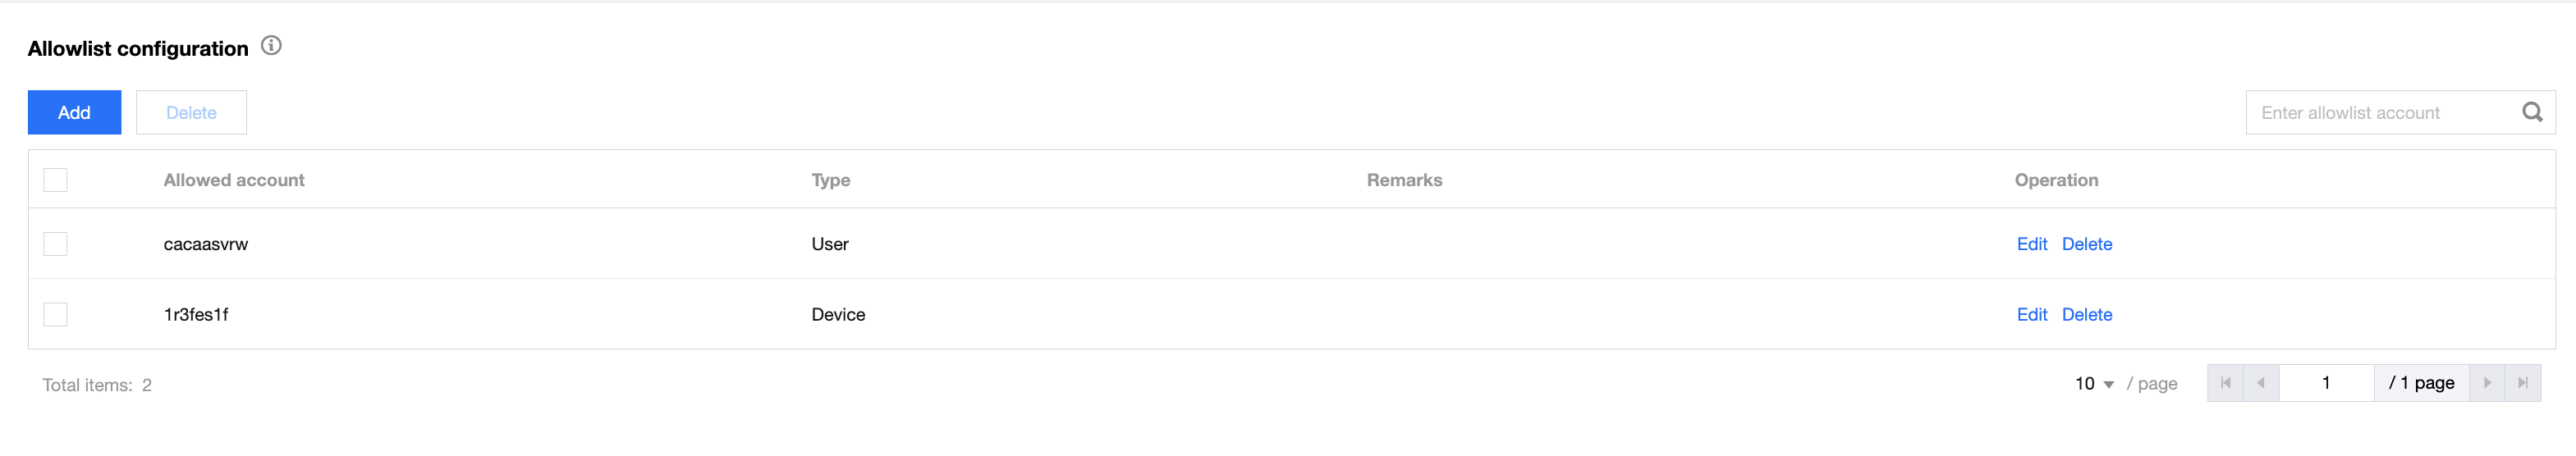
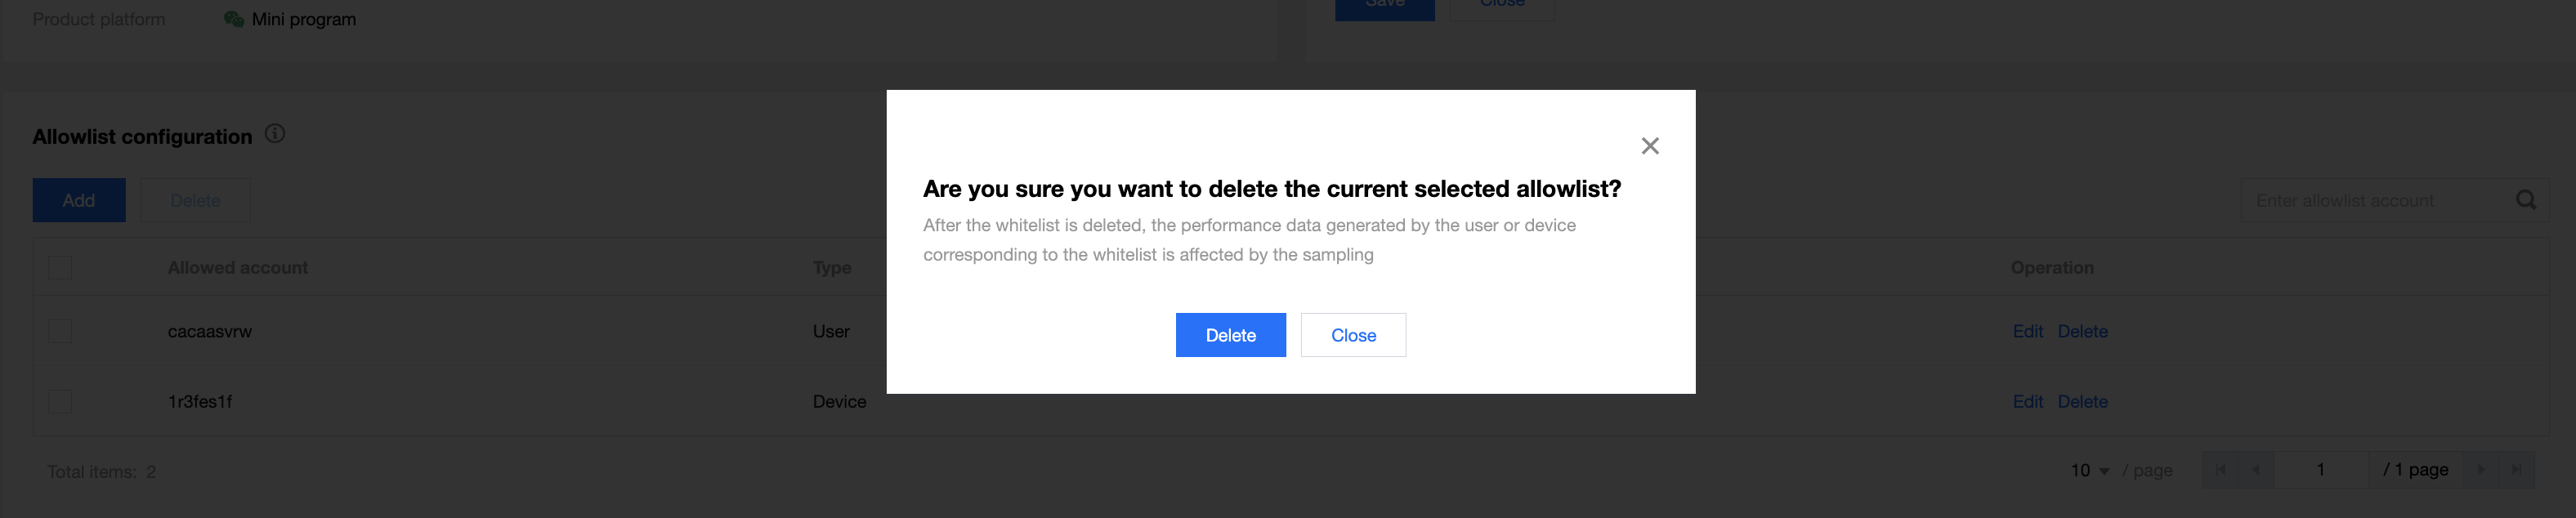
6.3. Allowlist configuration
Complete data will be reported and all monitoring features will be enabled for users in the allowlist. We recommend you add tested or followed accounts or devices to the allowlist.
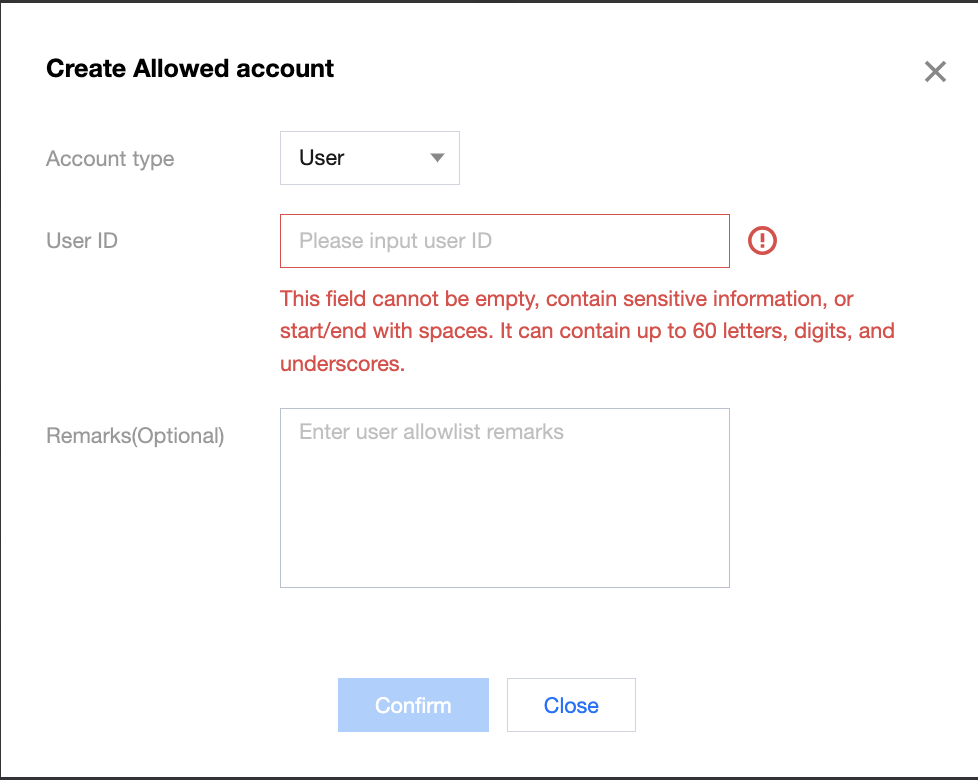
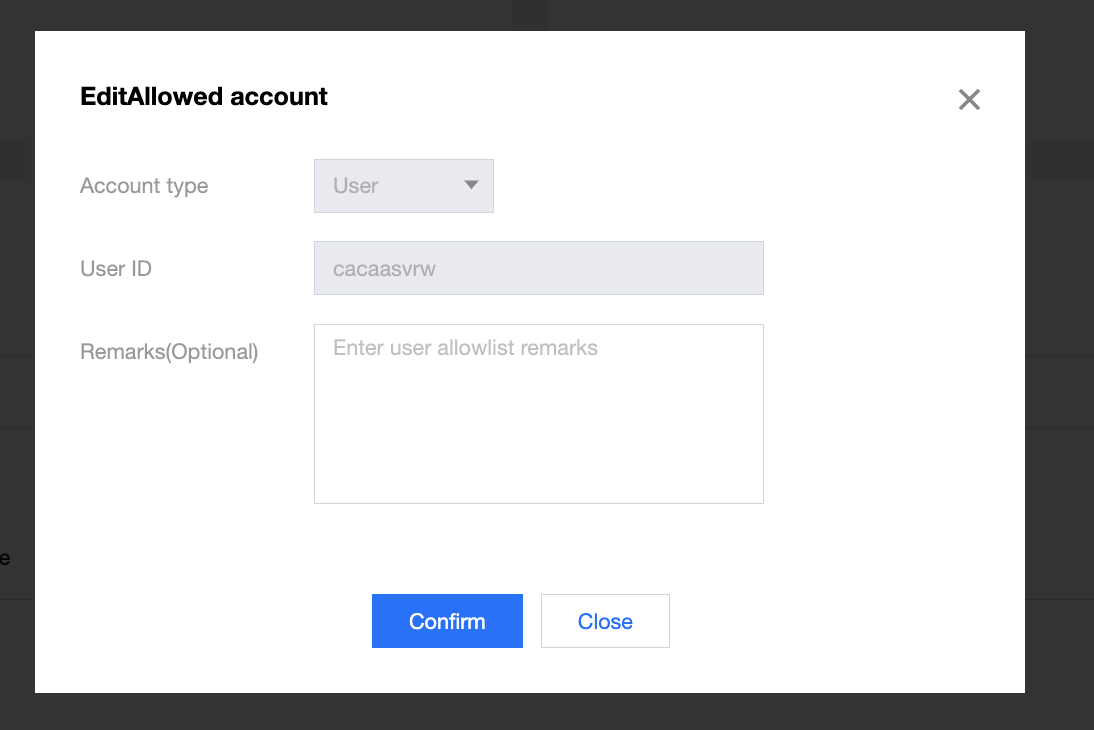
Adding accounts to the allowlist
Verification requirements for accounts added to the allowlist: This field cannot be empty, contain sensitive characters, or start/end with spaces. It can contain up to 60 letters, numbers, and underscores.


 Yes
Yes
 No
No
Was this page helpful?