The main debugging areas include the simulator, debugging tools, and the mini program operation area.
Simulator
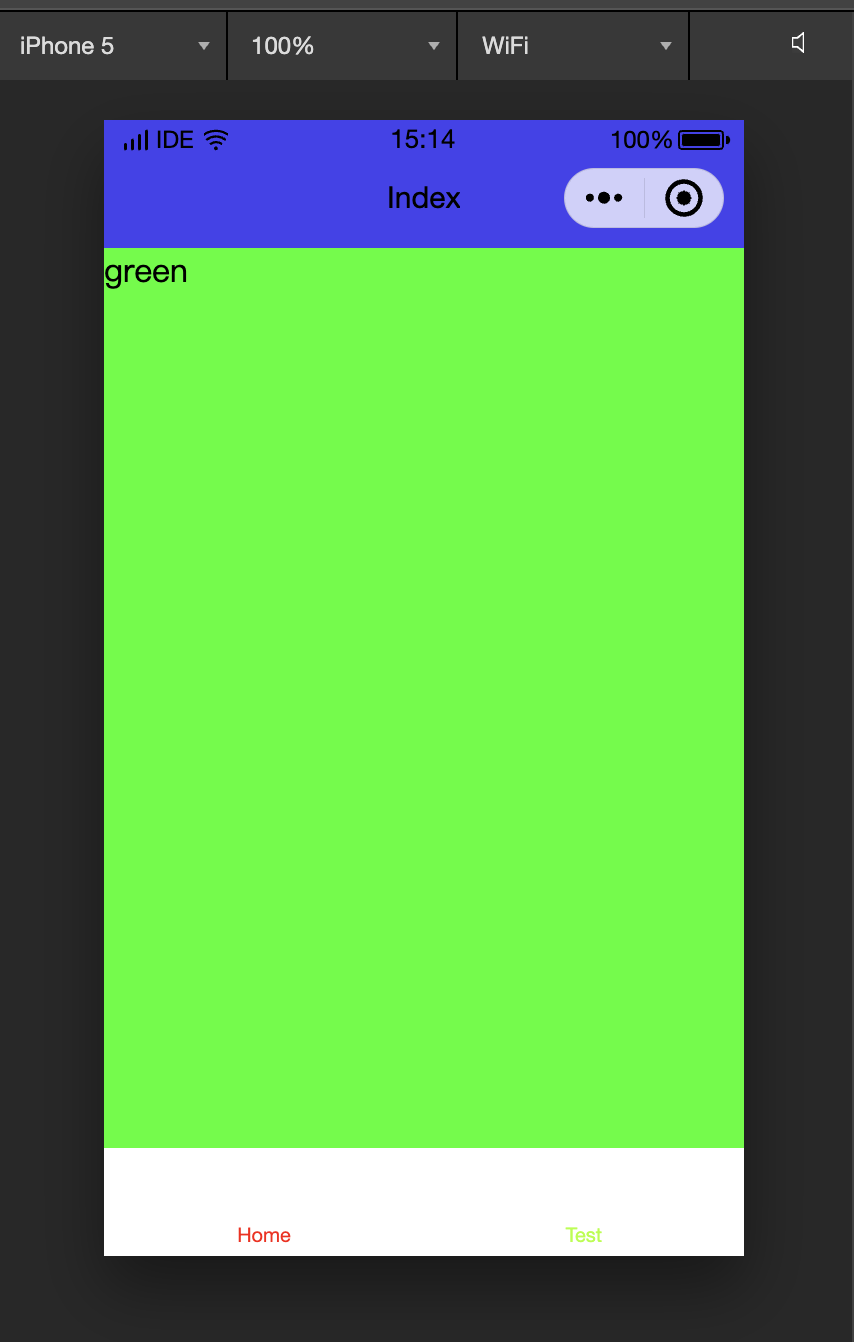
The simulator mimics the real behavior of the mini program on a client, accurately presenting most APIs.
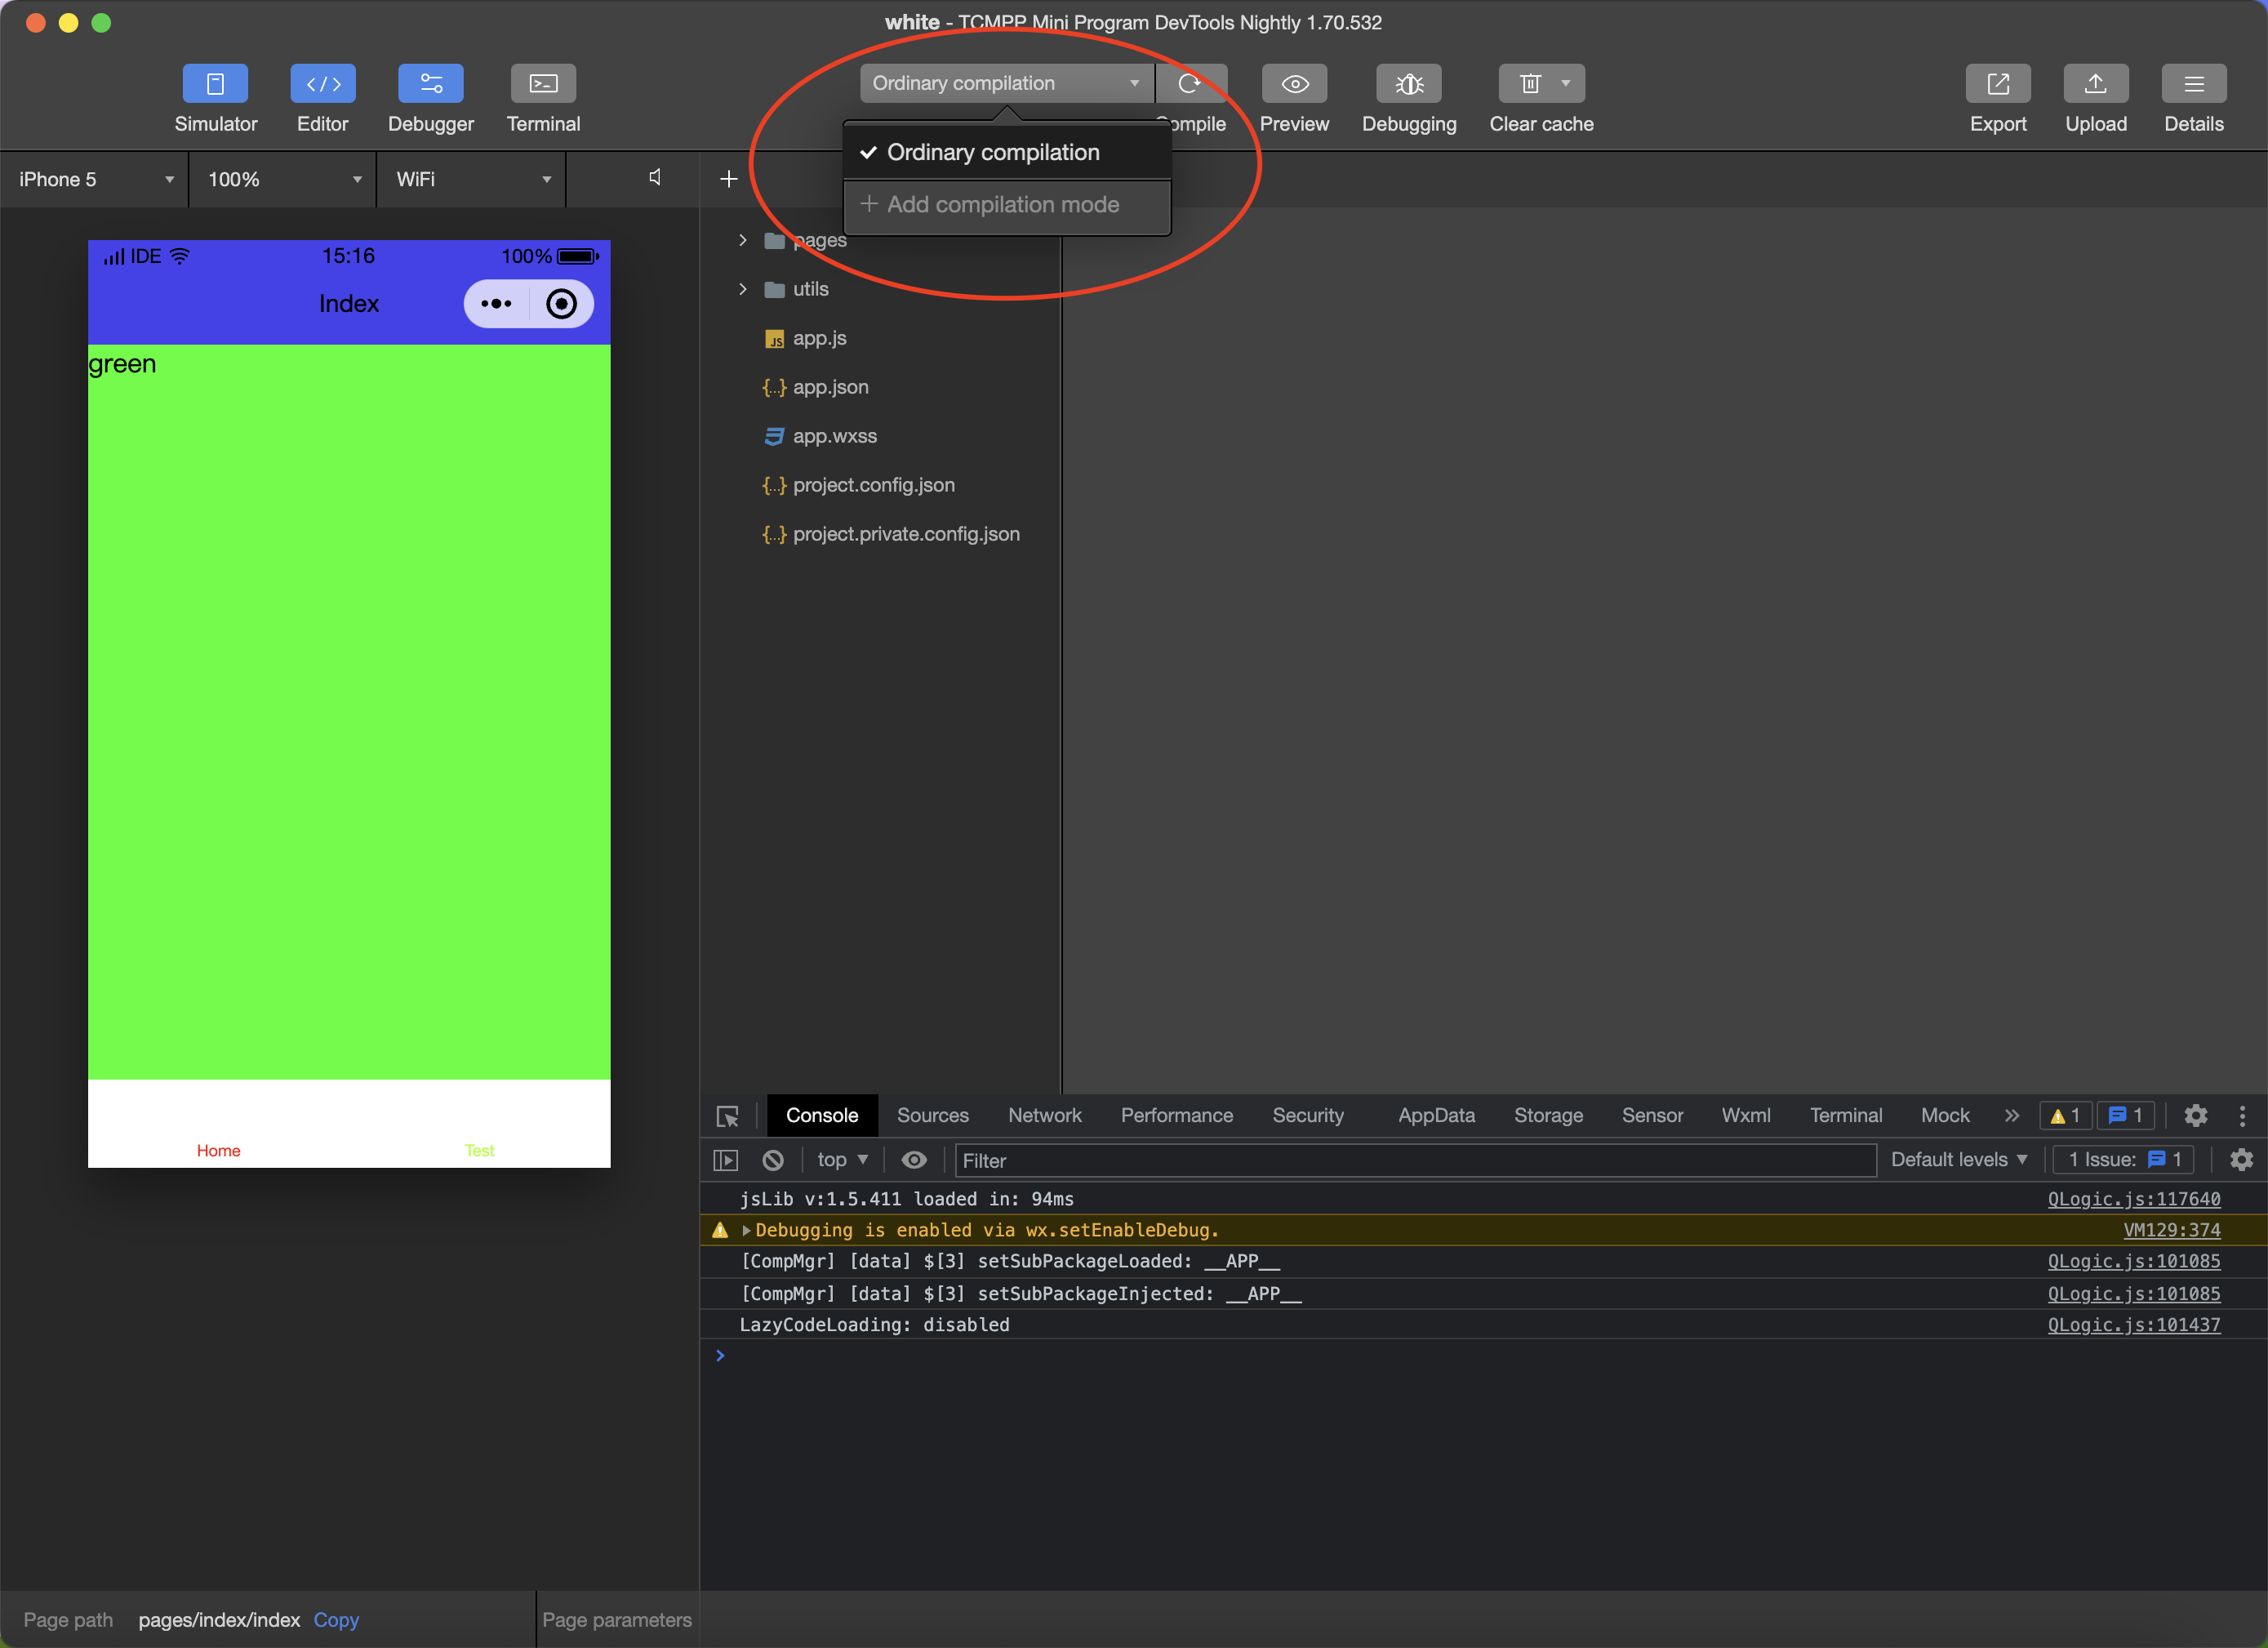
Custom compilation
Click the compile button in the toolbar or use the shortcut Ctrl (⌘) + B to compile the current code and automatically refresh the simulator.
Developers can add or select existing custom compile conditions to debug specific pages with different parameters.
Note:
Compile conditions are project-specific and can be saved for each project.
Debugging tool
The debugging tools are divided into nine functional modules: WXML, Console, Sources, Network, Appdata, Storage, Sensor, Mock, and Compatibility.
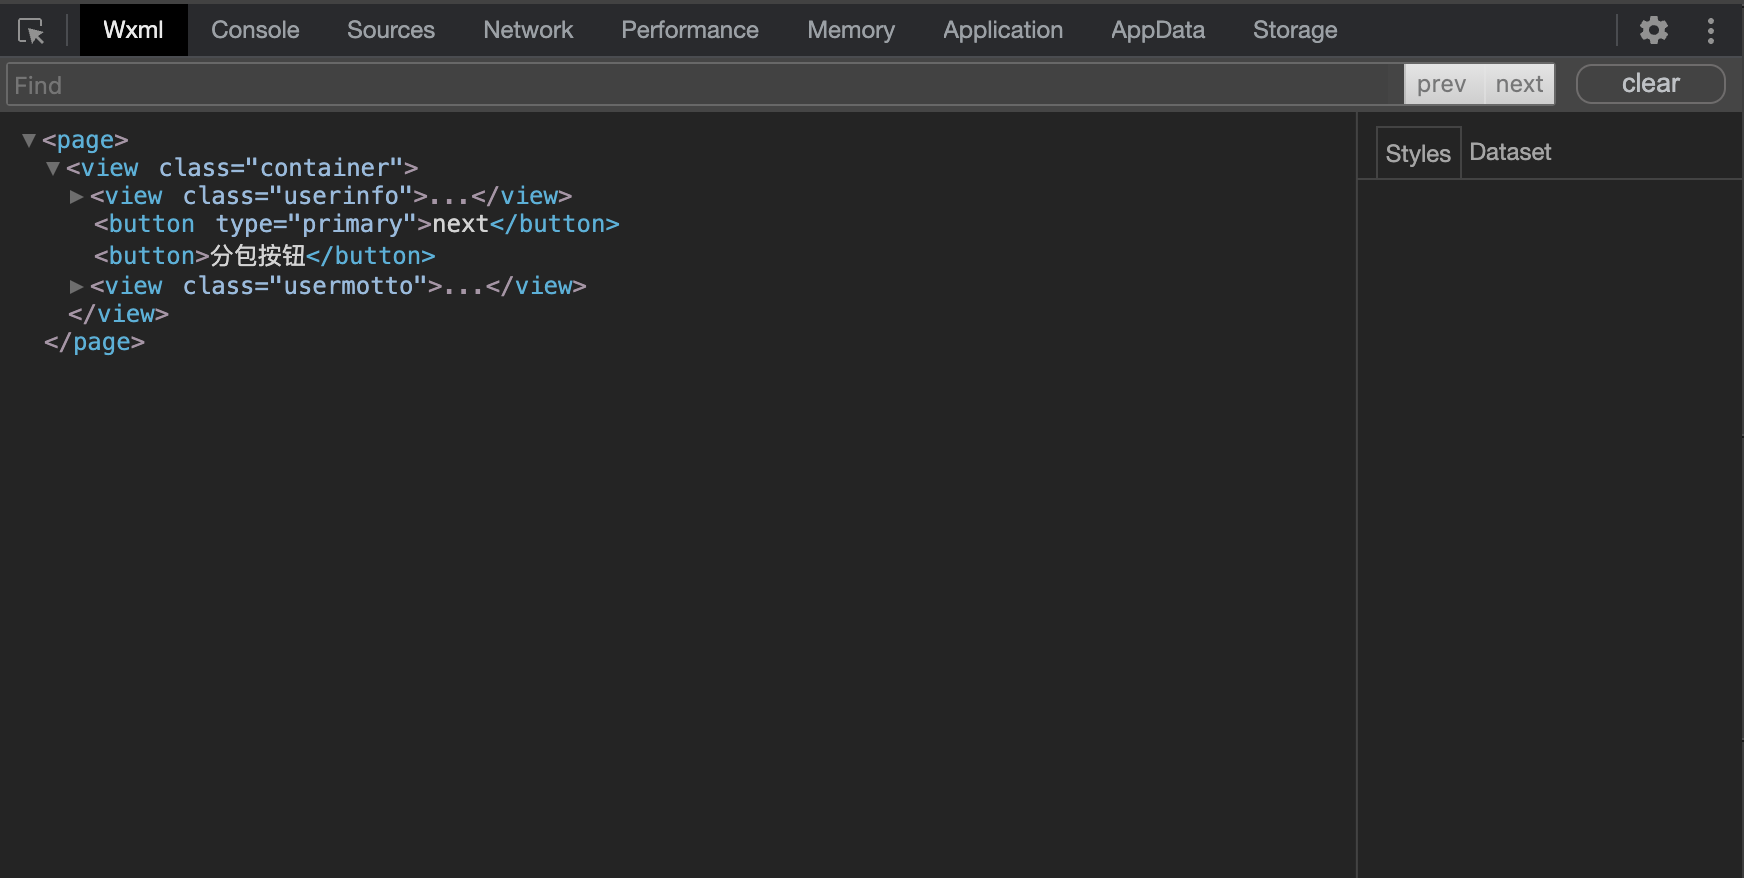
Wxml panel
This helps developers see the transformed Wxml interface, showing the real page structure and corresponding WXSS properties. You can modify WXSS properties and see changes in real-time in the simulator (changes are not saved to the file). The selector in the top left of the debugging module allows quick location of WXML code for page components.
Console panel
The Console panel has two main features:
Developers can input and debug code here.
Errors from the mini program are displayed here.
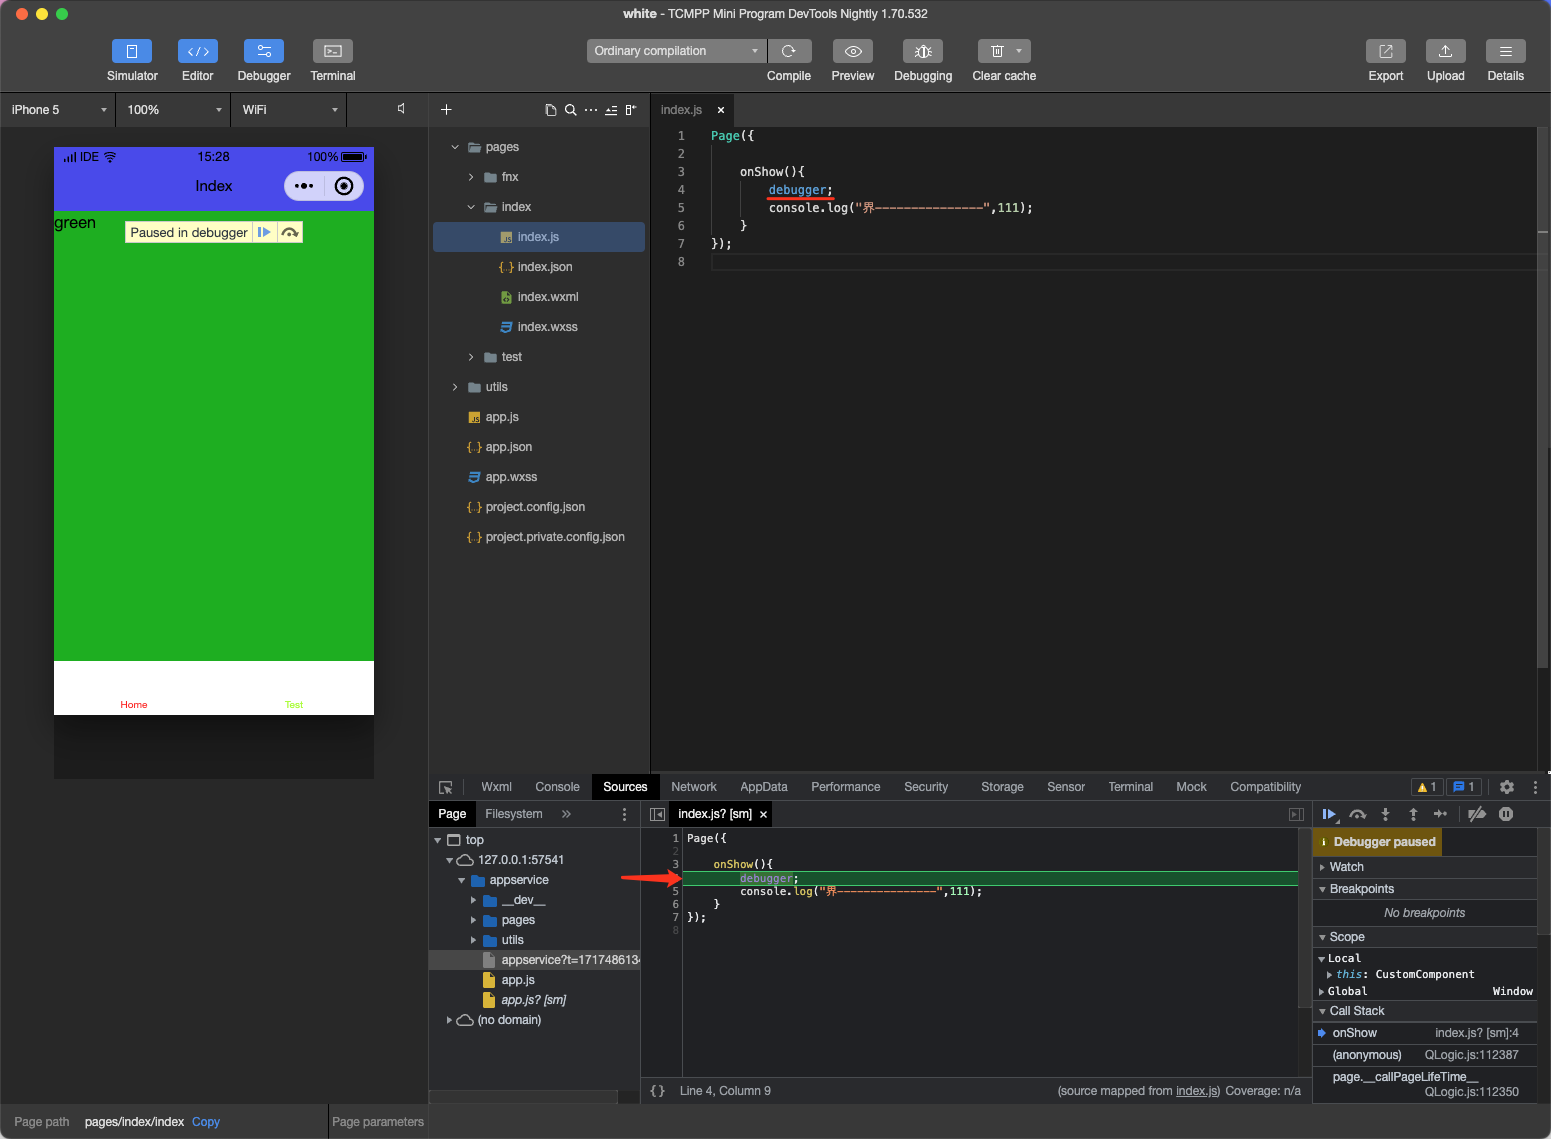
Source panel
This is used to display the script files of the current project. Unlike browser development, the mini program framework compiles script files, so the files shown in the Sources panel are processed scripts. Developer code is wrapped in a define function, and Page code includes a require call at the end.
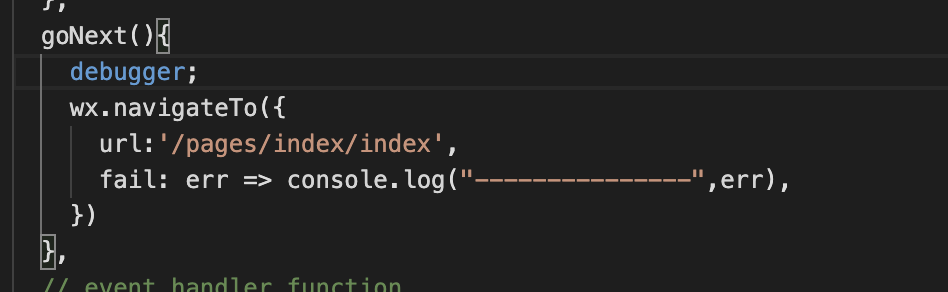
Developers can add debugger in the code to set breakpoints.
Network Panel
The Network Panel is used to observe and display request and socket request statuses.
Appdata Panel
The AppData panel is used to show the specific data of the mini program's AppData during runtime, reflecting project data in real-time. You can edit data here, and it will be immediately reflected on the interface.
Storage Panel
Storage panel is used to display data stored using wx.setStorage or wx.setStorageSync.
You can delete (using the delete key), add, or modify data directly in the Storage panel.
Sensor Panel
The Sensor panel has two main features:
Developers can simulate geographic location.
Developers can simulate mobile device behavior for debugging gravity sensor APIs.
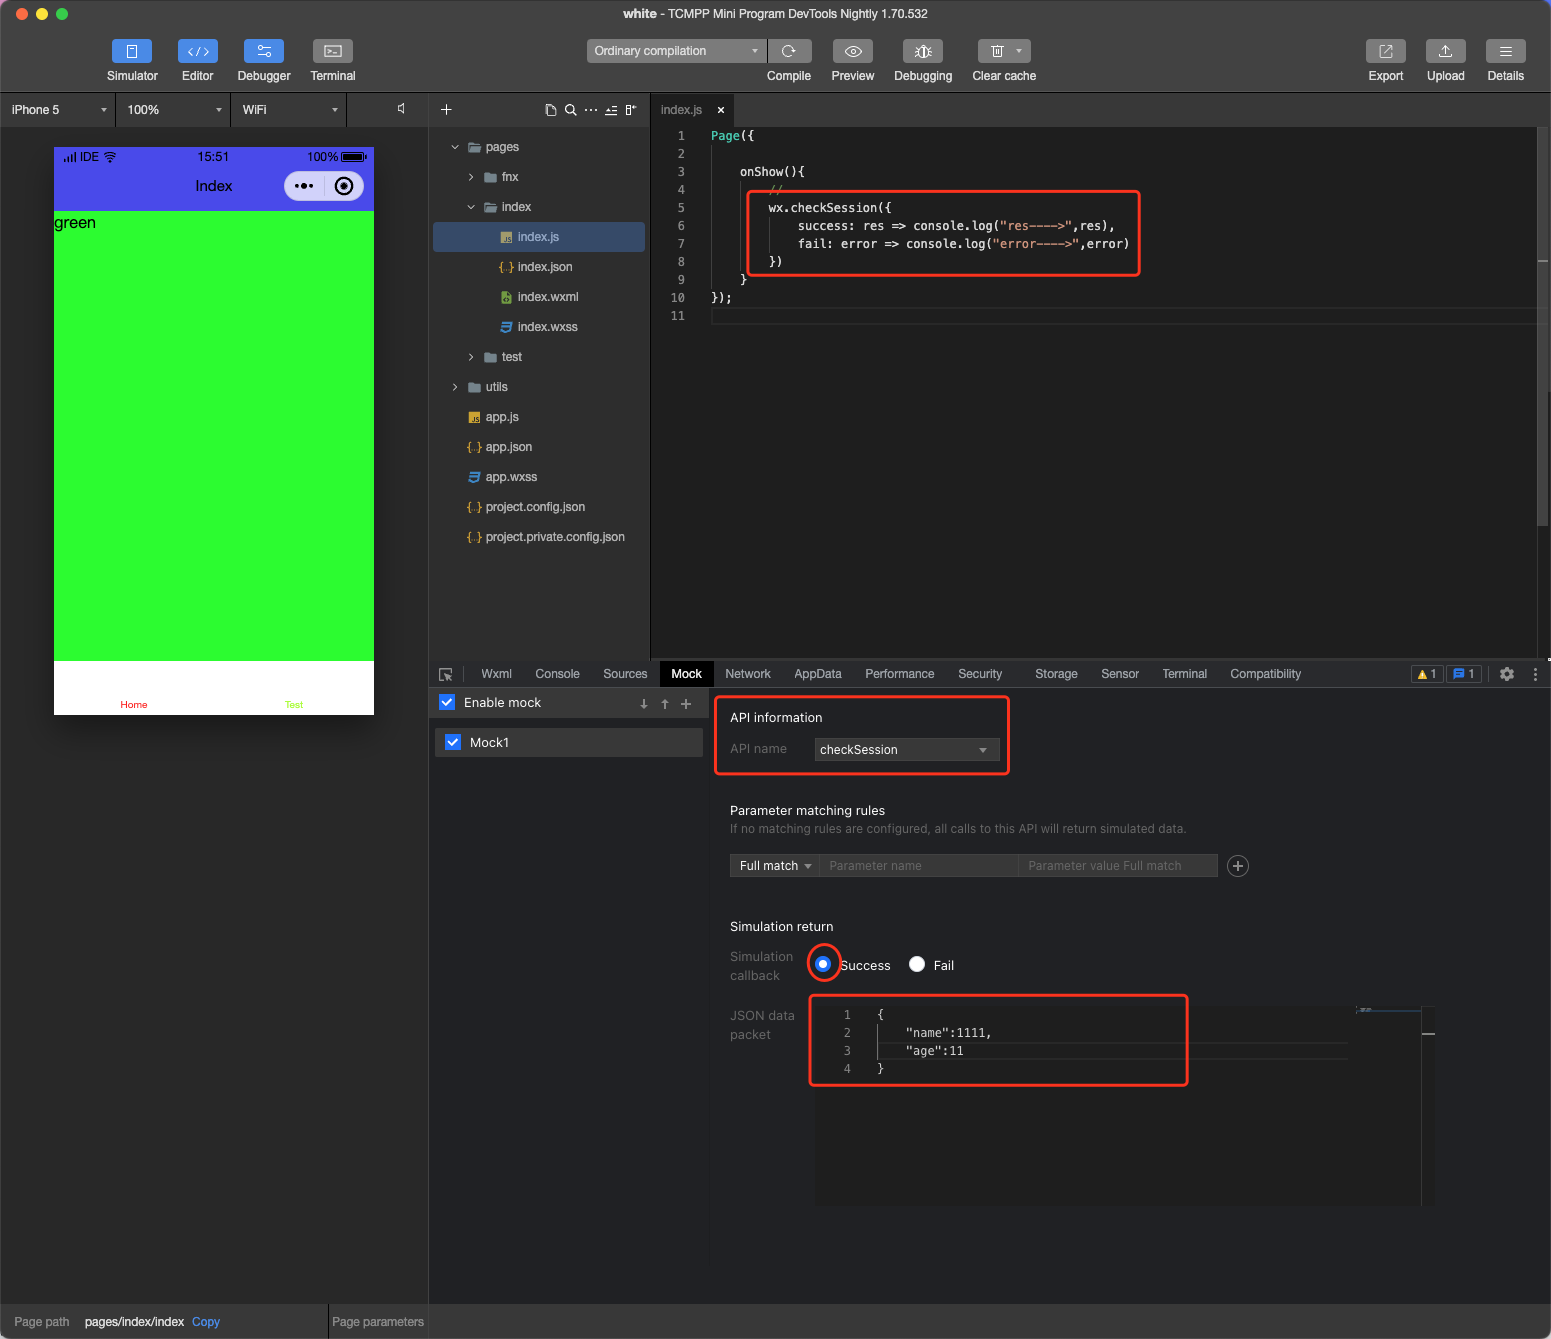
Mock Panel
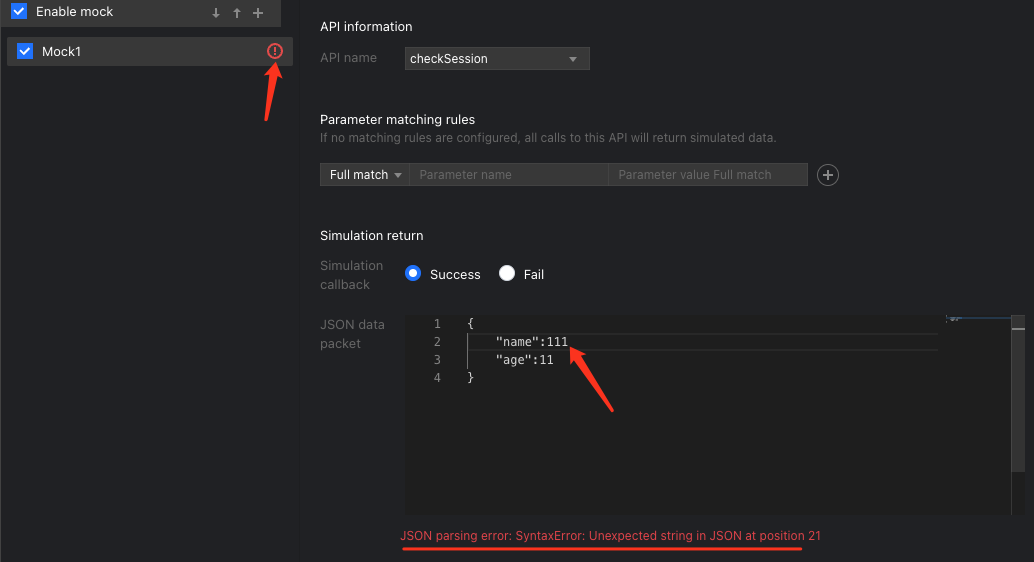
The developer tool provides API Mock capabilities to simulate API call results, useful for developing mini programs.
Developers can mock custom APIs or user information.
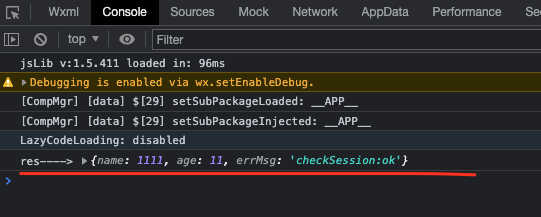
In the following snippet, the checkSession API will be mocked.
If there is a type error during mocking, the mock will fail.
Compatiblity Panel
Mini program migration tool - Compatibility
You can initiate Weixin mini program compatibility checks.
The tool will traverse components, APIs, and JSON files in the mini program, displaying results in the lower window. You can export the results as an Excel file.
Remote debugging
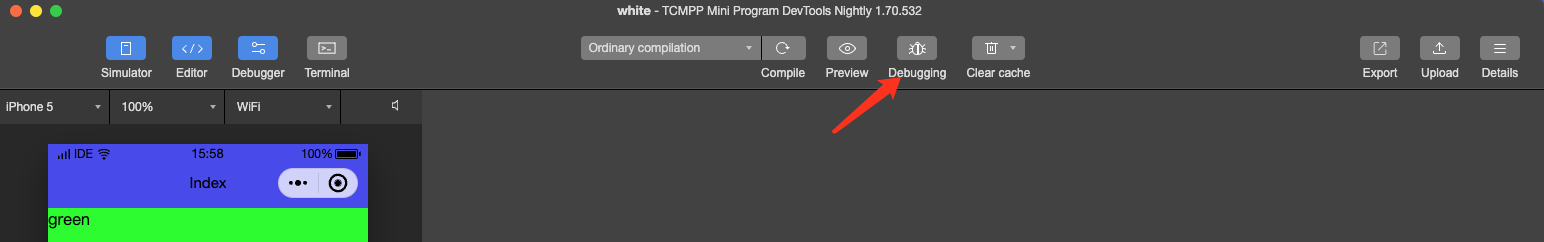
Real device debugging:
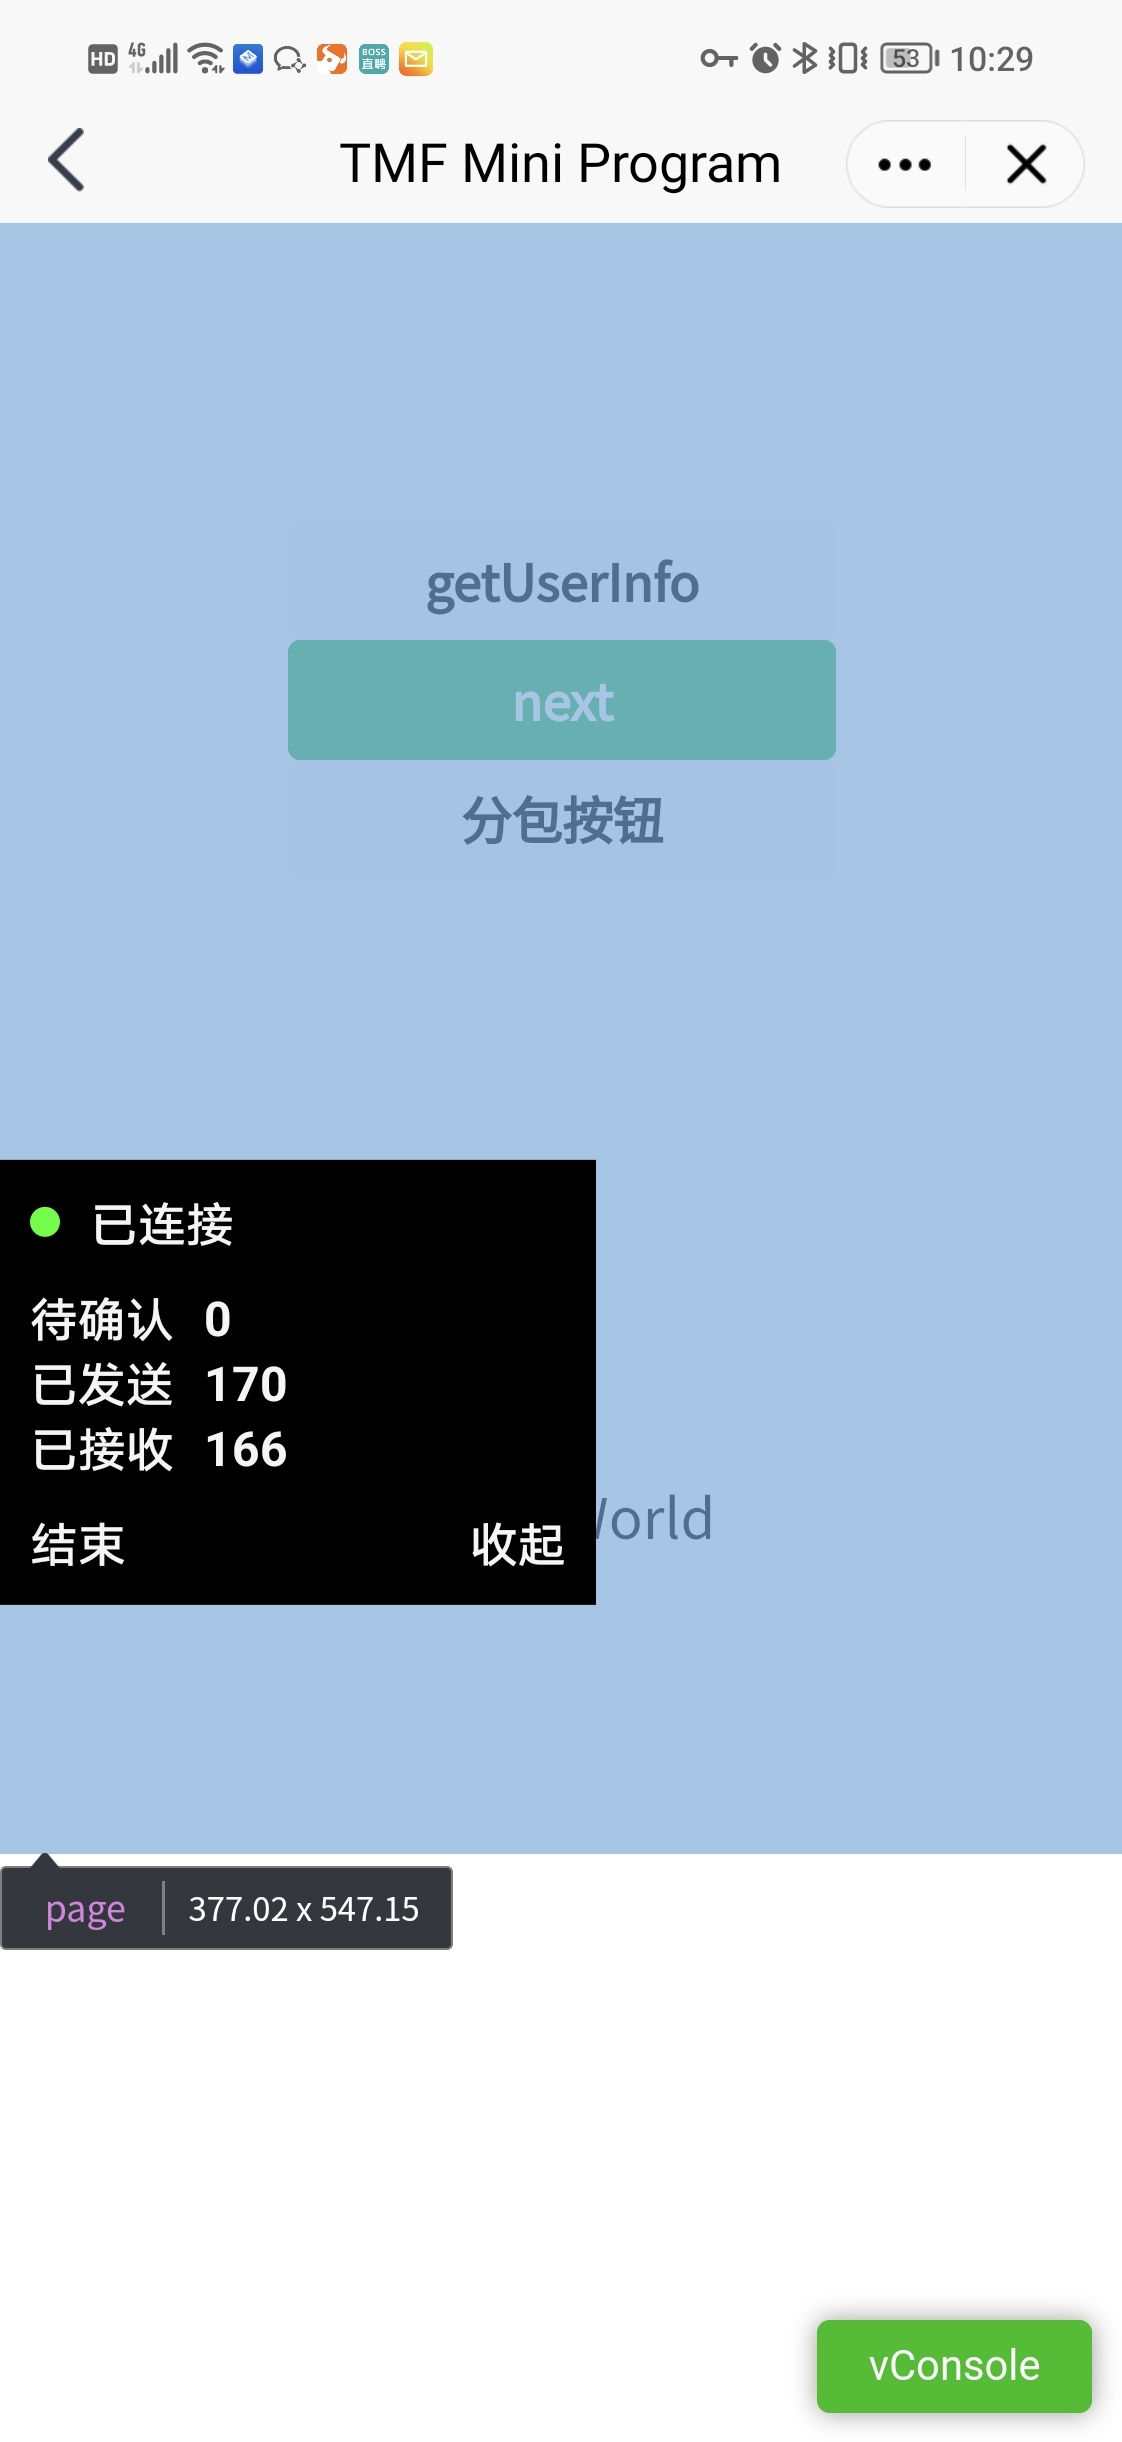
Click "Real device debugging" to process, package, and upload local code. Afterward, scan the QR code with a mobile client to open the debugging window and start real device debugging.
Note:
The versions of Android and iOS SDK must be greater than 1.5.12 for real device debugging.
Use an app with the integrated SDK to scan the QR code to start remote debugging.
To end debugging, close the debugging window or click the "End Debugging" button in the lower right corner.
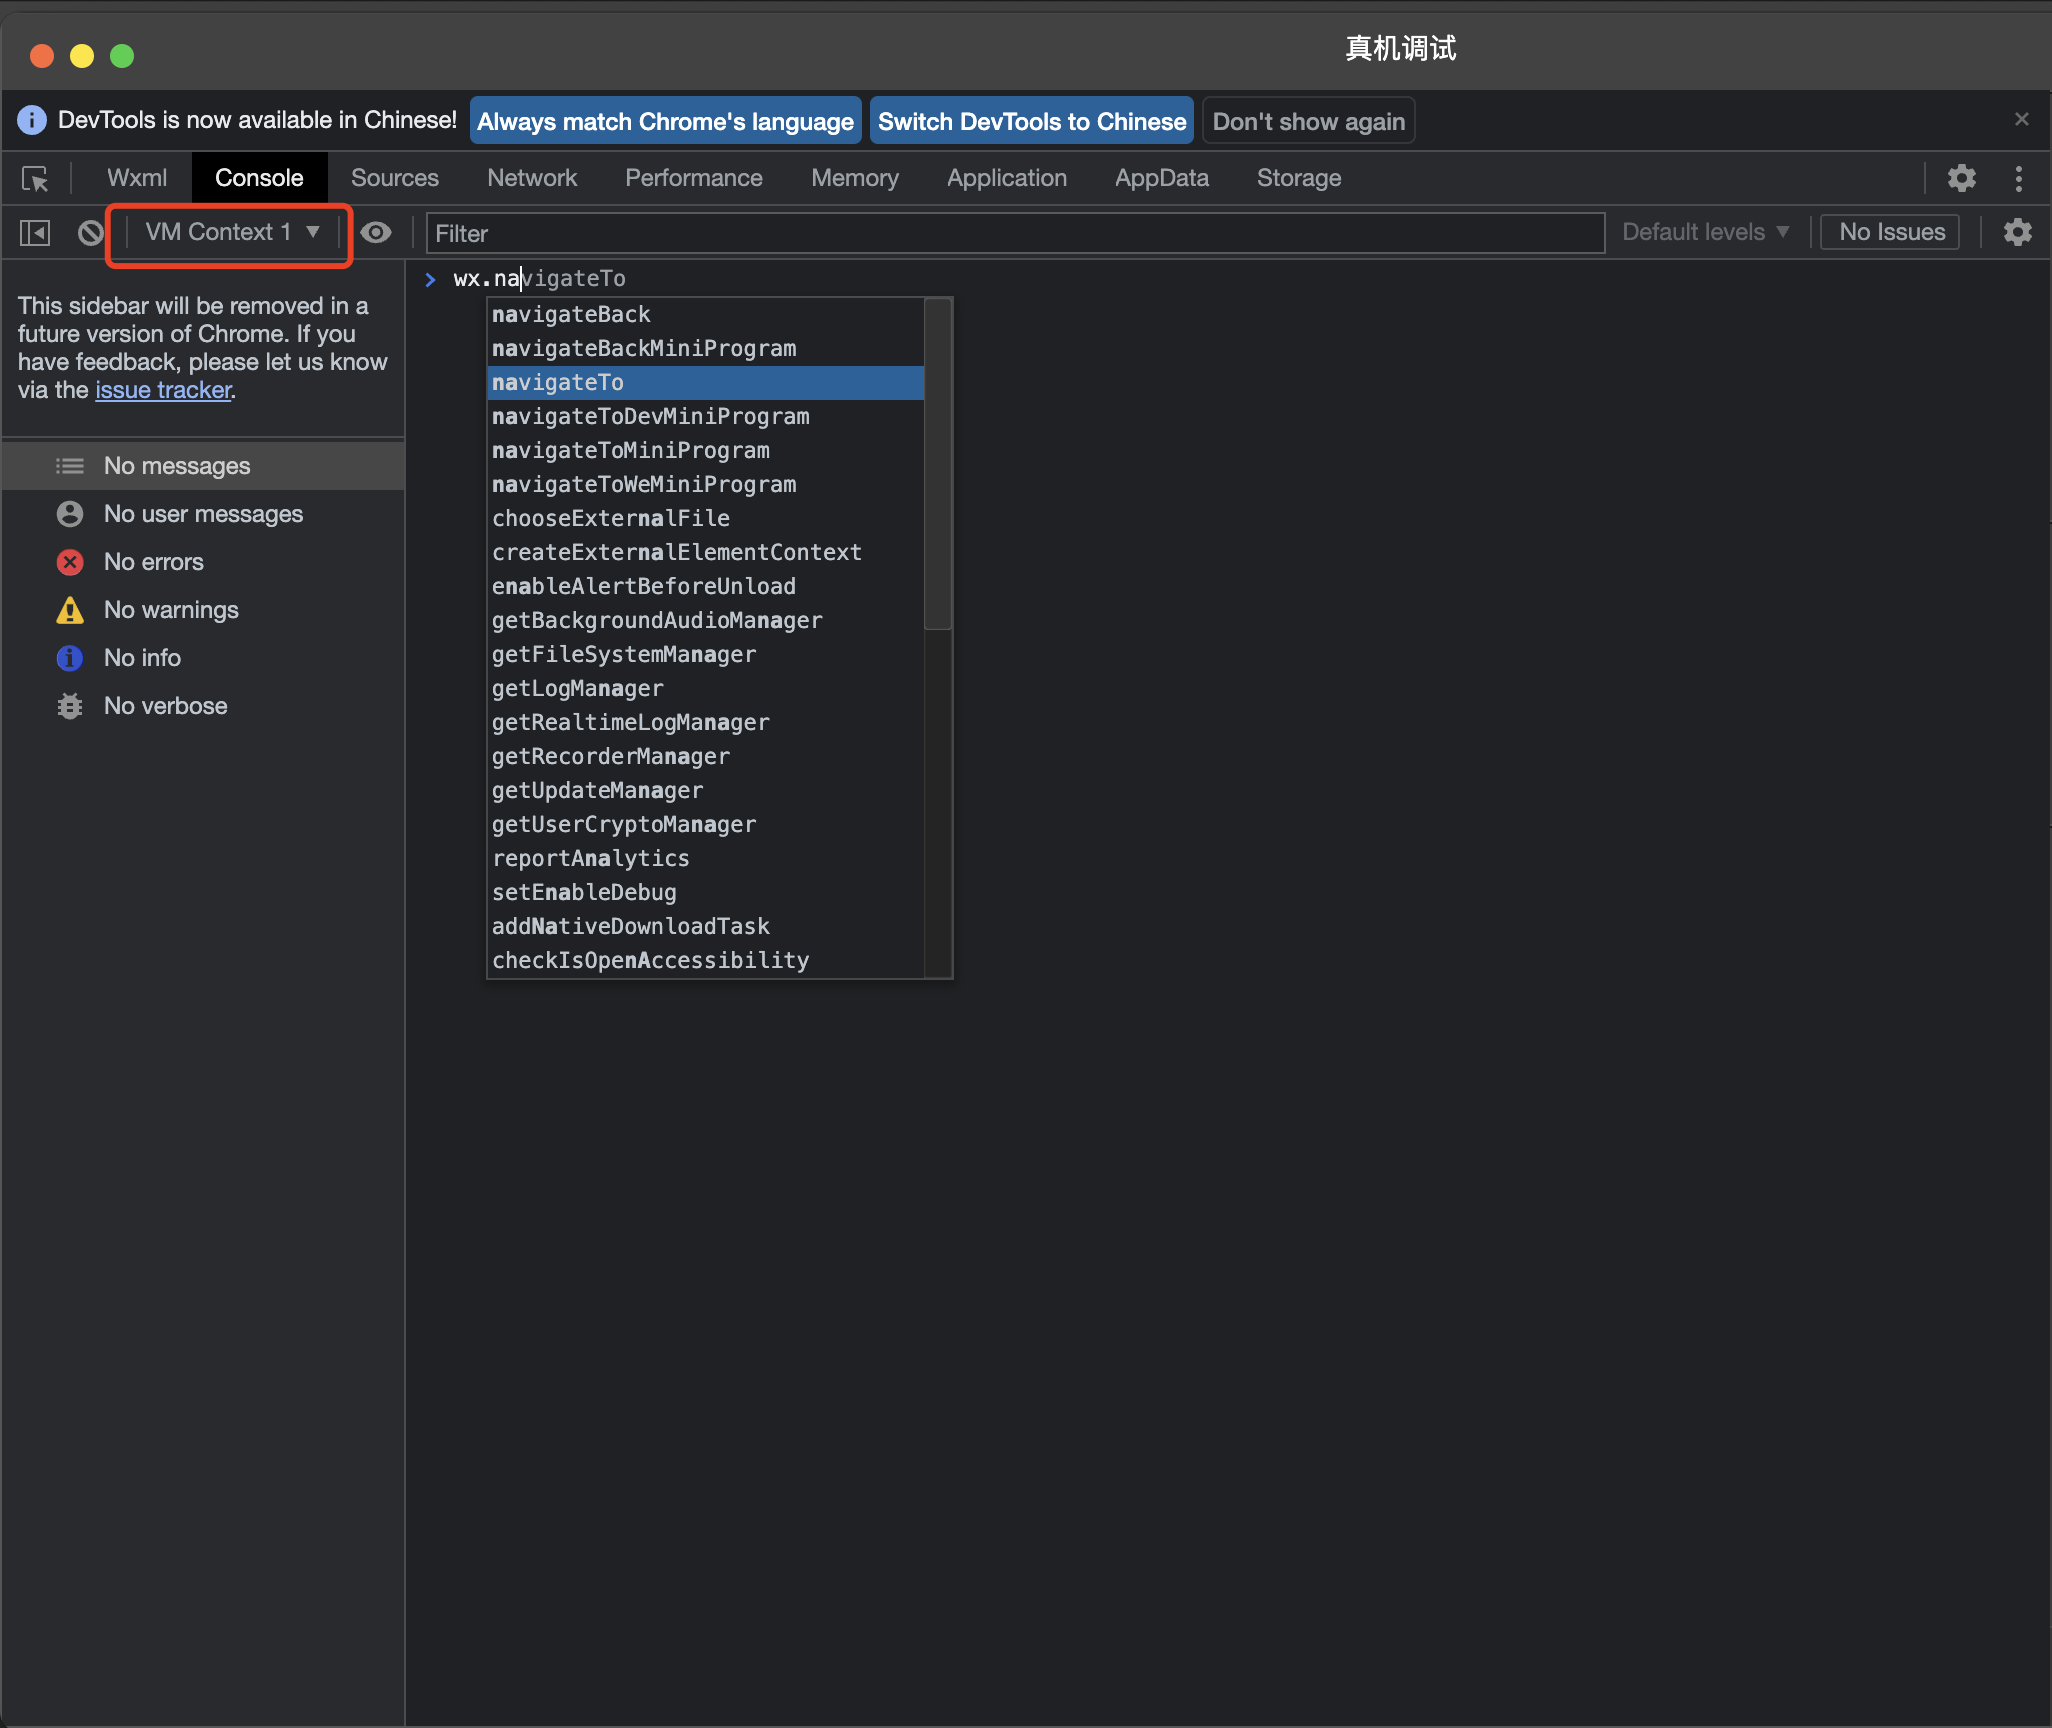
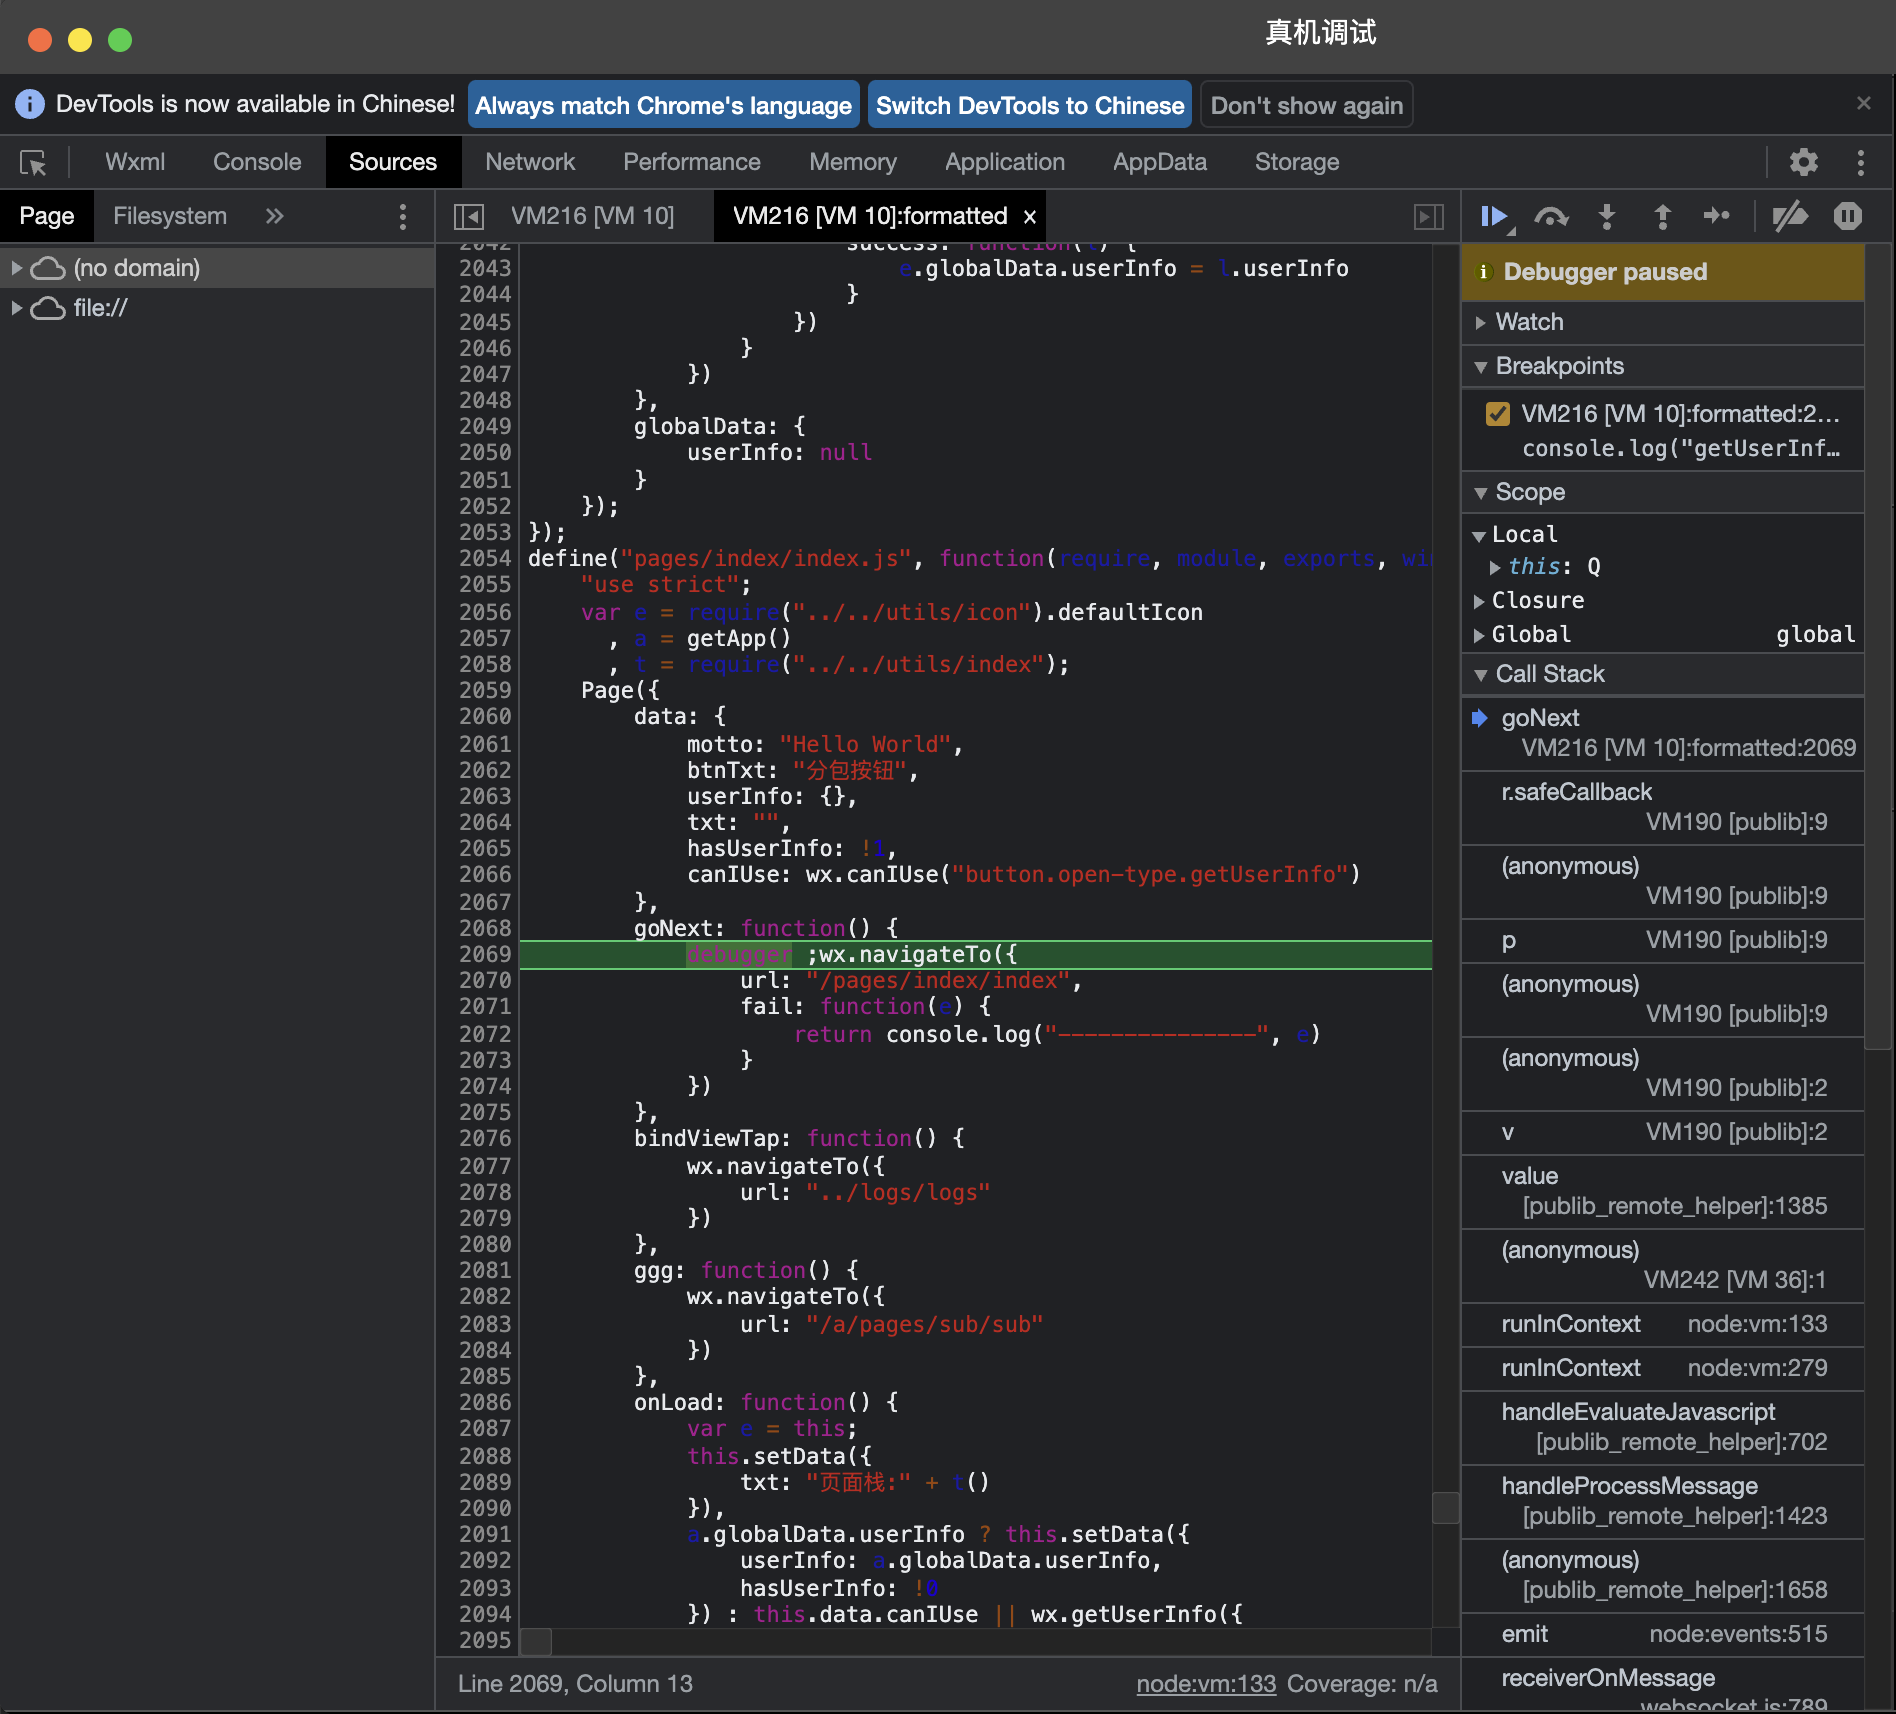
The remote debugging window is divided into two parts: the debugger view on the left and the information view on the right. Developers can debug code directly in the debugger and check Storage status. The information view shows the connection status with the phone and server, and any errors.
In the remote debugger, developers can debug code in the Console panel, view source code and set breakpoints in the Sources panel, and check Storage usage in the Storage panel.
For JS breakpoint debugging, use the debugger in the code.
wxml panel:
The information view on the right shows phone and network connection information, including phone model, system, name, host app version, and communication latency. Lower latency means smoother communication with the phone. Enable node inspection mode to click elements on the real device and view their details.