- Release Notes and Announcements
- Product Introduction
- Purchase Guide
- Application Performance Management
- Mobile App Performance Monitoring
- Real User Monitoring
- Cloud Automated Testing
- Prometheus Monitoring
- Grafana
- EventBridge
- Quick Start
- Cloud Product Monitoring
- Tencent Cloud Service Metrics
- CVM
- TKE
- Microservice
- Networking
- CBS
- TencentDB
- TencentDB for SQL Server Monitoring Metrics
- TencentDB for MySQL Monitoring Metrics
- TencentDB for Redis Monitoring Metrics
- TencentDB for MongoDB Monitoring Metrics
- TencentDB for PostgreSQL Monitoring Metrics
- TDSQL-C for MySQL Monitoring Metrics
- TencentDB for TcaplusDB Monitoring Metrics
- TencentDB for MariaDB Monitoring Metrics
- TDSQL for MySQL Monitoring Metrics (Legacy)
- TDSQL for MySQL Monitoring Metrics
- SCF
- CKafka
- TDMQ
- CLB
- COS
- CFS
- CPM
- ECM
- CDN And EdgeOne
- Direct Connect
- GAAP
- CMQ
- Elasticsearch
- WAF
- CLS
- Data Analysis
- Operation Guide
- CVM Agents
- CM Connection to Grafana
- Troubleshooting
- Practical Tutorial
- Tencent Cloud Service Metrics
- Application Performance Management
- Product Introduction
- Access Guide
- Operation Guide
- Practical Tutorial
- Parameter Information
- FAQs
- Mobile App Performance Monitoring
- Tencent Cloud Real User Monitoring
- Product Introduction
- Operation Guide
- Connection Guide
- FAQs
- Cloud Automated Testing
- Prometheus Monitoring
- Product Introduction
- Access Guide
- Scrape Configuration Description
- Custom Monitoring
- EMR Integration
- Java Application Integration
- Go Application Integration
- Exporter Integration
- Elasticsearch Exporter Integration
- Kafka Exporter Integration
- MongoDB Exporter Integration
- PostgreSQL Exporter Integration
- NGINX Exporter Integration
- Redis Exporter Integration
- Aerospike Exporter Integration
- MySQL Exporter Integration
- SQL Server Exporter Integration
- Oracle DB Exporter Integration
- Consul Exporter Integration
- Memcached Exporter Integration
- Apache Exporter Integration
- Integration with Other Exporters
- CVM Node Exporter
- Health Check
- Cloud Monitoring
- Non-Tencent Cloud Host Monitoring
- Read Cloud-Hosted Prometheus Instance Data via Remote Read
- Agent Self-Service Access
- Pushgateway Integration
- Instructions for Installing Components in the TKE Cluster
- Security Group Open Description
- Operation Guide
- Practical Tutorial
- Terraform
- FAQs
- Grafana
- Dashboard
- Alarm Management
- Console Operation Guide
- Alarm Policy
- Alarm Notification
- Alarm Receiving Channels and SMS Quota
- Alarm Types and Channels
- Receiving Alarm Notification Through SMS
- Receiving Alarm Notification Through Email
- Receiving Alarm Notifications through a WeCom Group
- Receiving Alarm Notification by Using a Slack Group
- Using PagerDuty to Receive Alarm Notifications
- Receiving Alarm Notifications Through a DingTalk Group
- Dynamic Threshold Alarm
- Silencing Alarm
- Viewing Alarm Records
- Product Policy Type and Dimension Information
- Configuring Alarm by Tag
- Access Management
- Console Operation Guide
- FAQs
- EventBridge
- Documentation Guide
- Related Agreements
- API Documentation
- History
- Introduction
- API Category
- Making API Requests
- Alarm APIs
- DescribeAlarmPolicies
- DescribeAlarmMetrics
- DescribeAlarmHistories
- CreateAlarmPolicy
- DeleteAlarmPolicy
- DescribeAlarmPolicy
- ModifyAlarmPolicyStatus
- SetDefaultAlarmPolicy
- BindingPolicyObject
- UnBindingPolicyObject
- UnBindingAllPolicyObject
- ModifyAlarmPolicyCondition
- ModifyAlarmPolicyNotice
- ModifyAlarmPolicyTasks
- DescribeMonitorTypes
- DescribeAllNamespaces
- DescribeAlarmEvents
- DescribeBindingPolicyObjectList
- ModifyAlarmPolicyInfo
- DescribeConditionsTemplateList
- Notification Template APIs
- Monitoring Data Query APIs
- Legacy Alert APIs
- Prometheus Service APIs
- CreatePrometheusAgent
- CreatePrometheusMultiTenantInstancePostPayMode
- CreatePrometheusScrapeJob
- CreateRecordingRule
- CreateServiceDiscovery
- DeleteAlertRules
- DeleteExporterIntegration
- DeletePrometheusScrapeJobs
- DeleteRecordingRules
- DescribeAlertRules
- DescribeExporterIntegrations
- DescribePrometheusAgents
- DescribePrometheusInstanceUsage
- DescribePrometheusInstances
- DescribePrometheusScrapeJobs
- DescribeRecordingRules
- DescribeServiceDiscovery
- DestroyPrometheusInstance
- GetPrometheusAgentManagementCommand
- ModifyPrometheusInstanceAttributes
- TerminatePrometheusInstances
- UnbindPrometheusManagedGrafana
- UninstallGrafanaDashboard
- UpdateAlertRule
- UpdateAlertRuleState
- UpdateExporterIntegration
- UpdatePrometheusAgentStatus
- UpdatePrometheusScrapeJob
- UpdateRecordingRule
- UpgradeGrafanaDashboard
- DescribePrometheusZones
- CreateAlertRule
- CreateExporterIntegration
- BindPrometheusManagedGrafana
- Grafana Service APIs
- UpgradeGrafanaInstance
- UpdateSSOAccount
- UpdateGrafanaWhiteList
- UpdateGrafanaNotificationChannel
- UpdateGrafanaIntegration
- UpdateGrafanaEnvironments
- UpdateGrafanaConfig
- UpdateDNSConfig
- UninstallGrafanaPlugins
- ResumeGrafanaInstance
- ModifyGrafanaInstance
- InstallPlugins
- EnableSSOCamCheck
- EnableGrafanaSSO
- EnableGrafanaInternet
- DescribeSSOAccount
- DescribeInstalledPlugins
- DescribeGrafanaWhiteList
- DescribeGrafanaNotificationChannels
- DescribeGrafanaIntegrations
- DescribeGrafanaInstances
- DescribeGrafanaEnvironments
- DescribeGrafanaConfig
- DescribeDNSConfig
- DeleteSSOAccount
- DeleteGrafanaNotificationChannel
- DeleteGrafanaIntegration
- DeleteGrafanaInstance
- CreateSSOAccount
- CreateGrafanaNotificationChannel
- CreateGrafanaIntegration
- CreateGrafanaInstance
- CleanGrafanaInstance
- DescribeGrafanaChannels
- Event Center APIs
- TencentCloud Managed Service for Prometheus APIs
- CreatePrometheusAlertPolicy
- CreatePrometheusGlobalNotification
- CreatePrometheusTemp
- DeletePrometheusAlertPolicy
- DeletePrometheusClusterAgent
- DeletePrometheusTemp
- DeletePrometheusTempSync
- DescribeClusterAgentCreatingProgress
- DescribePrometheusAgentInstances
- DescribePrometheusGlobalNotification
- DescribePrometheusInstanceDetail
- DescribePrometheusInstanceInitStatus
- DescribePrometheusTargetsTMP
- DescribePrometheusTempSync
- ModifyPrometheusAgentExternalLabels
- ModifyPrometheusAlertPolicy
- ModifyPrometheusGlobalNotification
- ModifyPrometheusTemp
- RunPrometheusInstance
- SyncPrometheusTemp
- CreatePrometheusClusterAgent
- DescribePrometheusClusterAgents
- DescribePrometheusGlobalConfig
- DescribePrometheusRecordRules
- DescribePrometheusAlertPolicy
- DescribePrometheusInstancesOverview
- DescribePrometheusTemp
- Monitoring APIs
- Data Types
- Error Codes
- Glossary
Overview
When using Flink, you need to monitor its task running status to know whether the tasks run normally and troubleshoot faults. TMP integrates Pushgateway to allow Flink to write metrics and provides an out-of-the-box Grafana monitoring dashboard for it.
Prerequisites
1. The EMR product you purchased includes the Flink component, and a Flink task is running in your instance.
2. You have created a TKE cluster in the region and VPC of your TMP instance.
Directions
Integrating product
Getting Pushgateway access configuration
1. Log in to the EMR console, select the corresponding instance, and select Basic Info > Instance Info to get the Pushgateway address and token.
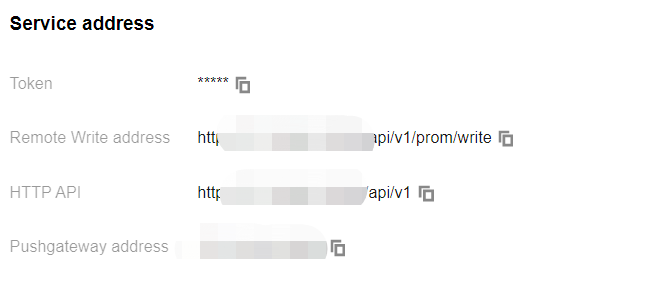

2. Get the
APPID on the Account Info page.Modifying Flink configuration
1. Log in to the EMR console, select the corresponding instance, and select Cluster Service.
2. Find the Flink configuration item and select Configuration Management in the Operation column on the right to enter the configuration management page.
3. On the right of the page, click Add Configuration Item and add the following configuration items one by one:
Configuration Item | Default Value | Data Type | Description | Suggestion |
metrics.reporter.promgateway.class | None | String | Name of the Java class for exporting metrics to Pushgateway | - |
metrics.reporter.promgateway.jobName | None | String | Push task name | Specify an easily understandable string |
metrics.reporter.promgateway.randomJobNameSuffix | true | Boolean | Whether to add a random string after the task name | Set it to `true`. If no random string is added, metrics of different Flink tasks will overwrite each other |
metrics.reporter.promgateway.groupingKey | None | String | Global label added to each metric in the format of `k1=v1;k2=v2` | Add the EMR instance ID to distinguish between the data of different instances, such as `instance_id=emr-xxx` |
metrics.reporter.promgateway.interval | None | Time | Time interval for pushing metrics, such as 30s | We recommend you set the value to about 1 minute |
metrics.reporter.promgateway.host | None | String | Pushgateway service address | It is the service address of the TMP instance in the console |
metrics.reporter.promgateway.port | -1 | Integer | Pushgateway service port | It is the port of the TMP instance in the console |
metrics.reporter.promgateway.needBasicAuth | false | Boolean | Whether the Pushgateway service requires authentication | Set it to `true`, as the Pushgateway of TMP requires authentication |
metrics.reporter.promgateway.user | None | String | Username for authentication | |
metrics.reporter.promgateway.password | None | String | Password for authentication | It is the access token of the TMP instance in the console |
metrics.reporter.promgateway.deleteOnShutdown | true | Boolean | Whether to delete the corresponding metrics on the Pushgateway after the Flink task is completed | Set it to `true` |
Below is a sample configuration:
metrics.reporter.promgateway.class: org.apache.flink.metrics.prometheus.PrometheusPushGatewayReportermetrics.reporter.promgateway.jobName: climatePredictmetrics.reporter.promgateway.randomJobNameSuffix:truemetrics.reporter.promgateway.interval: 60 SECONDSmetrics.reporter.promgateway.groupingKey:instance_id=emr-xxxxmetrics.reporter.promgateway.host: 172.xx.xx.xxmetrics.reporter.promgateway.port: 9090metrics.reporter.promgateway.needBasicAuth: truemetrics.reporter.promgateway.user: appidmetrics.reporter.promgateway.password: token
Installing Flink Pushgateway plugin
The Pushgateway plugin in the official package currently does not support configuring the authentication information, but TMP requires authentication before data can be written. Therefore, we recommend you use the JAR package we provide. We have also submitted a pull request for supporting authentication to the Flink team.
1. To prevent class conflicts, if you have already used the official Flink plugin, run the following command to delete it first:
cd /usr/local/service/flink/librm flink-metrics-prometheus*jar
2. In the EMR console, select the corresponding instance, and select Cluster Resource > Resource Management > Master to view the master node.
3. Click the instance ID to go to the CVM console, log in to the CVM instance, and run the following command to install the plugin:
cd /usr/local/service/flink/libwget https://rig-1258344699.cos.ap-guangzhou.myqcloud.com/flink/flink-metrics-prometheus_2.11-auth.jar -O flink-metrics-prometheus_2.11-auth.jar
Verifying
1. Run the
flink run command on the master node to submit a new task and view the task log:grep metrics /usr/local/service/flink/log/flink-hadoop-client-*.log
2. If the log contains the following content, the configuration is successfully loaded:


Note:
As tasks previously submitted in the cluster use the old configuration file, their metrics are not reported.
Viewing monitoring information
1. In Integration Center in the target TMP instance, find Flink monitoring, install the corresponding Grafana dashboard, and then you can enable the Flink monitoring dashboard.
2. Enter Grafana and click 


3. Click Flink Job List to view the monitoring information.


4. Click a job name or job ID in the table to view the job monitoring details.
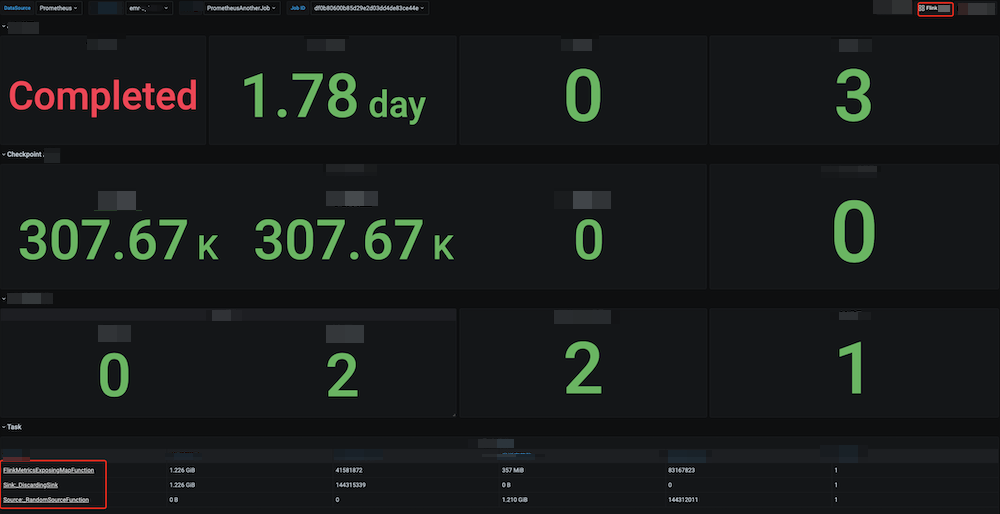

5. Click Flink Cluster in the top-right corner to view the Flink cluster monitoring information.
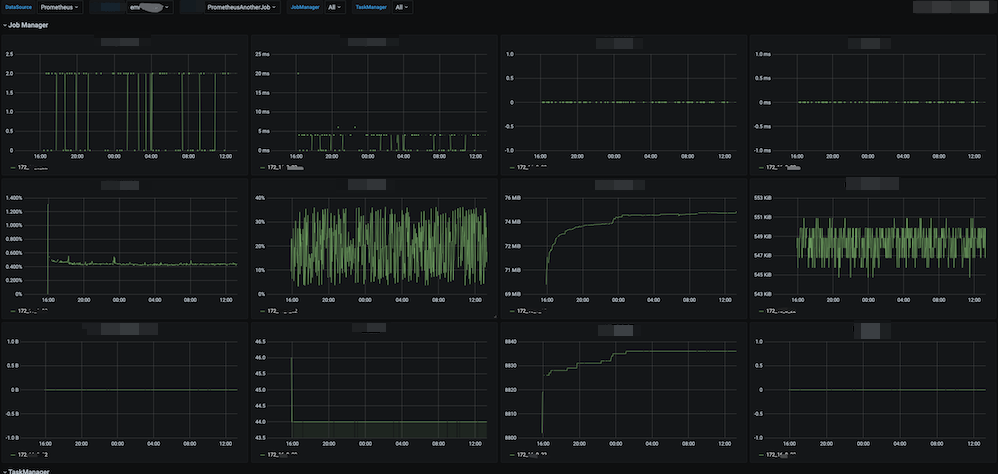

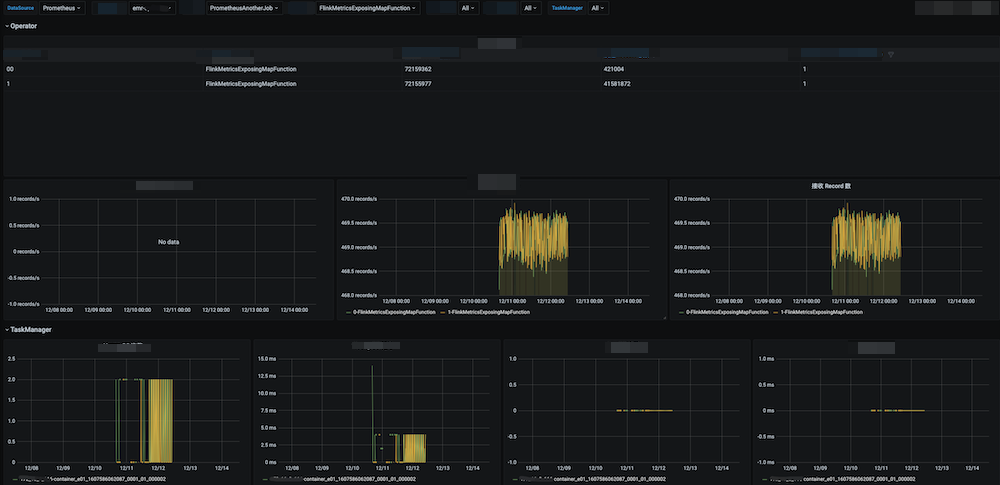
6. Click a task name in the table to view the task monitoring details.

Integrating with alert feature
1. Log in to the TMP console and select the target TMP instance to enter the management page.
2. Click Alerting Rule and add the corresponding alerting rules. For more information, please see Creating Alerting Rule.

 Yes
Yes
 No
No
Was this page helpful?