Tencent Cloud Observability Platform
- Release Notes and Announcements
- Product Introduction
- Purchase Guide
- Application Performance Management
- Pay-as-you-go (Postpaid)
- Packages (Prepaid)
- Mobile App Performance Monitoring
- Real User Monitoring
- Cloud Automated Testing
- Prometheus Monitoring
- Pay-as-You-Go (Postpaid)
- Quick Start
- EventBridge
- Cloud Product Monitoring
- Tencent Cloud Service Metrics
- Microservice
- Networking
- TencentDB
- TencentDB for Redis Monitoring Metrics
- CPM
- CDN And EdgeOne
- Operation Guide
- Cloud Monitoring Overview
- Monitoring View
- CM Connection to Grafana
- Troubleshooting
- Application Performance Management
- Access Guide
- Accessing Go Application
- Accessing Java Application
- Accessing Python Application
- Accessing Node.js Application
- Accessing PHP Application
- Accessing .NET Application
- Operation Guide
- Resource Management
- Application Monitoring
- Application Diagnosis
- Database Call Monitoring
- Access Management
- Alarm Service
- System Configuration
- Associate Logs
- Inject TraceID Into Logs
- Practical Tutorial
- Parameter Information
- APM Data Protocol Standard
- Mobile App Performance Monitoring
- Access Guide
- Android Use Cases
- iOS Use Cases
- Tencent Cloud Real User Monitoring
- Operation Guide
- Application Management
- Access Management
- Resource Tag
- Connection Guide
- Web Use Cases
- Cloud Automated Testing
- Operation Guide
- Creating Test Task
- Testing Statistics
- Access Management
- References
- Testing Nodes
- FAQs
- Performance Testing Service
- Operation Guide
- Performance Testing in Script Mode
- Script Examples
- HTTP-based Performance Testing
- Performance Testing in JMeter Mode
- Project Management
- Scenario Management
- Advanced Configuration
- Export Stress Test Indicators
- Traffic Recording
- Performance Testing Report
- Access Control
- Alarm Management
- Tag Management
- Practice Tutorial
- JavaScript API List
- pts/http
- Response
- pts/dataset
- pts/grpc
- pts/jsonpath
- pts/redis
- pts/url
- URL
- pts/util
- pts/ws
- pts/socketio
- socketio
- pts/socket
- Prometheus Monitoring
- Product Introduction
- Access Guide
- EMR Integration
- Java Application Integration
- Exporter Integration
- Operation Guide
- Instance
- Recording Rule
- Alerting Rule
- Access Control
- TKE Metrics
- Practical Tutorial
- Terraform
- Grafana
- Operation Guide
- Instance
- Tencent Cloud Service Integration
- Plugin Management
- Dashboard
- Operation Guide
- Configuring Dashboard
- Monitoring Charts
- Creating Chart
- Use Cases of Different Chart Types
- Alarm Management
- Console Operation Guide
- Alarm Policy
- Configuring alert trigger conditions
- Alarm Notification
- Alarm Callback
- Alarm Receiving Channels and SMS Quota
- Dynamic Threshold Alarm
- Silencing Alarm
- EventBridge
- Product Introduction
- Practical Tutorial
- Migrating Event Alarm
- FAQs
- Related Agreements
- API Documentation
- Making API Requests
- Monitoring Data Query APIs
- Alarm APIs
- Notification Template APIs
- Legacy Alert APIs
- Prometheus Service APIs
- Grafana Service APIs
- Event Center APIs
- TencentCloud Managed Service for Prometheus APIs
- Monitoring APIs
DocumentationTencent Cloud Observability PlatformApplication Performance ManagementOperation GuideDatabase Call MonitoringDatabase Call Analysis
Database Call Analysis
Last updated: 2024-11-01 17:47:45
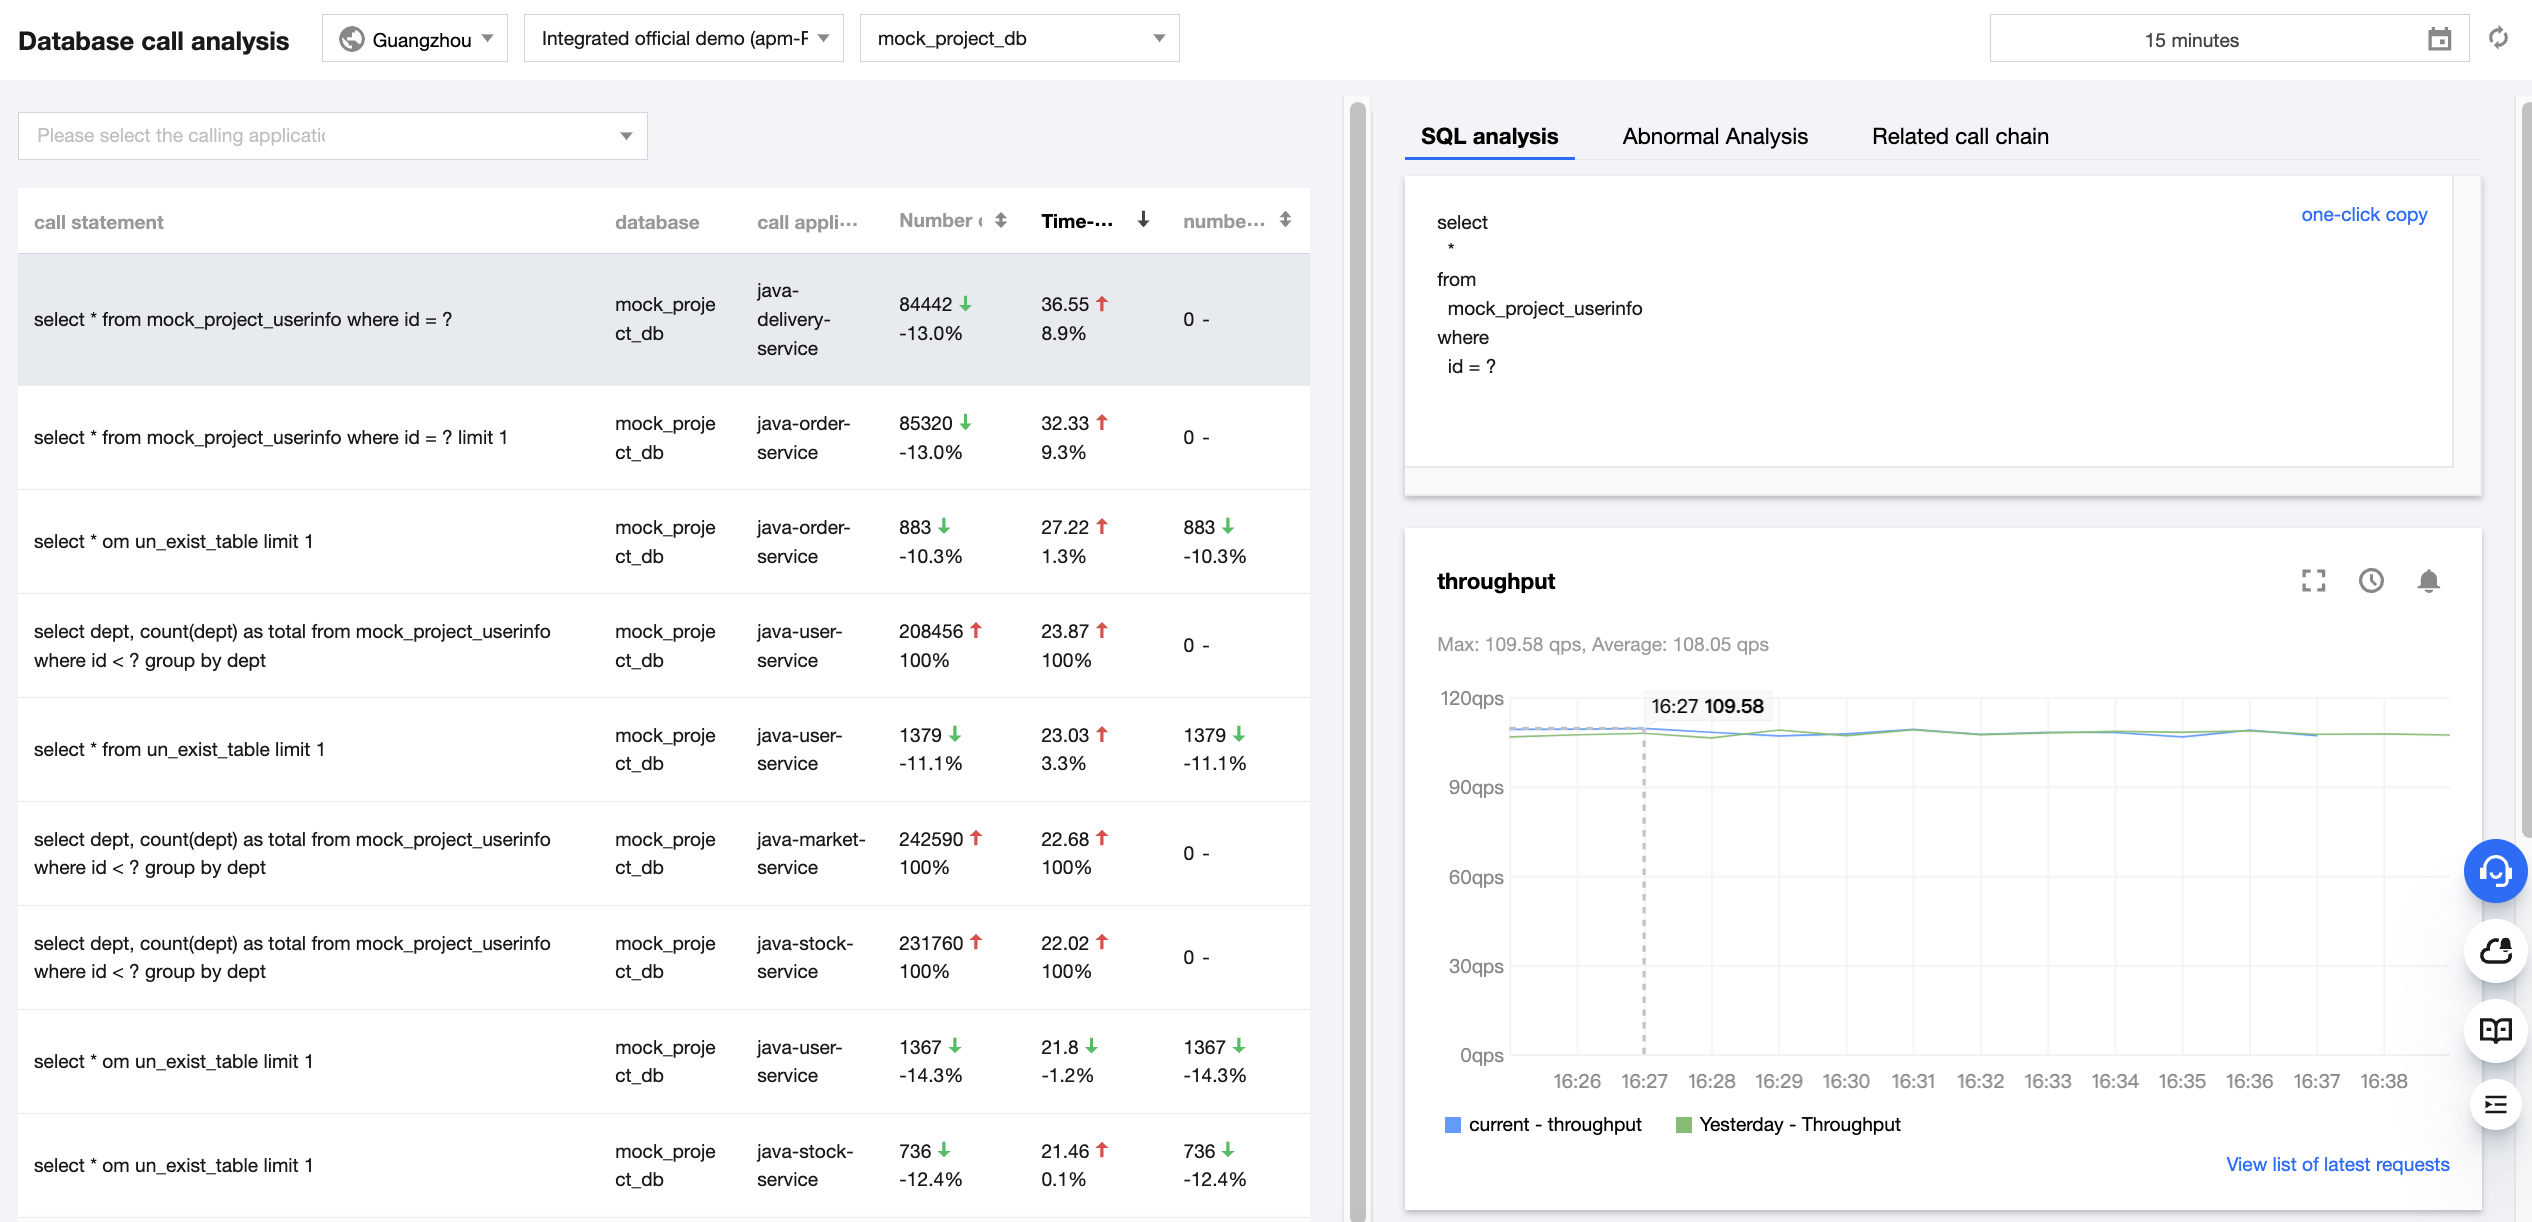
This document describes the capabilities and directions of database call search and analysis.
Prerequisites
SQL monitoring list
The SQL list on the left displays all SQL calls between the application and database in the selected time range, as well as the number of calls, duration, error rate, and DoD change of each SQL statement. You can directly locate the target SQL statement through the search bar above the list.
SQL analysis
The SQL analysis module on the right displays the change trends of calls and response time of the currently selected SQL statement in the specified time range. The list of exceptions in the current database is displayed below the trend chart, including exception type, caller, number of exceptions, first occurrence time, and last occurrence time. You can click View details to view specific database exceptions or click Trace to view trace details.
Exception analysis
You can switch the sub-window menu on the right to enter the exception analysis page. This page displays the list of SQL exceptions, including service exception types, APIs, and the number of exception occurrences.
Was this page helpful?
You can also Contact Sales or Submit a Ticket for help.
Yes
No


