Tencent Cloud Observability Platform
- Release Notes and Announcements
- Product Introduction
- Purchase Guide
- Application Performance Management
- Pay-as-you-go (Postpaid)
- Packages (Prepaid)
- Mobile App Performance Monitoring
- Real User Monitoring
- Cloud Automated Testing
- Prometheus Monitoring
- Pay-as-You-Go (Postpaid)
- Quick Start
- EventBridge
- Cloud Product Monitoring
- Tencent Cloud Service Metrics
- Microservice
- Networking
- TencentDB
- TencentDB for Redis Monitoring Metrics
- CPM
- CDN And EdgeOne
- Operation Guide
- Cloud Monitoring Overview
- Monitoring View
- CM Connection to Grafana
- Troubleshooting
- Application Performance Management
- Access Guide
- Accessing Go Application
- Accessing Java Application
- Accessing Python Application
- Accessing Node.js Application
- Accessing PHP Application
- Accessing .NET Application
- Operation Guide
- Resource Management
- Application Monitoring
- Application Diagnosis
- Database Call Monitoring
- Access Management
- Alarm Service
- System Configuration
- Associate Logs
- Inject TraceID Into Logs
- Practical Tutorial
- Parameter Information
- APM Data Protocol Standard
- Mobile App Performance Monitoring
- Access Guide
- Android Use Cases
- iOS Use Cases
- Tencent Cloud Real User Monitoring
- Operation Guide
- Application Management
- Access Management
- Resource Tag
- Connection Guide
- Web Use Cases
- Cloud Automated Testing
- Operation Guide
- Creating Test Task
- Testing Statistics
- Access Management
- References
- Testing Nodes
- FAQs
- Performance Testing Service
- Operation Guide
- Performance Testing in Script Mode
- Script Examples
- HTTP-based Performance Testing
- Performance Testing in JMeter Mode
- Project Management
- Scenario Management
- Advanced Configuration
- Export Stress Test Indicators
- Traffic Recording
- Performance Testing Report
- Access Control
- Alarm Management
- Tag Management
- Practice Tutorial
- JavaScript API List
- pts/http
- Response
- pts/dataset
- pts/grpc
- pts/jsonpath
- pts/redis
- pts/url
- URL
- pts/util
- pts/ws
- pts/socketio
- socketio
- pts/socket
- Prometheus Monitoring
- Product Introduction
- Access Guide
- EMR Integration
- Java Application Integration
- Exporter Integration
- Operation Guide
- Instance
- Recording Rule
- Alerting Rule
- Access Control
- TKE Metrics
- Practical Tutorial
- Terraform
- Grafana
- Operation Guide
- Instance
- Tencent Cloud Service Integration
- Plugin Management
- Dashboard
- Operation Guide
- Configuring Dashboard
- Monitoring Charts
- Creating Chart
- Use Cases of Different Chart Types
- Alarm Management
- Console Operation Guide
- Alarm Policy
- Configuring alert trigger conditions
- Alarm Notification
- Alarm Callback
- Alarm Receiving Channels and SMS Quota
- Dynamic Threshold Alarm
- Silencing Alarm
- EventBridge
- Product Introduction
- Practical Tutorial
- Migrating Event Alarm
- FAQs
- Related Agreements
- API Documentation
- Making API Requests
- Monitoring Data Query APIs
- Alarm APIs
- Notification Template APIs
- Legacy Alert APIs
- Prometheus Service APIs
- Grafana Service APIs
- Event Center APIs
- TencentCloud Managed Service for Prometheus APIs
- Monitoring APIs
DocumentationTencent Cloud Observability PlatformMobile App Performance MonitoringAccess GuideAndroid Use CasesFeature ConfigurationWebView, JsError, and Web Network Monitoring
WebView, JsError, and Web Network Monitoring
Last updated: 2024-05-14 12:36:06
Enabling Feature
Initialization requires enabling WebView, JsError, and Web network monitoring. Below is how to enable these three features based on Stable. The code is as follows:
QAPM.beginScene(QAPM.SCENE_ALL, QAPM.ModeStable | QAPM.ModeWebView | QAPM.ModeJsError| QAPM.ModeHTTPInWeb);
In addition, the following code needs to be configured:
WebView Monitoring requires enabling interaction with JavaScript. Call the following code during WebView initialization to enable:
WebSettings webSetting = webView.getSettings();webSetting.setJavaScriptEnabled(true);
After WebView initialization, add a call interface channel for Java and JS. The purpose is to allow the JS layer to obtain some configuration information from the Java layer:
webView.addJavascriptInterface(QAPMJavaScriptBridge.getInstance(),"QAPMAndroidJsBridge");
Add the following method in the WebView's shouldInterceptRequest code to intercept web-sdk and replace it with local SDK resources. Make sure to call the following code at the earliest position in this callback.
If it is x5, use the following code:
@Overridepublicpublic WebResourceResponse shouldInterceptRequest(WebView webView, String s) {???Object response = QAPMJavaScriptBridge.getInstance().shouldInterceptRequestWithX5(s);???if (response != null) {???????return (WebResourceResponse)response;?????? }return super.shouldInterceptRequest(webView, s);??? }
If it is Native WebView, use the following code:
@Overridepublicpublic WebResourceResponse shouldInterceptRequest(WebView webView, String s) {???WebResourceResponse response = QAPMJavaScriptBridge.getInstance().shouldInterceptRequest(s);???if (response != null) {???????return response;?????? }return super.shouldInterceptRequest(webView, s);??? }
Add the following method in the WebView's onPageFinished code to inject JS script:
webView.setWebViewClient(new WebViewClient(){??? @Override??? public void onPageFinished(WebView view, String url) {??????? super.onPageFinished(view, url);??????? QAPMJavaScriptBridge.getInstance().initFileJS(view);??? }});
Verifying Whether the Feature Is Working Properly
Native WebView, JsError monitoring:
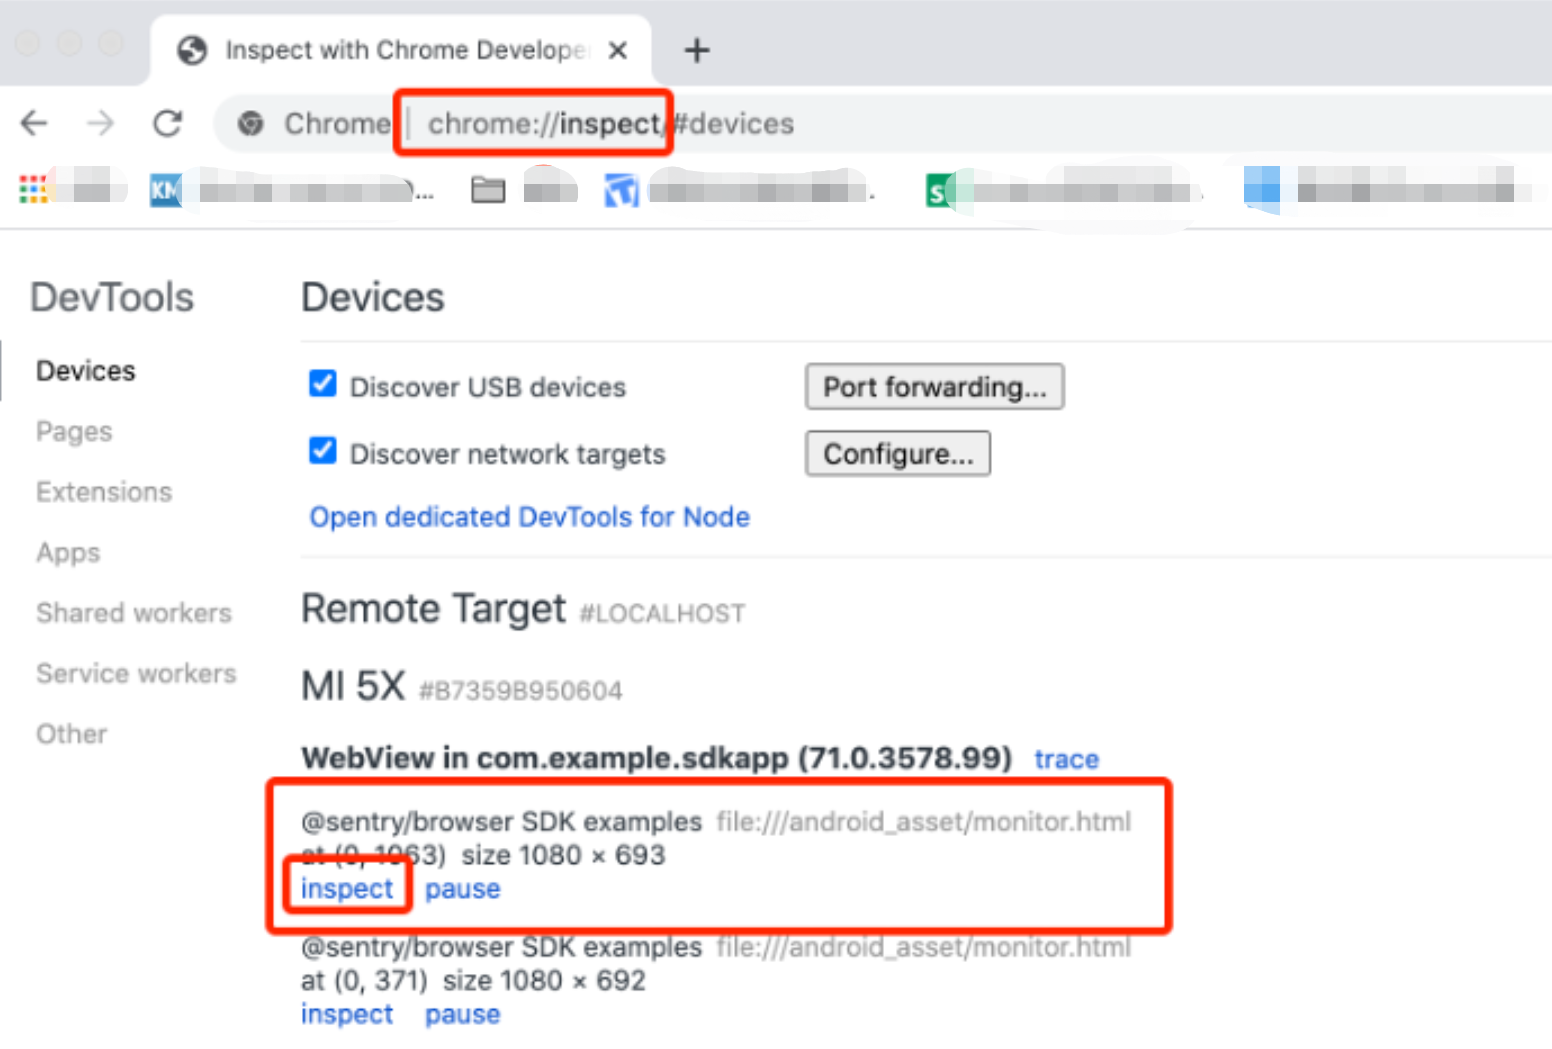
1. Include the following code in the code (for remote debugging purposes).
WebView.setWebContentsDebuggingEnabled(true);
2. Open Google Chrome, and enter
chrome://inspect in the address bar. In the devices that appear, click inspect.

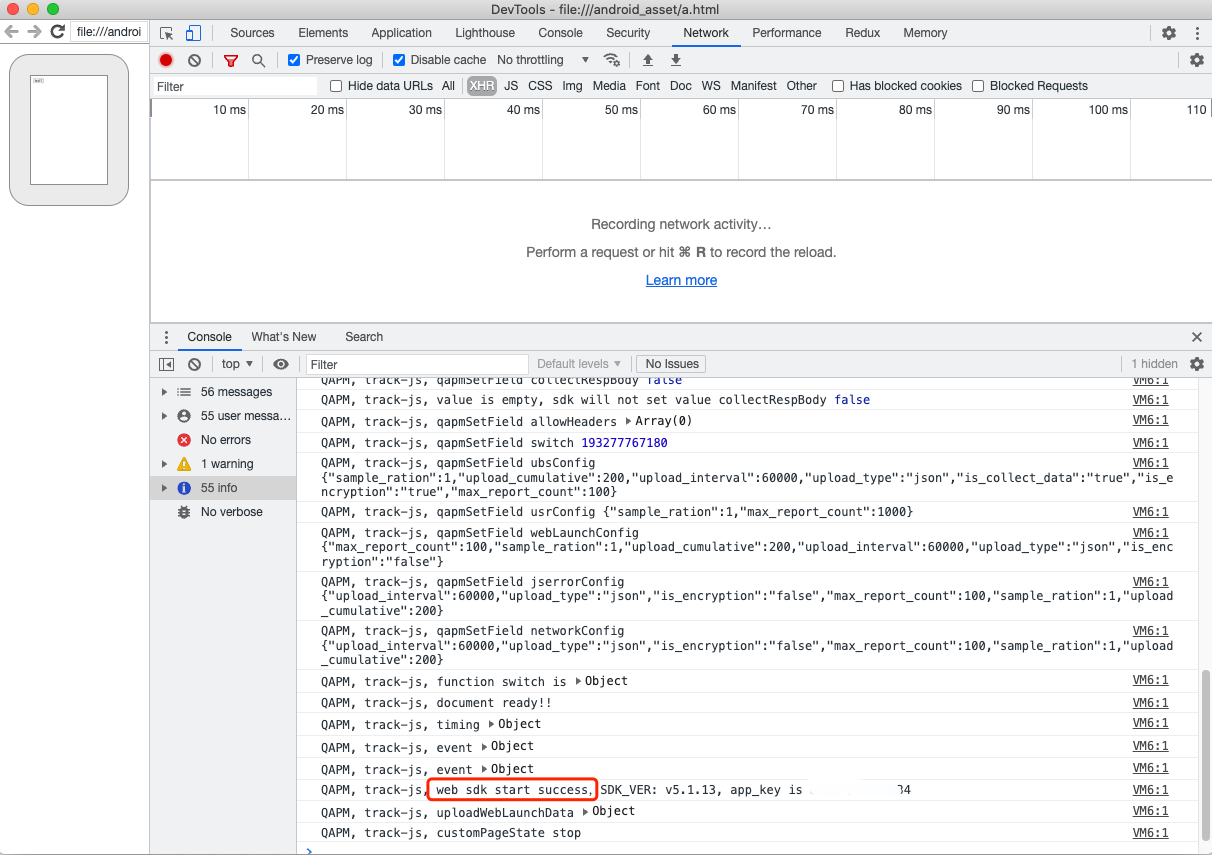
3. Find the Console module query log. If
web start success, vxxx is displayed, it indicates the WebSDK inject succeeded.

4. Check whether all features are reporting normally. Consider JsError reporting as an example, as follows:
Retrieval tag: [plugin::143].
The occurrence of a JsError, such as the following log message, indicates successful reporting of JsError data.


The other retrieval tags are as follows:
Page load: plugin::141 (reported immediately after each Web page load is complete).
Network request: plugin::154 (reported when there are network errors and slow requests).
Note:
1. To check whether WebView monitoring is normal, examine through browsers like Chrome for debugging.
2. Page load is reported in the Issue Case Details only if the page load duration exceeds 3.5s.
3. Network requests are reported in cases of network errors and slow networks.
Was this page helpful?
You can also Contact Sales or Submit a Ticket for help.
Yes
No

