Currently, the default alarm policy is only supported for CVM (basic monitoring), TencentDB for MongoDB (server monitoring), TencentDB for MySQL (server monitoring), TencentDB for Redis, TDSQL for MySQL, TDSQL for PostgreSQL, CKafka (instance monitoring), ES, DTS, EMR, and CLB.
When you successfully purchase a Tencent Cloud service that supports the default policy for the first time, Tencent Cloud Observability Platform will automatically create the default alarm policy for you. For more information on the metrics/events supported by the default policy or alarm rules, see the default policy description.
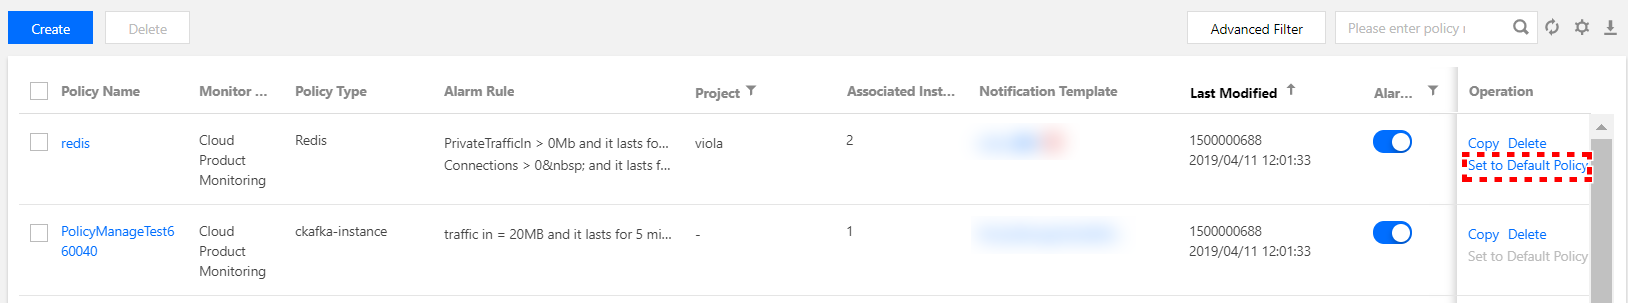
You can also manually create an alarm policy and set it as the default alarm policy. After the default policy is set, newly purchased instances will be automatically associated with the default policy without requiring manual addition.
Default Metric Description
Product Name
Alarm Type
Metric/Event Name
Alarm Rule
CVM
Metric alarm
CPU utilization
The statistical period is 1 minute, the threshold is >95%, and the continuous monitoring duration is 5 monitoring data points
Memory utilization
The statistical period is 1 minute, the threshold is >95%, and the continuous monitoring duration is 5 monitoring data points
Disk utilization
The statistical period is 1 minute, the threshold is >95%, and the continuous monitoring duration is 5 monitoring data points
Public network bandwidth utilization
The statistical period is 1 minute, the threshold is >95%, and the continuous monitoring duration is 5 monitoring data points
Event alarm
Read-only disk
-
TencentDB for MySQL (server monitoring)
Metric alarm
Disk utilization
The statistical period is 1 minute, the threshold is >80%, and the continuous monitoring duration is 5 monitoring data points
CPU utilization
The statistical period is 1 minute, the threshold is >80%, and the continuous monitoring duration is 5 monitoring data points
Event alarm
OOM
-
TencentDB for MongoDB
Metric alarm
Disk utilization
The statistical period is 1 minute, the threshold is >80%, and the continuous monitoring duration is 5 monitoring data points
Connection utilization
The statistical period is 1 minute, the threshold is >80%, and the continuous monitoring duration is 5 monitoring data points
TencentDB for Redis - CKV version/community version
Metric alarm
Capacity utilization
The statistical period is 1 minute, the threshold is >80%, and the continuous monitoring duration is 5 monitoring data points
TDSQL for MySQL
Event alarm
OOM
-
Instance read-only status (disk overrun)
TDSQL for PostgreSQL
Event alarm
Insufficient memory
-
OOM
CKafka - instance
Metric alarm
Disk utilization
The statistical period is 1 minute, the threshold is >85%, and the continuous monitoring duration is 5 monitoring data points
ES
Metric alarm
Average disk utilization
The statistical period is 1 minute, the threshold is >80%, and the continuous monitoring duration is 5 monitoring data points
Average CPU utilization
The statistical period is 1 minute, the threshold is >90%, and the continuous monitoring duration is 5 monitoring data points
Average JVM memory utilization
The statistical period is 1 minute, the threshold is >85%, and the continuous monitoring duration is 5 monitoring data points
Cluster health
The statistical period is 1 minute, the threshold is >=1, and the continuous monitoring duration is 5 monitoring data points
DTS
Event alarm
Data migration task interruption
-
Data sync task interruption
-
Data subscription task interruption
-
EMR (server monitoring - disk)
Metric alarm
Disk utilization (used_all)
The statistical period is 1 minute, the threshold is >80%, and an alarm will be triggered once every 5 consecutive times the conditions are met
inode utilization
The statistical period is 1 minute, the threshold is >50%, and an alarm will be triggered once every 5 consecutive times the conditions are met
EMR (server monitoring - CPU)
Metric alarm
CPU utilization (idle)
The statistical period is 1 minute, the threshold is <2%, and an alarm will be triggered once every 5 consecutive times the conditions are met
EMR (server monitoring - memory)
Metric alarm
Memory utilization (used_percent)
The statistical period is 1 minute, the threshold is >95%, and an alarm will be triggered once every 5 consecutive times the conditions are met
EMR (server monitoring - network)
Event alarm
Metadatabase ping failure
-
EMR (cluster monitoring)
Event alarm
Elastic scaling failure
-
EMR (HBase - overview)
Metric alarm
Number of cluster RSs (numDeadRegionServers)
The statistical period is 1 minute, the threshold is >0, and an alarm will be triggered once every 5 consecutive times the conditions are met
Number of cluster regions in RIT state (ritCountOverThreshold)
The statistical period is 1 minute, the threshold is >0, and an alarm will be triggered once every 5 consecutive times the conditions are met
EMR (HBase - HMaster)
Metric alarm
GC time (FGCT)
The statistical period is 1 minute, the threshold is >5s, and an alarm will be triggered once every 5 consecutive times the conditions are met
EMR (HBase - RegionServer)
Metric alarm
GC time (FGCT)
The statistical period is 1 minute, the threshold is >5s, and an alarm will be triggered once every 5 consecutive times the conditions are met
Number of regions (regionCount)
The statistical period is 1 minute, the threshold is >600, and an alarm will be triggered once every 5 consecutive times the conditions are met
Number of requests in operation queue (compactionQueueLength)
The statistical period is 1 minute, the threshold is >500, and an alarm will be triggered once every 5 consecutive times the conditions are met
EMR (HDFS - NameNode)
Metric alarm
GC time (FGCT)
The statistical period is 1 minute, the threshold is >5s, and an alarm will be triggered once every 5 consecutive times the conditions are met
Number of missing blocks (NumberOfMissingBlocks)
The statistical period is 1 minute, the threshold is >0, and an alarm will be triggered once every 5 consecutive times the conditions are met
Event alarm
NameNode master/slave switch
-
EMR (HDFS - DataNode)
Metric alarm
Number of XCeivers (XceiverCount)
The statistical period is 1 minute, the threshold is >1,000, and an alarm will be triggered once every 5 consecutive times the conditions are met
GC time (FGCT)
The statistical period is 1 minute, the threshold is >5s, and an alarm will be triggered once every 5 consecutive times the conditions are met
EMR (HDFS - overview)
Metric alarm
Disk failure
The statistical period is 1 minute, the threshold is >0, and an alarm will be triggered once every 5 consecutive times the conditions are met
Number of cluster DataNodes (NumDeadDataNodes)
The statistical period is 1 minute, the threshold is >0, and an alarm will be triggered once every 5 consecutive times the conditions are met
Number of cluster DataNodes (NumStaleDataNodes)
The statistical period is 1 minute, the threshold is >0, and an alarm will be triggered once every 5 consecutive times the conditions are met
HDFS storage space utilization (capacityusedrate)
The statistical period is 1 minute, the threshold is 90%, and an alarm will be triggered once every 5 consecutive times the conditions are met
EMR (Presto - Presto_Coordinator)
Metric alarm
GC time (FGCT)
The statistical period is 1 minute, the threshold is >5s, and an alarm will be triggered once every 5 consecutive times the conditions are met
EMR (Presto - Presto_Worker)
Metric alarm
GC time (FGCT)
The statistical period is 1 minute, the threshold is >5s, and an alarm will be triggered once every 5 consecutive times the conditions are met
EMR (Presto - overview)
Metric alarm
Number of nodes (Failed)
The statistical period is 1 minute, the threshold is >0, and an alarm will be triggered once every 5 consecutive times the conditions are met
EMR (ClickHouse - server)
Metric alarm
Number of largest active data blocks in partition
The statistical period is 1 minute, the threshold is >250, and an alarm will be triggered once every 5 consecutive times the conditions are met
EMR (Hive - HiveMetaStore)
Metric alarm
GC time (FGCT)
The statistical period is 1 minute, the threshold is >5s, and an alarm will be triggered once every 5 consecutive times the conditions are met
DaemonThreadCount
The statistical period is 1 minute, the threshold is >2,000, and an alarm will be triggered once every 5 consecutive times the conditions are met
ThreadCount
The statistical period is 1 minute, the threshold is >2,000, and an alarm will be triggered once every 5 consecutive times the conditions are met
EMR (Hive - HiveServer2)
Metric alarm
GC time (FGCT)
The statistical period is 1 minute, the threshold is >5s, and an alarm will be triggered once every 5 consecutive times the conditions are met
DaemonThreadCount
The statistical period is 1 minute, the threshold is >2,000, and an alarm will be triggered once every 5 consecutive times the conditions are met
ThreadCount
The statistical period is 1 minute, the threshold is >2,000, and an alarm will be triggered once every 5 consecutive times the conditions are met
EMR (YARN - overview)
Metric alarm
Number of nodes (NumUnhealthyNMs)
The statistical period is 1 minute, the threshold is >0, and an alarm will be triggered once every 5 consecutive times the conditions are met
Number of nodes (NumLostNMs)
The statistical period is 1 minute, the threshold is >0, and an alarm will be triggered once every 5 consecutive times the conditions are met
EMR (YARN - NodeManager)
Metric alarm
GC time (FGCT)
The statistical period is 1 minute, the threshold is >5s, and an alarm will be triggered once every 5 consecutive times the conditions are met
EMR (YARN - ResourceManger)
Metric alarm
GC time (FGCT)
The statistical period is 1 minute, the threshold is >5s, and an alarm will be triggered once every 5 consecutive times the conditions are met
Event alarm
ResourceManager master/slave switch
-
EMR (ZooKeeper - ZooKeeper)
Metric alarm
GC time (FGCT)
The statistical period is 1 minute, the threshold is >5s, and an alarm will be triggered once every 5 consecutive times the conditions are met
Number of Znodes (zk_znode_count)
The statistical period is 1 minute, the threshold is >100,000, and an alarm will be triggered once every 5 consecutive times the conditions are met
Number of queuing requests (zk_outstanding_requests)
The statistical period is 1 minute, the threshold is >50, and an alarm will be triggered once every 5 consecutive times the conditions are met
CLB (public network CLB instance)
Metric alarm
Discarded connections
The statistical period is 1 minute, the threshold is >10, and an alarm will be triggered once every 3 consecutive times the conditions are met
Discarded inbound data packets
The statistical period is 1 minute, the threshold is >10, and an alarm will be triggered once every 3 consecutive times the conditions are met
Discarded inbound bandwidth
The statistical period is 1 minute, the threshold is >10 MB, and an alarm will be triggered once every 3 consecutive times the conditions are met
Discarded outbound bandwidth
The statistical period is 1 minute, the threshold is >10 MB, and an alarm will be triggered once every 3 consecutive times the conditions are met
Inbound bandwidth utilization
The statistical period is 1 minute, the threshold is >80%, and an alarm will be triggered once every 3 consecutive times the conditions are met
Outbound bandwidth utilization
The statistical period is 1 minute, the threshold is >80%, and an alarm will be triggered once every 3 consecutive times the conditions are met