Prometheus is a powerful, flexible, and highly scalable open-source observability platform that provides a multi-dimensional data model, rich collection capabilities, and a powerful query language. As one of the most important open-source projects under CNCF (Cloud Native Computing Foundation), Prometheus is widely used in the cloud-native era and has built a thriving open-source ecosystem. Especially in the field of metric monitoring, Prometheus has become the de facto standard.
At the same time, OpenTelemetry has also become the most important technical standard for observability data in terms of detection, generation, collection, and export, supporting the three pillars of observability data - trace, metric, and log.
Tencent Cloud Application Performance Management (APM) achieves data integration with Prometheus: For applications connected to APM through the OpenTelemetry scheme, custom metrics can be reported using the OpenTelemetry API. The APM server is responsible for synchronizing custom metrics to Tencent Cloud Prometheus Monitoring Service, helping users explore data value based on the Prometheus ecosystem. The most typical use case is to connect to the Prometheus data source through the Grafana service to obtain powerful data display capabilities. In addition, users can also connect to the Prometheus data source through the Dashboard service provided by Tencent Cloud Observability Platform and view the custom dashboard in the APM console from the application perspective.
How To Output OpenTelemetry Metrics To Prometheus?
Since OpenTelemetry and Prometheus belong to different technical systems, custom metrics reported by the OpenTelemetry API cannot be directly output to Prometheus and need to be processed and converted. There are several common methods as follows:
1. The application introduces the openTelemetry-exporter-prometheus library to expose OpenTelemetry metrics directly in the form of Prometheus Exporter, which can then be pulled by Prometheus.
2. The application reports OpenTelemetry metrics to the OpenTelemetry Collector, which exposes the OpenTelemetry metrics in the form of Prometheus Exporter for Prometheus to pull.
3. The application reports OpenTelemetry metrics to the OpenTelemetry Collector, which converts OpenTelemetry metrics into Prometheus metrics and writes them to Prometheus via Remote Write.
The practicality of these methods is relatively low: Method 1 requires the introduction of specific class libraries, which are missing in many programming languages, and the configuration work of service discovery is also relatively complex. Methods 2 and 3 require building OpenTelemetry Collector by oneself, and the deployment and maintenance workload is relatively large.
Tencent Cloud Application Performance Management (APM) introduces a more convenient and efficient integration solution, which does not require building OpenTelemetry Collector by oneself, nor does it require complex configuration items. After a simple association, applications can directly report metrics through the OpenTelemetry API and output them to Tencent Cloud Prometheus Monitoring Service.
Prometheus Monitoring Service (TencentCloud Managed Service for Prometheus, TMP) is a highly available, fully managed service built on open-source Prometheus. It is highly integrated with Tencent Cloud Container Service (TKE), compatible with a rich variety of application components in the open-source ecosystem, and combines the alarm function of Tencent Cloud Observability Platform and the capability of Prometheus Alertmanager to provide users with efficient operations and maintenance capabilities without building, reducing development and Ops cost. For more details about Tencent Cloud Prometheus Monitoring Service, please refer to Prometheus Monitoring Overview. Associate Prometheus Instances
Before the application reports custom metrics, it is necessary to establish an association between the APM business system and the Prometheus instance, and configure the indicators that need to be synchronized from the APM server to the Prometheus instance.
1. Log in to the APM console, go to System configuration > Prometheus integration. 2. In Associated configuration, enable Prometheus association and select any Prometheus instance in the current region. Each APM business system can only be associated with up to one Prometheus instance in the same region. When performing the association operation for the first time in the current account, it is necessary to grant APM permission to access Prometheus resources. Complete the service authorization according to the prompts on the console, and the system will automatically create a role named APM_QCSLinkedRoleInPromInstance in Cloud Access Management (CAM).
3. Click Add metric synchronization rule to specify the metrics to be synchronized to the Prometheus instance.
For each synchronization rule, you can match the metric name based on three match methods: exact matching, prefix matching, and suffix matching. You can also specify the effective scope of the rule (it can be all applications of the business system or a specific application). When the APM server receives the custom metrics reported by the application, the metrics that meet the synchronization rules will be written to the associated Prometheus instance, and those that do not meet the rules will be discarded.
In addition to the custom tags filled in during reporting, APM also adds two additional tags, apm_instance and apm_service_name, which represent the APM business system ID and application name, respectively. This way, each Prometheus metric sample can be associated with a unique APM application.
Note:
The metrics written to the Prometheus instance will incur relevant fees according to the billing rules of Tencent Cloud Prometheus monitoring service. For details, see Prometheus Billing Overview. In addition to the custom metrics reported through the OpenTelemetry API, the inherent metrics generated by APM can also be synchronized to Prometheus. For details on APM inherent metrics, see APM Metric Protocol Standard. Metric Conversion Principle
OpenTelemetry aims to build a language-independent, multi-programming framework, and multi-observability platform unified standard. Therefore, in the application scenarios where metrics data is reported through the OpenTelemetry solution, Prometheus is not the only choice for metric storage platform. For this reason, the OpenTelemetry metric model and the Prometheus metric model are not exactly the same. Before writing the code for reporting data, it is necessary to understand the conversion logic from OpenTelemetry metrics to Prometheus metrics.
Data Model Of OpenTelemetry Protocol
OpenTelemetry metrics support the following metric types:
Gauge: Represents an instantaneous value. Generally, data points of type Gauge do not have an accumulative attribute, such as the current temperature, the speed of a car, etc.
Sum: Represents the total of all measured values within a certain time interval. If the data point has an accumulative attribute, it is a better choice to define it as Sum type, such as HTTP request counts, network traffic, etc. If the measured value is monotonically increasing, Sum can be identified as monotonic. For monotonic Sum, the latter measured value will never be less than the former one, and HTTP request counts conform to such a characteristic.
Histogram: Represents a data type that is reflected in the form of a histogram by aggregating all measurement records within a certain time interval. Histogram includes the sum and count fields obtained through aggregation, representing the number of records and the total of measured values respectively. In addition, there may also be max and min fields representing the maximum and minimum values, as well as a series of data buckets. Each data bucket has a clear boundary range and the number of records falling into this boundary range. Histogram significantly reduces the amount of metric data by introducing an aggregation mechanism, and also improves the readability of data.
ExponentialHistogram: ExponentialHistogram is an alternative expression form of Histogram. The only difference between it and Histogram is that ExponentialHistogram uses exponents as bucket boundaries and is suitable for conveying high dynamic range data with a smaller relative error.
Summary: Summary expresses data in the form of quantiles. In the latest OpenTelemetry protocol standard, Summary is no longer recommended for use, so try not to use this type of data point as much as possible.
In the OpenTelemetry metric protocol, for Sum, Histogram, and ExponentialHistogram types, there are also two different aggregation temporalities (Aggregation Temporality), which are used to distinguish how the data is accumulated. They are:
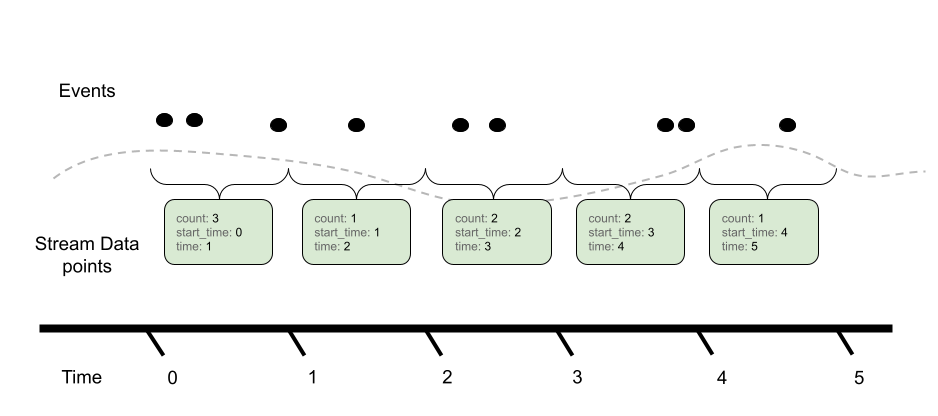
Delta: The time windows of the metric stream do not overlap, which is equivalent to recording the data increment for each interval period as time progresses in the metric stream.
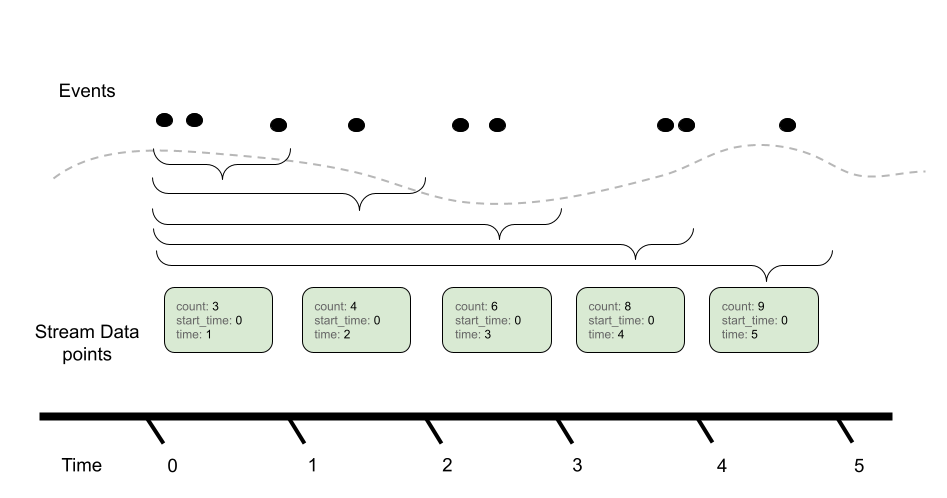
Cumulative: It is equivalent to recording the cumulative sum of data from the "start" in the metric stream. "Start" usually means the startup of a process/application.
Prometheus Indicator Model
Prometheus includes the following metric models, which are very similar in definition to OpenTelemetry's data model and are not reiterated in this article. Detailed information can be obtained by referring to the Prometheus official documentation.
Model Mapping
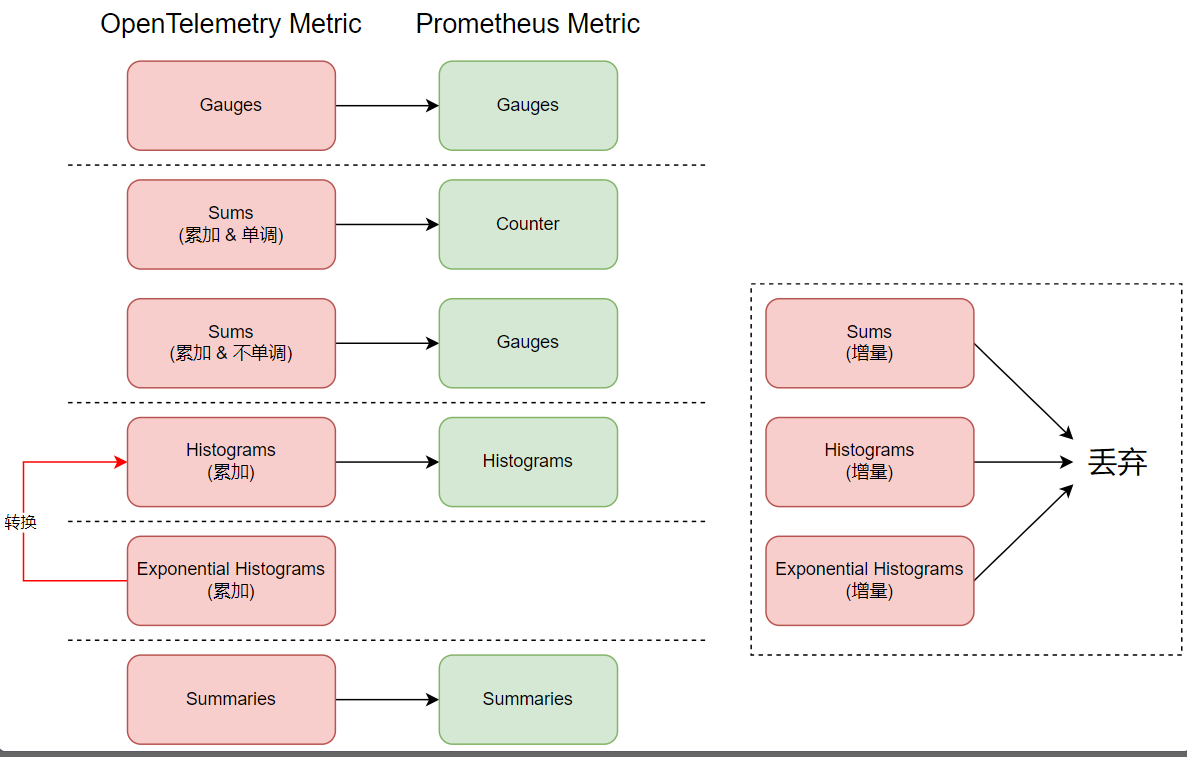
OpenTelemetry metrics will be converted to Prometheus metrics according to the following mapping relationship.
It should be noted that in Prometheus' data model, it is not compatible with incremental aggregation temporality (Delta Temporality), so APM will directly discard OpenTelemetry metrics that use Delta aggregation temporality. In the probes and SDKs provided by OpenTelemetry, there is an environment variable named OTEL_EXPORTER_OTLP_METRICS_TEMPORALITY_PREFERENCE or a system parameter named otel.exporter.otlp.metrics.temporality.preference, which is used to specify the aggregation temporality (Delta Temporality). Its default value is cumulative or CUMULATIVE. When the default value is maintained, there will be no discard problem due to compatibility.
For the Sum that is not monotonically increasing, since Prometheus' Counter metric must remain monotonically increasing, it cannot be directly saved as Prometheus' Counter metric. APM will convert it into Prometheus' Gauge metric.
For ExponentialHistogram, APM will convert it to Prometheus' Histogram metric, of course, this conversion will lose some precision.
Submitting Metrics Via the OpenTelemetry API
Understanding the conversion logic from OpenTelemetry metrics to Prometheus metrics can help us better understand the two data models and design the metric structure more reasonably. However, in the actual coding stage, the OpenTelemetry API shields the underlying details of the OpenTelemetry metric model through a series of encapsulations, allowing developers to easily get started with metric reporting.
Synchronous API and Asynchronous API
OpenTelemetry provides two API encoding models: synchronous and asynchronous. Developers can choose either based on their actual needs.
Synchronous Instruments: This is a more intuitive encoding method. When there is new measurement data, you can directly input the data by calling the API through the code. The QPS of the measurement system is a typical use case for the synchronous method. Every time a request is received, the API is actively called to increment the request count by 1.
Asynchronous Instruments: The asynchronous method requires registering a callback method/function first, which is used to read the measurement data. When the system needs to collect data (usually depending on the frequency at which the client SDK reports data to the APM server), the callback method is executed to obtain the measurement data. Measuring CPU temperature is a typical use case for the asynchronous method. Developers do not need to consider when to call the API to input CPU temperature data. Instead, they provide a method/function to read the CPU temperature, which is provided as a callback method/function to the asynchronous API.
Important Object
When writing code, the following objects are needed:
MeterProvider: MeterProvider is the only entry point for using the OpenTelemetry Metrics API. Usually, it only needs to be initialized once in an application.
Meter: A Meter is created by the MeterProvider and is used to create Instrument objects.
Instrument: An Instrument object is used to input measurement data. For different metric types and encoding models (synchronous/asynchronous), the OpenTelemetry API provides a series of Instrument implementations, including Counter, Asynchronous Counter, Histogram, Gauge, Asynchronous Gauge, UpDownCounter, etc. These objects are relatively easy to use, and you can easily master them by consulting the relevant OpenTelemetry API documentation.
Sample Code Writing
Taking a Java project as an example, we demonstrate how to report the quantity of received HTTP requests through the OpenTelemetry API.
1. Build a Spring Boot project and provide the relevant HTTP service API. For this step, please refer to the official Spring Boot documentation, which is not described in detail here. You can also replace Spring Boot with any other Java-based HTTP server.
2. Introduce the necessary dependencies in the project. Refer to the following Maven configuration, just introducing opentelemetry-api is enough.
<dependency>
<groupId>io.opentelemetry</groupId>
<artifactId>opentelemetry-api</artifactId>
<version>1.35.0</version>
</dependency>
3. Create an Instrument object.
In this example, we need to report the quantity of HTTP requests. Clearly, we need to use a metric of type Sum. Every time the application receives an HTTP request, the request count needs to be incremented by 1, so using the synchronous API is more reasonable. By consulting the OpenTelemetry API documentation, we can confirm that the Instrument object we need to use is Counter. Since the request volume is expressed as an integer, among the two implementations of Counter, we need to use LongCounter. With the following code, we can very simply create a LongCounter object for reporting the quantity of HTTP requests. This object only needs to be created once, and its corresponding metric name is http_request_total, because we use it as a member variable of RestController. @RestController
@RequestMapping("/metric")
public class MetricController {
private LongCounter httpRequestCounter;
@PostConstruct
public void init() {
String scope = this.getClass().getName();
OpenTelemetry openTelemetry = GlobalOpenTelemetry.get();
Meter meter = openTelemetry.getMeter(scope);
httpRequestCounter = meter.counterBuilder("http_request_total").setDescription("Counts HTTP request").build();
}
}
4. Quantity.
Refer to the following code snippet, increment the request count by 1 each time an HTTP request is received. In this example, an attribute tag with the Key method is also added to identify which method this request comes from.
@RestController
@RequestMapping("/metric")
public class MetricController {
private static final AttributeKey<String> METHOD_KEY = stringKey("method");
@RequestMapping("/order")
public String order() {
httpRequestCounter.add(1, Attributes.of(METHOD_KEY, "order"));
return "order + 1";
}
@RequestMapping("/pay")
public String pay() {
httpRequestCounter.add(1, Attributes.of(METHOD_KEY, "pay"));
return "pay + 1";
}
}
By following a few simple steps, the code writing is completed. It should be noted that not every call to the LongCounter.add() method will generate a new metric. The OpenTelemetry API will aggregate the data before reporting it, so the actual number of metrics written to Prometheus depends on the following two aspects:
1. The cardinality of tags. In this example, there is only one tag with the key method, so the number of methods determines the quantity of metrics submitted each time. In real scenarios, there may be more than one tag, and the cardinality of these tags together determines the quantity of metrics submitted each time.
2. Reporting frequency. It can be set through the otel.metric.export.interval system parameter. The default is 60 seconds, which generally can be kept as default. For more details, see Java SDK Configuration. For applications written in other languages, the method of reporting metrics is basically the same as that in Java. For details, please refer to the API/SDK documentation in the OpenTelemetry community. Note:
If you use the Tencent Cloud enhanced edition OpenTelemetry Java probe, please ensure that the probe version is not lower than 2.3-20241031, otherwise it will lead to reporting failure.
Reviewing Metrics Via Grafana
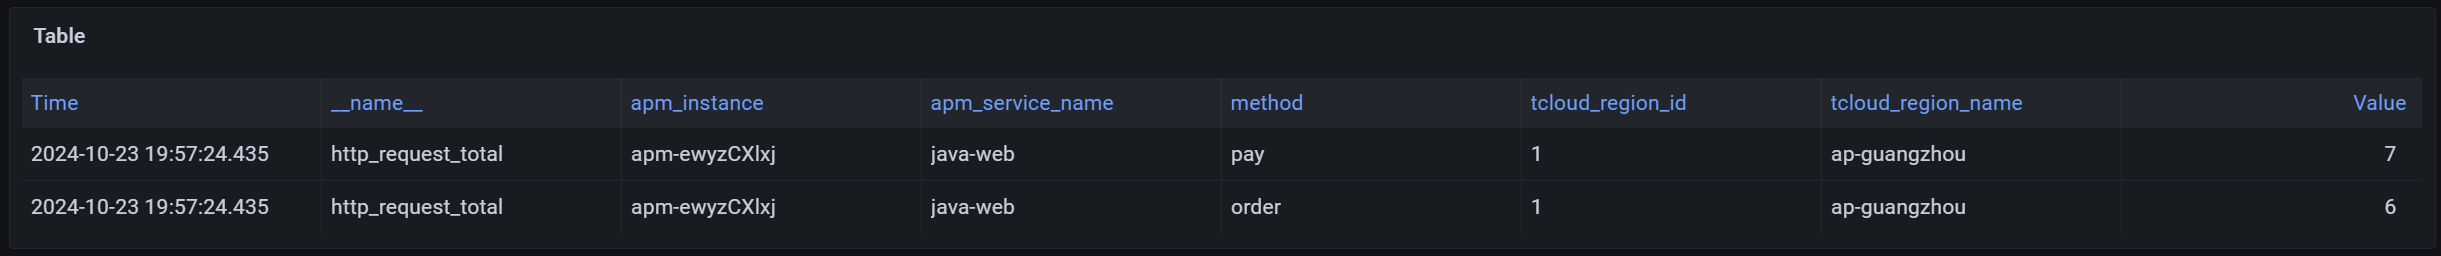
After the reporting is completed, go to the associated Prometheus instance and query the http_request_total metric through its associated Grafana service to view the reported data. Next, you can implement complex queries based on PromQL statements and customize rich charts through Grafana.
If you don't find the http_request_total metric at this time, please make sure that you have configured a synchronization rule for this metric name when associating with the Prometheus instance. For metrics that do not match the synchronization rule, the APM server will discard them.
Since APM adds two additional tags, apm_instance and apm_service_name, during metric conversion, which represent the APM business system ID and application name respectively, you can create business system and application filter conditions based on these two tags.
Associate Display On Tencent Cloud Observability Platform Dashboard
After completing the APM-Prometheus Data Integration, in addition to custom chart display through Grafana, you can also customize chart displays through the Tencent Cloud Observability Platform Dashboard and support embedding the display results into the application details page of the APM console. The Dashboard is an intelligent panel provided by the Tencent Cloud Observability Platform for cloud product metrics monitoring data, featuring visualization and analysis capabilities. For more information about the Dashboard, please refer to Dashboard Overview. Create a Dashboard With Prometheus As the Data Source
2. Click the button above the dashboard, and select Template Variable in the pop-up dropdown list. 3. Click Initialize Prometheus template variables, and the system will automatically generate two template variables: Region and Prometheus instance.
4. After clicking Save in the upper right corner of the dashboard, you will get a dashboard with Prometheus as the data source. By selecting specific regions and Prometheus instances from the dropdown list, you can obtain metric data from any instance of Tencent Cloud's Prometheus Monitoring Service. Refer to Chart Configuration to create a rich customized dashboard based on PromQL statements and the charts built into the dashboard, which is similar to how Grafana is used. Associate and Display Dashboard In APM Console
In the process of using Prometheus metrics and the Dashboard, there is a very common scenario:
For the configured dashboard, filter the metric data from the dimension of the APM application and display the chart.
Embed the displayed result into the application details of the APM console.
Multiple applications in the same APM business system share the same dashboard, and no duplicate configuration is required.
For this usage scenario, it can be easily achieved through APM-Dashboard association.
Note:
Before performing the following steps, make sure that the following preliminary operations have been completed:
Complete the APM-Prometheus association.
Write metric data to the Prometheus instance through the OpenTelemetry API.
Create a Dashboard with Prometheus as the data source.
Specify the Prometheus instance in the filter option of the Dashboard.
Directions
1. Configure the association between the application and the dashboard. Go to APM Console > System configuration > Business system configuration, and in the Dashboard Association section, associate the created dashboard, ensuring that it uses the Prometheus data source. Associating a dashboard in the business system means that all applications in that business system are associated. You can also override the business system-level configuration for specific applications in System configuration >Application configuration. 2. Configure necessary template variables.
To enable the Dashboard to filter metrics based on specific applications, it is necessary to add necessary application filtering options to the Dashboard, including two template variables: business system and application. Looking back at the previous chapters, after completing the APM-Prometheus association, metrics written through the OpenTelemetry API have additionally added apm_instance and apm_service_name two tags, representing the APM business system ID and application name respectively. With these two tags, it is very convenient to add the necessary template variables to the Dashboard.
2.1 Go to Dashboard, enter Dashboard Settings > Template Variable, and refer to the configuration items in the figure below to add a business system ID template variable. Please ensure that you set Variable Name to apm_instance, Variable type toQuery (label_values), and the Query data source includes the unique label apm_instance: 2.2 Next, refer to the configuration items in the figure below to add an application name template variable. Please ensure that you set Variable Name to apm_service_name, Variable Type toQuery (label_values), and the Query Condition includes the unique label apm_service_name.
2.3 After completing all settings, check again whether the dashboard contains the following four necessary template variables.
3. Add the business system ID and application name filter conditions to the PromQL statement in the chart.
In the following HTTP Request Count chart, the PromQL statement is sum by(method) (irate(http_request_total{apm_instance="$apm_instance",apm_service_name="$apm_service_name"}[5m]))
This allows data to be filtered based on the business system ID and application name.
After completing the configuration, check whether the chart can be displayed correctly, and check whether the two filter conditions business system ID and application name can work normally.
4. View the embedded dashboard in the application details.
Go to APM Console > Application List, select the application associated with the Dashboard, and you will see the Dashboard tab. On this tab, the Dashboard will be displayed in an embedded manner. Since the four necessary template variables, Prometheus region, Prometheus instance, business system ID, and application name, have been automatically specified, these four filter conditions are hidden in the embedded view. If multiple applications are associated with the same Dashboard, by switching between different applications, you can easily view the HTTP request count for each application. To this point, all steps for associating APM with the Dashboard have been completed.
Note:
For dashboards that do not use Prometheus as a data source, it is also possible to associate APM with the dashboard, displaying the dashboard charts within the application details in an embedded manner. Although the system cannot automatically fill in application-related filter conditions, in specific scenarios, such usage can also combine the capabilities of APM and the dashboard well, bringing more convenience to users.