The Aerospike Exporter is a Prometheus metrics exporter for Aerospike databases, enabling users to monitor and collect performance metrics and statistics from Aerospike. It provides real-time monitoring of the health, performance, and load of Aerospike clusters, assisting in troubleshooting, performance optimization, and capacity planning. By exporting these metrics to Prometheus, users can leverage Prometheus’ powerful features for data visualization, alarming, and analysis. Tencent Cloud Observability Platform (TCOP) Prometheus offers Aerospike Exporter integration and pre-configured Grafana monitoring dashboards.
2. Select the corresponding Prometheus instance from the instance list.
3. Go to the instance details page, select Data Collection > Integration Center.
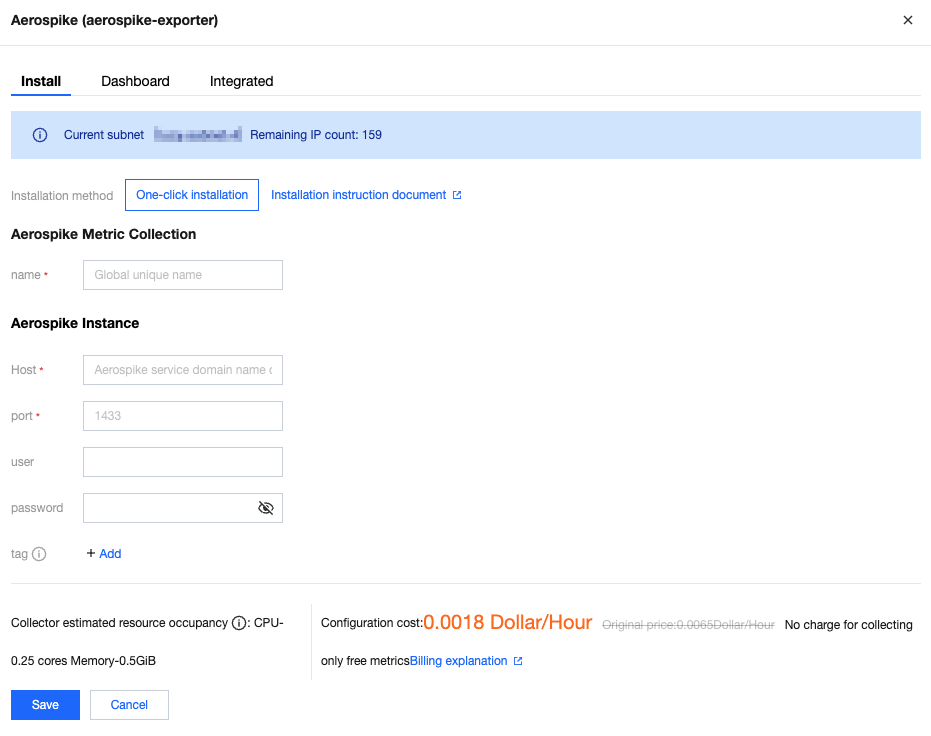
4. In the Integration Center, locate and click Aerospike to open an installation window. On the installation page, enter details such as the metric collection name and address, then click Save.
Configuration Instructions
Parameters
Description
name
Exporter name, which should meet the following requirements:
The name should be unique.
The name should conform to the following regular expression: '^[a-z0-9]([-a-z0-9]*[a-z0-9])?(\.[a-z0-9]([-a-z0-9]*[a-z0-9])?)*$'.
Host
The domain name of the Aerospike database.
port
The port of the Aerospike database.
user
The username of the Aerospike database.
password
The password of the Aerospike database.
tag
Custom labels for metrics.
Method 2: Custom Installation
Description
TKE is recommended for convenient installation and management of the Exporter.
Prerequisites
A TKE cluster has been created in the region and VPC of the corresponding Prometheus instance, and a namespace has been created for the cluster.
In the TMP console, select the corresponding Prometheus instance, and in Data Collection > Integration with TKE, locate the corresponding container cluster to complete the cluster association. For details, see the guide on Integration with TKE.
1. In the left menu, choose Workload > Deployment to access the Deployment management page.
2. Click Create YAML in the upper right corner of the page to create a YAML file, and select the corresponding namespace for server deployment. The following part shows how to deploy the Exporter by using a YAML file. Sample configurations are as follows:
apiVersion: v1
kind: Secret
metadata:
name: aerospike-secret-test # Adjust to the corresponding name based on business requirements.
namespace: aerospike-demo # Adjust to the corresponding namespace based on business requirements.
type: Opaque
stringData:
ape.toml: |-
[Agent]
# metrics server timeout in seconds
timeout=30
# support system statistics also
refresh_system_stats =true
# prometheus binding port
bind=":8080"# Expose the metric port.
[Aerospike]
db_host ="127.0.0.1"# Adjust to the corresponding IP or domain name based on business requirements.
db_port =3000# Adjust to the corresponding port based on business requirements.
user ="admin"# Adjust to the corresponding username based on business requirements.
password ="admin"# Adjust to the corresponding password based on business requirements.
# timeout for sending commands to the server node in seconds
timeout=30
gauge_stats_list.toml: |-
# This file represents a list of metrics which are treated as Gauges while exporting to Prometheus or some other Observability tool.
# to know more about these stats, please visit https://docs.aerospike.com
#
# SETS: below section define all Sets stats which are treated as Gauges
#
sets_gauge_stats =[
"device_data_bytes",
"index_populating",
"memory_data_bytes",
"objects",
"sindexes",
"tombstones",
"truncate_lut",
# 7.0 changes
"data_used_bytes",
"truncating",
]
#
# XDR: below section define all XDR stats which are treated as Gauges
#
xdr_gauge_stats =[
"compression_ratio",
"in_progress",
"in_queue",
"lag",
"lap_us",
"latency_ms",
"nodes",
"recoveries_pending",
"throughput",
"uncompressed_pct",
]
#
# Sindex: below section define all Sindex stats which are treated as Gauges
#
sindex_gauge_stats =[
"entries_per_bval",
"entries_per_rec",
"entries",
"histogram", # removed in server6.0
"ibtr_memory_used", # removed in server6.0
"keys", # removed in server6.0
"load_pct",
"load_time",
"loadtime", # removed in server6.0
"memory_used", # deprecated in server6.3 version and replaced by used_bytes
"nbtr_memory_used", # removed in server6.0
"query_basic_avg_rec_count", # removed in server6.0
"used_bytes", # added in server6.3 represents memory used by data (aka memory_used)
]
#
# Node: below section define all Node stats which are treated as Gauges
#
node_gauge_stats =[
"batch_index_proto_compression_ratio",
"batch_index_proto_uncompressed_pct",
"batch_index_queue",
"batch_index_unused_buffers",
"client_connections",
"cluster_clock_skew_ms",
"cluster_clock_skew_stop_writes_sec",
"cluster_integrity",
"cluster_is_member",
"cluster_max_compatibility_id",
"cluster_min_compatibility_id",
"cluster_size",
"fabric_bulk_recv_rate",
"fabric_bulk_send_rate",
"fabric_connections",
"fabric_ctrl_recv_rate",
"fabric_ctrl_send_rate",
"fabric_meta_recv_rate",
"fabric_meta_send_rate",
"fabric_rw_recv_rate",
"fabric_rw_send_rate",
"failed_best_practices",
"heap_active_kbytes",
"heap_allocated_kbytes",
"heap_efficiency_pct",
"heap_mapped_kbytes",
"heap_site_count",
"heartbeat_connections",
"info_queue",
"migrate_partitions_remaining",
"objects",
"process_cpu_pct",
"proxy_in_progress",
"queries_active",
"rw_in_progress",
"scans_active",
"sindex_gc_list_creation_time",
"sindex_gc_list_deletion_time",
"system_free_mem_pct",
"system_kernel_cpu_pct",
"system_total_cpu_pct",
"system_user_cpu_pct",
"threads_detached",
"threads_joinable",
"threads_pool_active",
"threads_pool_total",
"time_since_rebalance",
"tombstones",
"tree_gc_queue",
"tsvc_queue",
#
# 4.x XDR stats
"dlog_free_pct",
"dlog_used_objects",
"xdr_active_failed_node_sessions",
"xdr_active_link_down_sessions",
"xdr_global_lastshiptime",
"xdr_read_active_avg_pct",
"xdr_read_idle_avg_pct",
"xdr_read_latency_avg",
"xdr_read_reqq_used_pct",
"xdr_read_reqq_used",
"xdr_read_respq_used",
"xdr_read_txnq_used_pct",
"xdr_read_txnq_used",
"xdr_ship_compression_avg_pct",
"xdr_ship_inflight_objects",
"xdr_ship_latency_avg",
"xdr_ship_outstanding_objects",
"xdr_throughput",
"xdr_timelag",
]
#
# Namespace: below section define all Namespace stats which are treated as Gauges
#
namespace_gauge_stats =[
"appeals_rx_active",
"appeals_tx_active",
"appeals_tx_remaining",
"available_bin_names",
"cache_read_pct",
"clock_skew_stop_writes",
"dead_partitions",
"defrag_q",
"device_available_pct",
"device_compression_ratio",
"device_free_pct",
"device_total_bytes",
"device_used_bytes",
"effective_is_quiesced",
"effective_prefer_uniform_balance",
"effective_replication_factor",
"evict_ttl",
"hwm_breached",
"index_flash_alloc_bytes",
"index_flash_alloc_pct",
"index_flash_used_bytes",
"index_flash_used_pct",
"index_pmem_used_bytes",
"index_pmem_used_pct",
"master_objects",
"master_tombstones",
"memory_free_pct",
"memory_used_bytes",
"memory_used_data_bytes",
"memory_used_index_bytes",
"memory_used_set_index_bytes",
"memory_used_sindex_bytes",
"migrate_rx_instances",
"migrate_rx_partitions_active",
"migrate_rx_partitions_initial",
"migrate_rx_partitions_remaining",
"migrate_signals_active",
"migrate_signals_remaining",
"migrate_tx_instances",
"migrate_tx_partitions_active",
"migrate_tx_partitions_imbalance",
"migrate_tx_partitions_initial",
"migrate_tx_partitions_lead_remaining",
"migrate_tx_partitions_remaining",
"n_nodes_quiesced",
"non_expirable_objects",
"non_replica_objects",
"non_replica_tombstones",
"ns_cluster_size",
"nsup_cycle_deleted_pct",
"nsup_cycle_duration",
"nsup_cycle_sleep_pct",
"objects",
"pending_quiesce",
"pmem_available_pct",
"pmem_compression_ratio",
"pmem_free_pct",
"pmem_total_bytes",
"pmem_used_bytes",
"prole_objects",
"prole_tombstones",
"query_aggr_avg_rec_count",
"query_basic_avg_rec_count",
"query_proto_compression_ratio",
"query_proto_uncompressed_pct",
"record_proto_compression_ratio",
"record_proto_uncompressed_pct",
"scan_proto_compression_ratio",
"scan_proto_uncompressed_pct",
"shadow_write_q",
"stop_writes",
"storage-engine.device.defrag_q",
"storage-engine.device.free_wblocks",
"storage-engine.device.shadow_write_q",
"storage-engine.device.used_bytes",
"storage-engine.device.write_q",
"storage-engine.device.age",
"storage-engine.file.defrag_q",
"storage-engine.file.free_wblocks",
"storage-engine.file.shadow_write_q",
"storage-engine.file.used_bytes",
"storage-engine.file.write_q",
"storage-engine.file.age",
"storage-engine.stripe.defrag_q",
"storage-engine.stripe.free_wblocks",
"storage-engine.stripe.shadow_write_q",
"storage-engine.stripe.used_bytes",
"storage-engine.stripe.write_q",
"storage-engine.stripe.age",
"storage-engine.stripe.backing_write_q",
"migrate_fresh_partitions",
"tombstones",
"truncate_lut",
"unavailable_partitions",
"unreplicated_records",
"write_q",
"xdr_bin_cemeteries",
"xdr_tombstones",
# added in 7.0
"data_avail_pct",
"data_compression_ratio",
"data_total_bytes",
"data_used_bytes",
"data_used_pct",
"index_mounts_used_pct",
"index_used_bytes",
"indexes_memory_used_pct",
"set_index_used_bytes",
"sindex_mounts_used_pct",
"sindex_used_bytes",
"truncating",
]
# System Info Gauge metrics list
#
system_info_gauge_stats =[
"",
]
Step 3: Deploying Aerospike Exporter
1. In the left menu, choose Workload > Deployment to access the Deployment management page.
2. Click Create YAML in the upper right corner of the page to create a YAML file, and select the corresponding namespace for server deployment. The following part shows how to deploy the Exporter by using a YAML file. Sample configurations are as follows:
apiVersion: apps/v1
kind: Deployment
metadata:
labels:
k8s-app: aerospike-exporter # Adjust to the corresponding name based on business requirements. It is recommended to include information about the Aerospike instance.
name: aerospike-exporter # Adjust to the corresponding name based on business requirements. It is recommended to include information about the Aerospike instance.
namespace: aerospike-demo # Adjust to the corresponding namespace based on business requirements.
spec:
replicas: 1
selector:
matchLabels:
k8s-app: aerospike-exporter # Adjust to the corresponding name based on business requirements. It is recommended to include information about the Aerospike instance.
template:
metadata:
labels:
k8s-app: aerospike-exporter # Adjust to the corresponding name based on business requirements. It is recommended to include information about the Aerospike instance.
spec:
volumes:
- name: sec
secret:
defaultMode: 420
secretName: aerospike-secret-test # Corresponds to the configuration name in step 2.
- containerPort: 8080# Corresponds to the metric export port configured in step 2.
name: metrics
livenessProbe:
tcpSocket:
port: metrics
readinessProbe:
tcpSocket:
port: metrics
volumeMounts:
- mountPath: /etc/aerospike-prometheus-exporter
name: sec
readOnly: true
Step 4: Verification
1. Click the Deployment created in the previous step on the Deployment page to go to the Deployment management page.
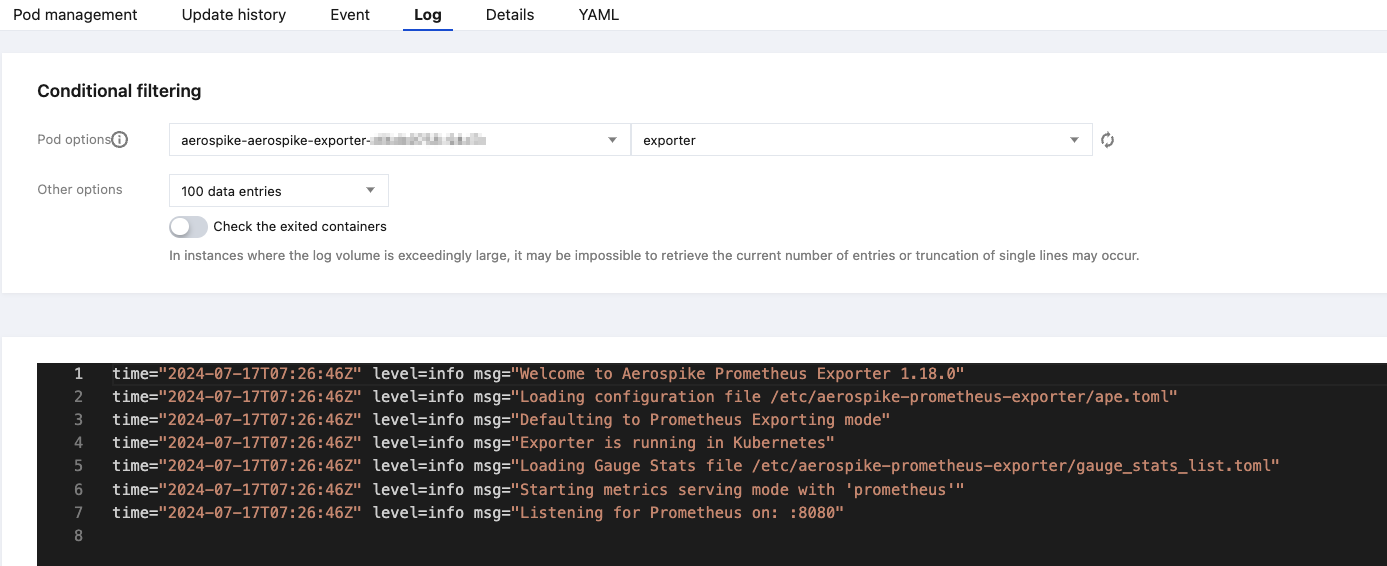
2. Click the Log tab. If no error messages are displayed, the setup is successful, as shown below:
3. Click the Pod tab to enter the Pod page.
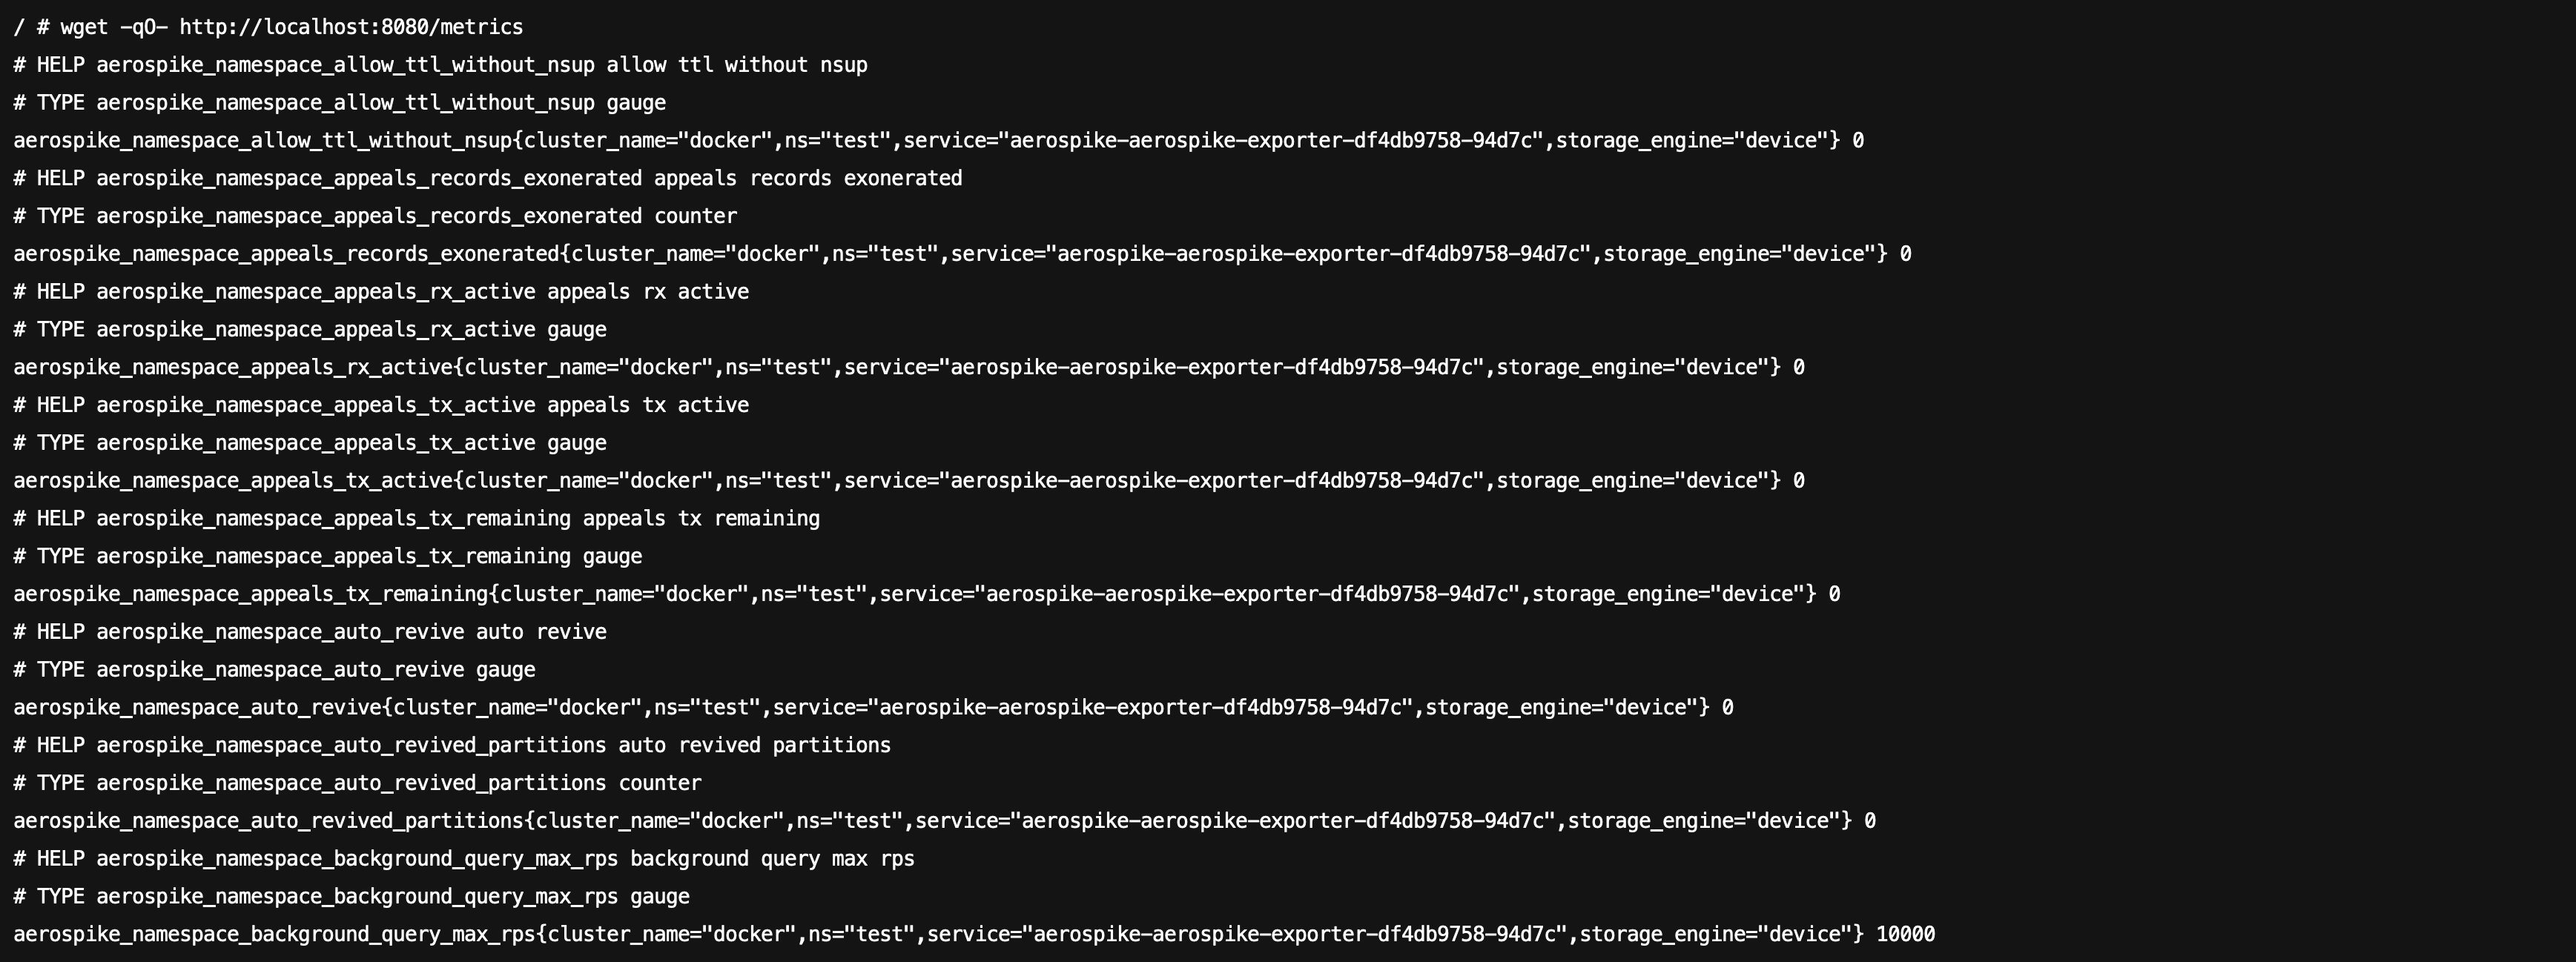
4. Click Remote login under the operation bar on the right to log in to the Pod. In the command-line window, execute the following wget command for the address exposed by the Exporter to retrieve the corresponding Aerospike metrics. If no data is retrieved, check whether the connection string is correct. Details are as follows:
wget -qO- http://localhost:8080/metrics
The successful outcome is shown in the following figure:
Step 5: Adding a Collection Task
1. Log in to the TMP console and select the corresponding Prometheus instance to go to the management page.
2. In Data Collection > Integrate with TKE, select the associated cluster, and select Data Collection Configuration > Customize Monitoring Configuration > Via YAML to add a collection task.
3. Add a PodMonitor via service discovery to define the collection task. The YAML example is as follows:
apiVersion: monitoring.coreos.com/v1
kind: PodMonitor
metadata:
name: aerospike-exporter # Enter a unique name.
namespace: cm-prometheus # Pay-as-you-go instance: Use the namespace of the cluster. Monthly subscription instance (no longer available): The namespace is fixed. Do not change it.
spec:
podMetricsEndpoints:
-interval: 30s
port: metric-port # Enter the port of the Prometheus Exporter in the Pod YAML file.
path: /metrics # Enter the path of the Prometheus Exporter. Default value: /metrics.
relabelings:
-action: replace
sourceLabels:
- instance
regex: (.*)
targetLabel: instance
replacement:'crs-xxxxxx'# Replace with the corresponding Aerospike instance ID.
namespaceSelector:# Select the namespace where the Aerospike Exporter pod to be monitored is located.
matchNames:
- aerospike-demo
selector:# Enter the labels of the Pod to be monitored to locate the target Pod.
matchLabels:
k8s-app: aerospike-exporter
Viewing Monitoring Information
Prerequisites
The Prometheus instance has been bound to a Grafana instance.
Operation Steps
1. Log in to the TMP console and select the corresponding Prometheus instance to go to the management page.
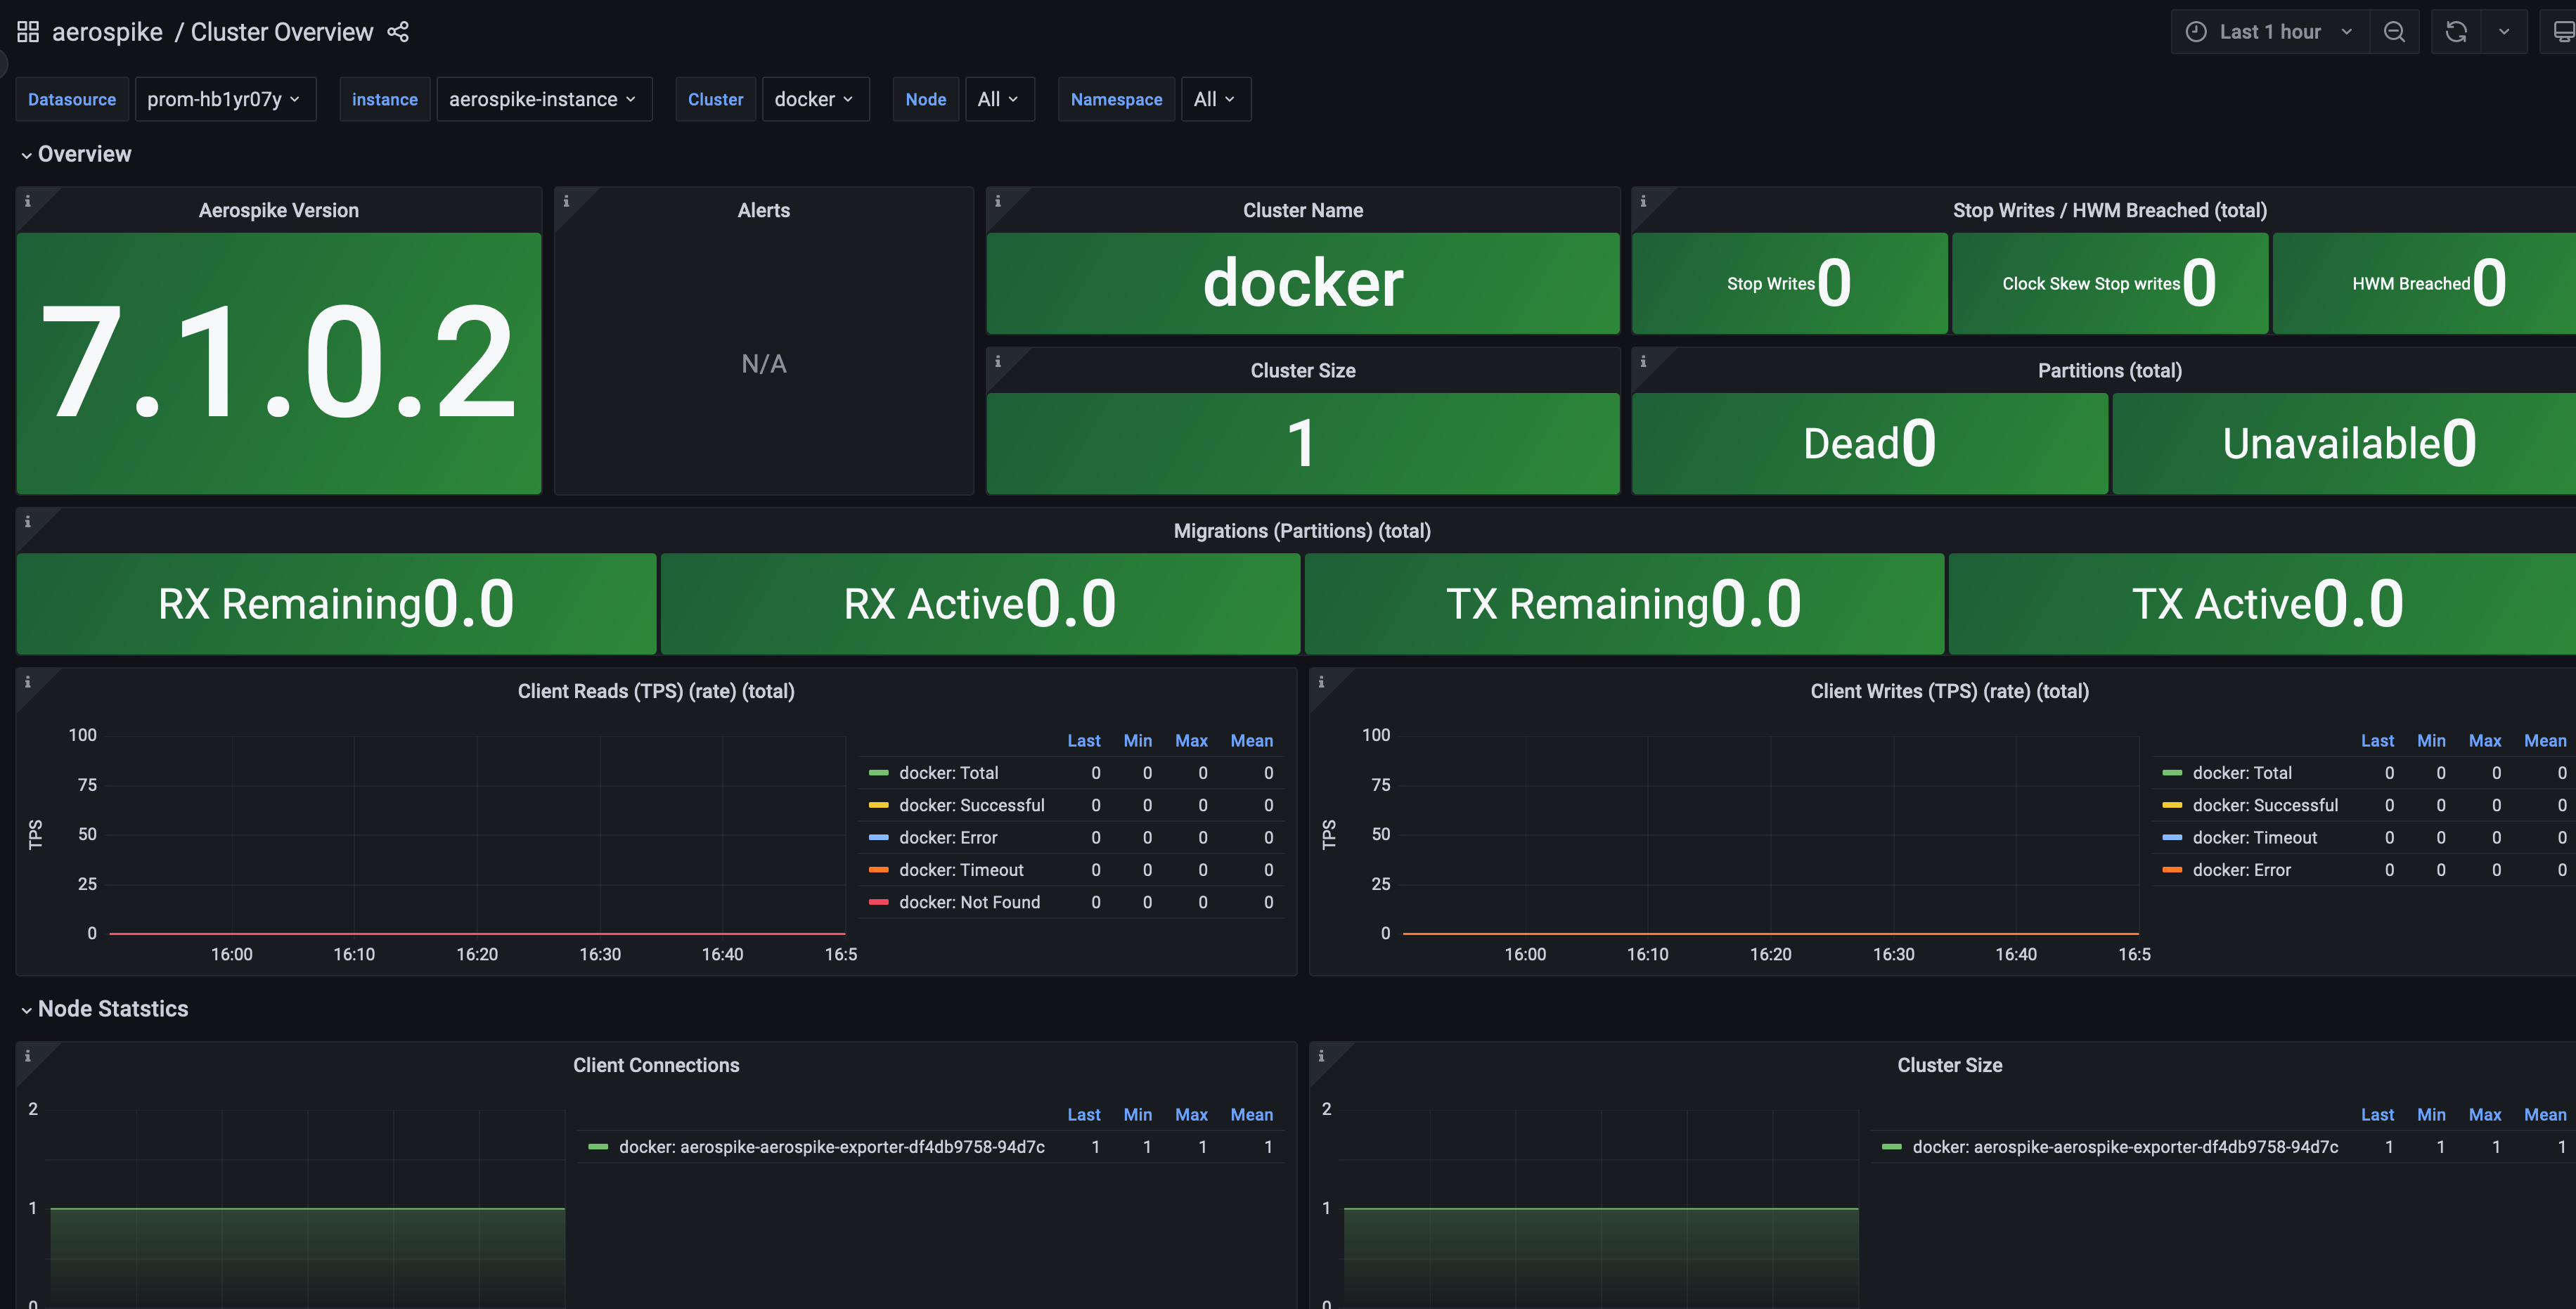
2. On the Basic Information page of the instance, locate the bound Grafana address. Open and log in, then navigate to the Aerospike folder to find the monitoring dashboard for the Aerospike instance. View the relevant monitoring data for the instance, as shown below:
Configuring Alarm
TMP supports configuring alarm rules based on the actual business situation. For details, see Creating Alarm Rules.
Appendix: Key Configuration Items in the Aerospike Exporter Configuration File
Agent Configuration Items
Name
Description
bind
Metric export port. The default port is 9145.
cert_file
Certificate file used for signing.
key_file
Certificate file used for signing.
root_ca
Certificate file used for signing.
basic_auth_username
Username for HTTP authentication.
basic_auth_password
Password for HTTP authentication.
timeout
Timeout for metric fetching.
labels
Custom tags.
refresh_system_stats
Enables system data collection.
Aerospike Configuration Items
Name
Description
db_host
The domain name or IP of the Aerospike database.
db_port
The service port of the Aerospike database.
auth_mode
Aerospike verification mode. The default value is internal. The default values include external, internal, pki, and "".