Prometheus provides an official Go library to collect and expose the monitoring data. This document describes how to use it to expose the Go runtime data and use TMP to collect metrics and display data with some basic samples.
You can run the following go get commands to install the relevant dependencies:
go get github.com/prometheus/client_golang/prometheus
go get github.com/prometheus/client_golang/prometheus/promauto
go get github.com/prometheus/client_golang/prometheus/promhttp
Start (Runtime Metrics)
1. Prepare an HTTP service with the commonly used path /metrics. You can directly use the Handler function provided in prometheus/promhttp.
The following is a sample Go application, which exposes some default metrics (including runtime, process, and build metrics) through http://localhost:2112/metrics.
2. Run the following command to start the application.
go run main.go
3. Run the following command to access the basic built-in metric data.
curl http://localhost:2112/metrics
Application Layer Metrics
1. The above sample only exposes some basic built-in metrics. For metrics at the application layer, you need to add them additionally (we will provide some SDKs in the future for easier integration). The following sample exposes a Counter metric named myapp_processed_ops_total to count the currently completed operations. The operation is performed once every 2 seconds, and the count increases by 1 each time.
2. Run the following command to start the application.
go run main.go
3. Run the following command to access the exposed metrics.
curl http://localhost:2112/metrics
From the output result, you can see the information related to the myapp_processed_ops_totalcounter, including the help documentation, type information, metric name, and current value, as shown below.
# HELP myapp_processed_ops_total The total number of processed events
# TYPE myapp_processed_ops_total counter
myapp_processed_ops_total 666
Using TMP
Two samples are used above to show how to use the Prometheus Go library to expose application metric data. However, because the exposed data is in text format, you’ll need to set up and maintain an additional Prometheus service to collect metrics, which may require additional Grafana dashboards for visual display.
In contrast, if you use TMP, you can directly skip the above steps and achieve the same purpose with just a few clicks. For more information, please see Getting Started.
Packaging and deploying application
1. A Go application generally can use a Dockerfile in the following format (it should be modified as needed).
3. You need to define a Kubernetes resource based on your application type. Here, a Deployment is used as shown below.
apiVersion: apps/v1
kind: Deployment
metadata:
name: golang-app-demo
labels:
app: golang-app-demo
spec:
replicas:3
selector:
matchLabels:
app: golang-app-demo
template:
metadata:
labels:
app: golang-app-demo
spec:
containers:
- name: golang-exe-demo:v1
image: nginx:1.14.2
ports:
- containerPort:80
4. You also need a Kubernetes Service for scrape configuration and load balancing.
apiVersion: v1
kind: Service
metadata:
name: golang-app-demo
spec:
selector:
app: golang-app-demo
ports:
- protocol: TCP
port:80
targetPort:80
Note:
You must add a label to identify the current application. The label name doesn't necessarily need to be app, but there must be a label with the similar meaning. You can add other extended labels by relabeling when adding a data collection task subsequently.
5. You can use the TKE console or directly use kubectl to submit the resource definitions to Kubernetes and wait for successful creation.
Adding data collection task
After the service runs, you need to configure TMP to discover and collect the monitoring metrics in the following steps:
1. Log in to the TMP console and select the target TMP instance to enter the management page.
2. Click a cluster ID in the TKE cluster list to enter the Integrate with TKE page.
3. In Scrape Configuration, add a ServiceMonitor. Currently, TMP supports discovering the corresponding target instance address through labels; therefore, you can add some specific K8s labels to some services, which will be automatically identified by TMP after configuration, eliminating your need to add scrape tasks for all services one by one. The configuration information for the above sample is as follows:
Note:
The port value is the spec/ports/name value in the Service YAML configuration file.
apiVersion: monitoring.coreos.com/v1
kind: ServiceMonitor
metadata:
name:go-demo # Enter a unique name
namespace: cm-prometheus # The namespace is fixed. Do not change it
spec:
endpoints:
- interval: 30s
# Enter the name of the corresponding port of the Prometheus exporter in the Service YAML configuration file
port:2112
# Enter the value of the corresponding path of the Prometheus exporter. If it is not specified, it will be `/metrics` by default
path:/metrics
relabelings:
# ** There must be a label named `application`. Here, suppose that K8s has a label named `app`
# Use the `replace` action of `relabel` to replace it with `application`
- action: replace
sourceLabels:[__meta_kubernetes_pod_label_app]
targetLabel: application
# Select the namespace where the Service to be monitored resides
namespaceSelector:
matchNames:
- golang-demo
# Enter the label value of the Service to be monitored to locate the target Service
selector:
matchLabels:
app: golang-app-demo
Note:
You must configure the label named application in the sample; otherwise, you cannot use some other out-of-the-box integration features of TMP. For more advanced usage, please see ServiceMonitor or PodMonitor.
Viewing monitoring information
1. In the TMP instance list, find the corresponding TMP instance, click
on the right of the instance ID to open your Grafana page, and enter your account and password to access the Grafana visual dashboard operation section.
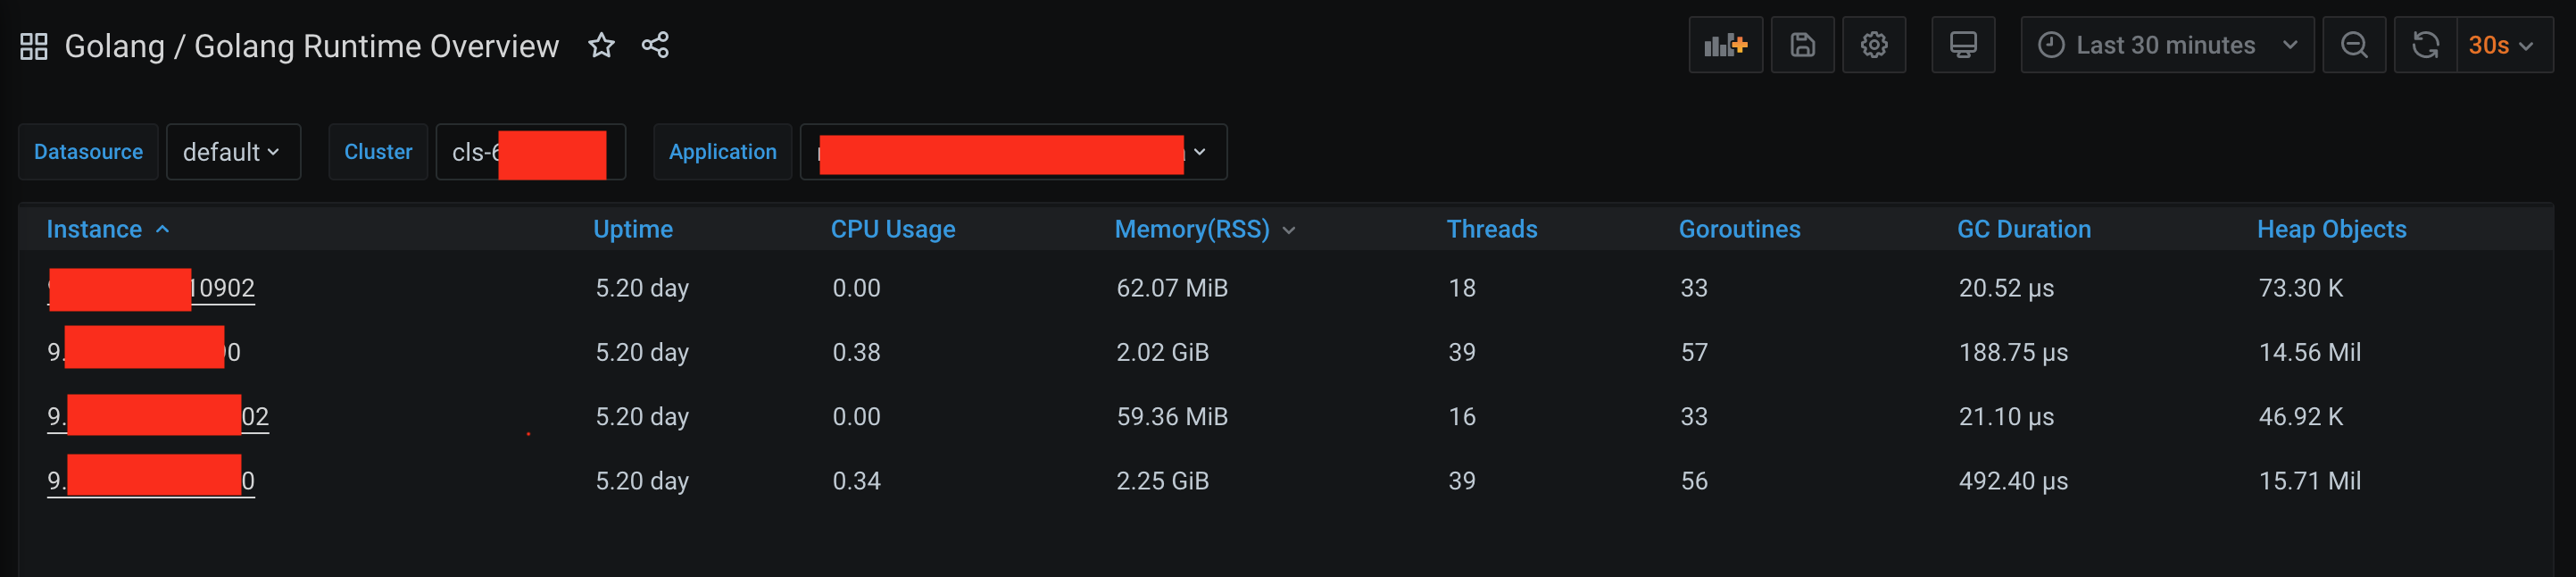
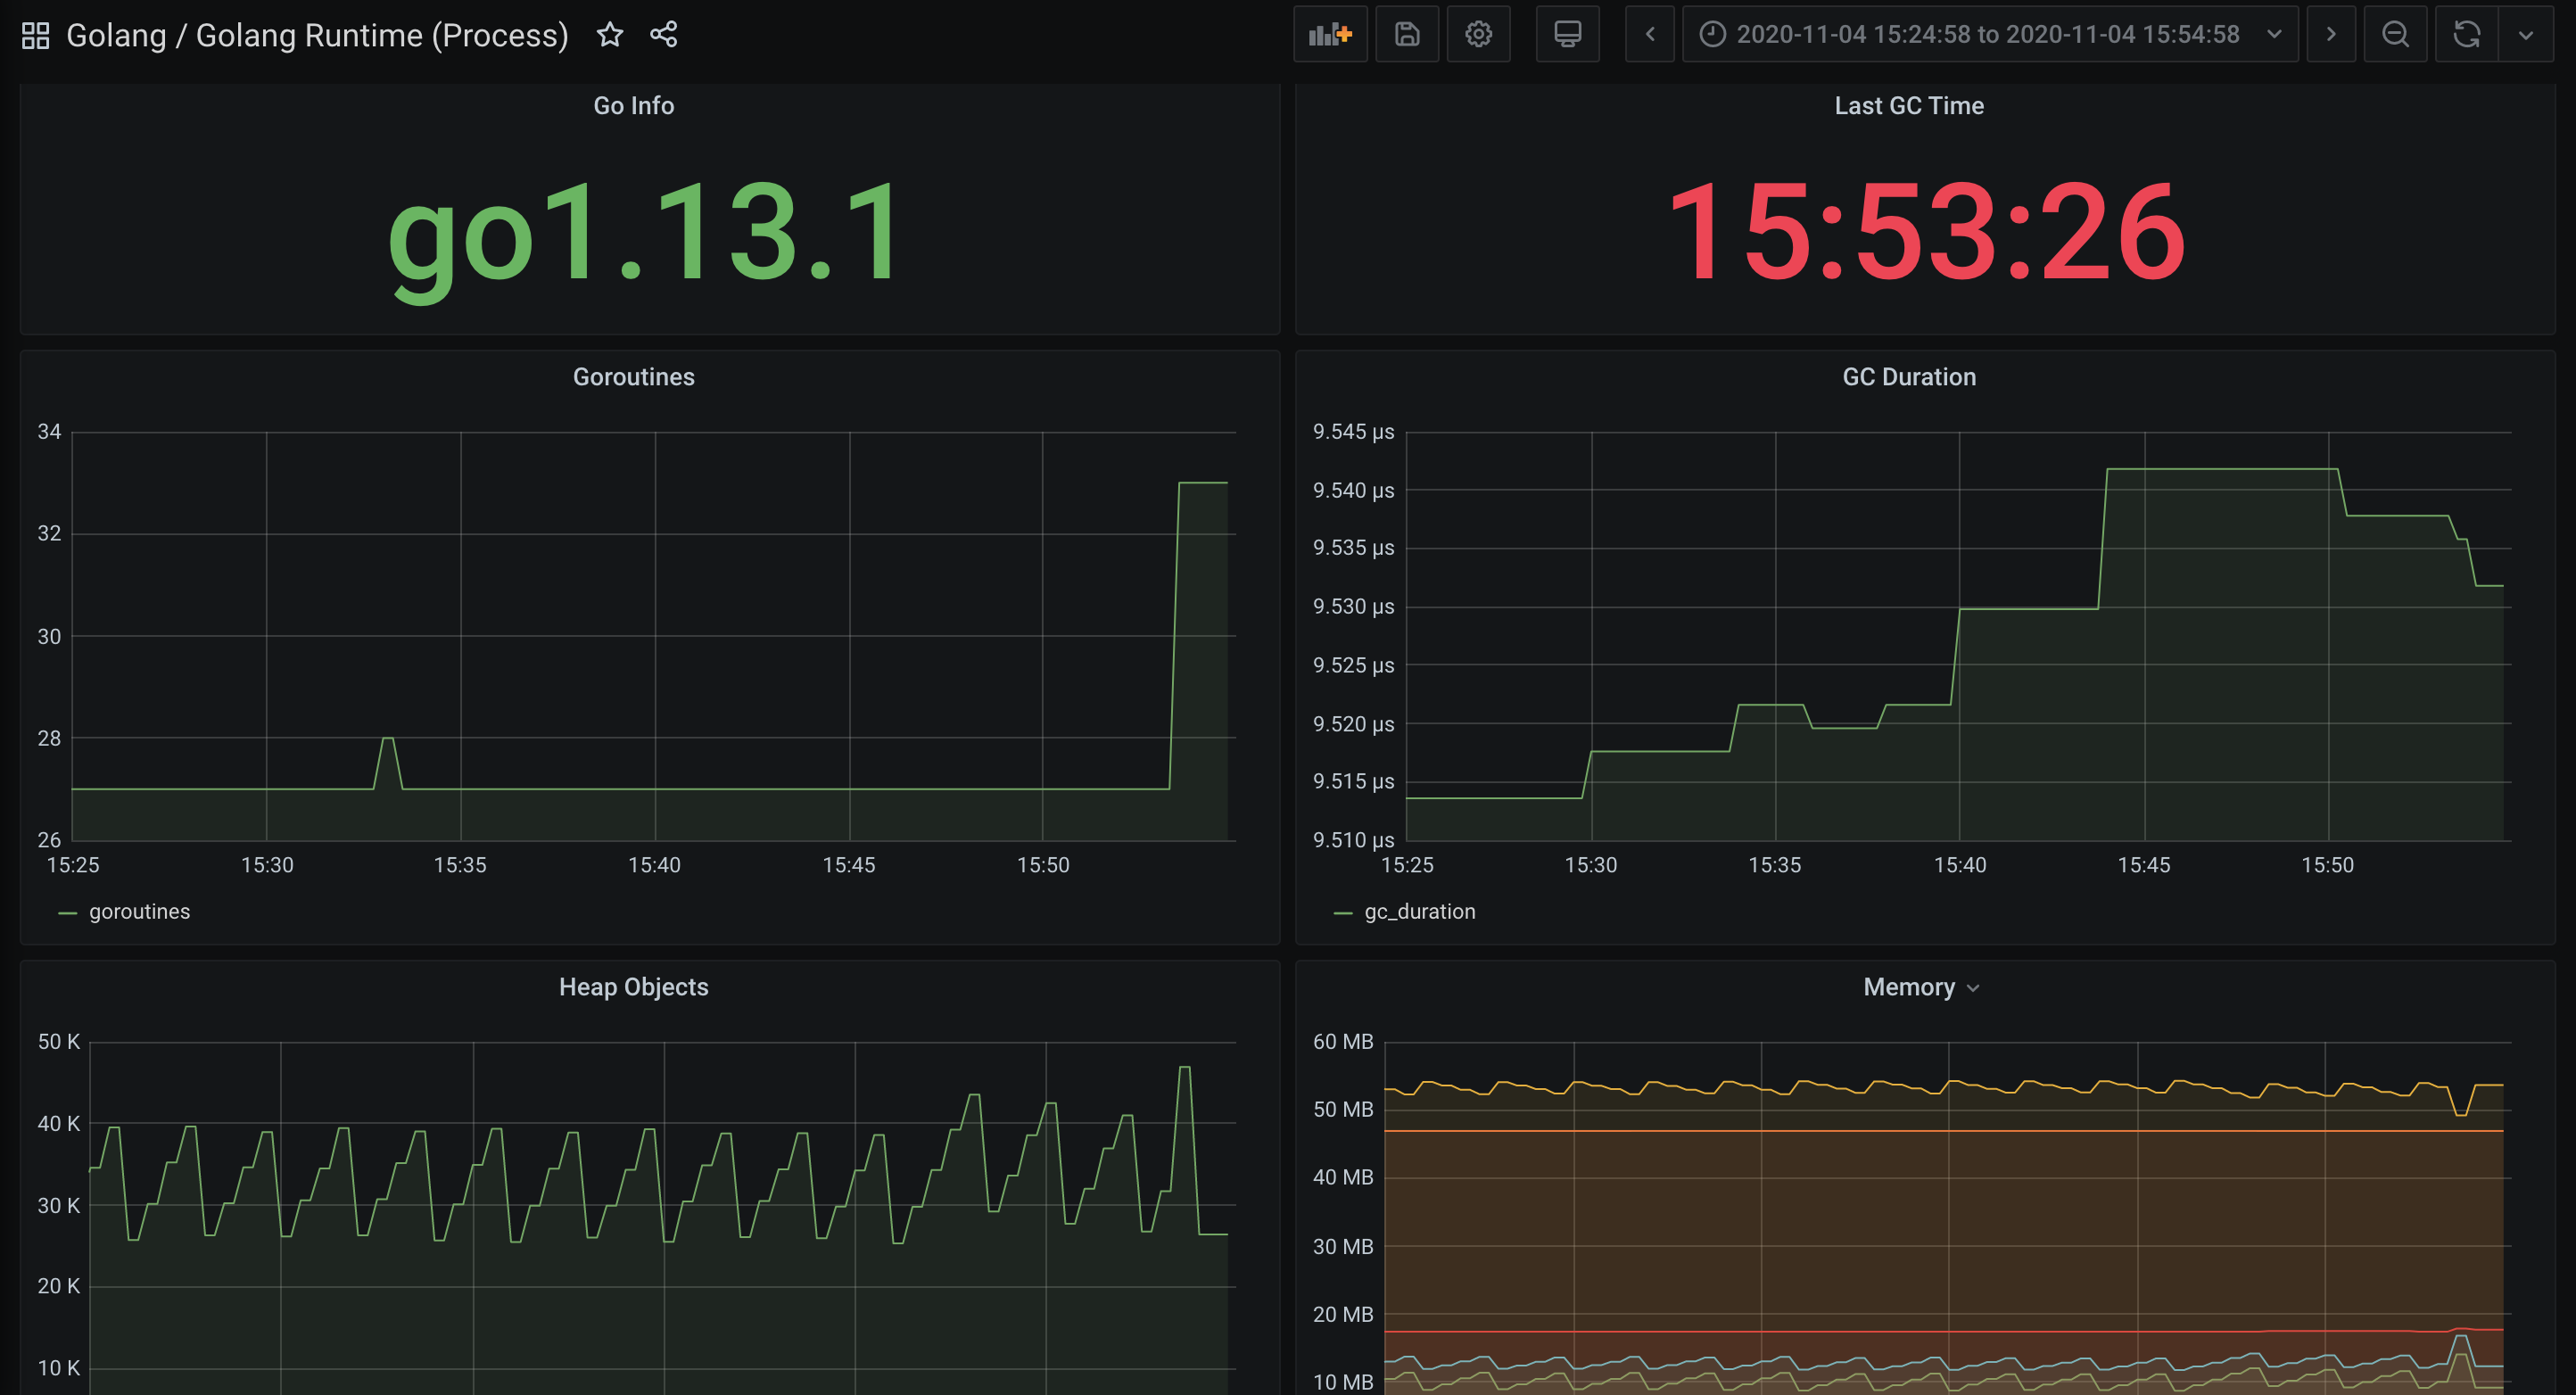
2. Enter Grafana, click the
icon to expand the monitoring dashboard, and click the name of the corresponding monitoring chart to view the monitoring data.
Summary
This document uses two samples to describe how to expose Go metrics to TMP and how to use the built-in visual charts to view monitoring data. This document only uses the Counter metrics. In other scenarios, you many need to use Gauge, Histogram, and Summary metrics. For more information, please see Metric Types.
For other use cases, TMP will integrate more frameworks to provide more out-of-the-box monitoring metrics, visual dashboards, and alerting templates.