tencent cloud

All product documents
Tencent Cloud Observability Platform
Prometheus Getting Started
Last updated: 2024-09-05 11:58:57
Prometheus Getting Started
Last updated: 2024-09-05 11:58:57

Feature Overview

TMP provides the highly available Prometheus service as well as the open-source visualization tool Grafana while inheriting the monitoring capabilities of the open-source Prometheus, which reduce your development and Ops costs.
Note:
If you have already created a TKE cluster, you can create a TMP instance in the TMP console and install the Prometheus monitoring plugin to monitor the cluster. In addition, TMP is integrated with Grafana and predefined dashboards for you to view performance metric data in different dimensions.

Prerequisites

Create a TKE cluster.

Step 1. Create a TMP instance

1. Log in to the TMP console.
2. Click Create to enter the purchase page and purchase an instance as needed. For more information, see Creating Instance.

Step 2. Integrate with TKE

1. In the TMP instance list, click the ID/Name of the newly created instance.
2. Go to the TMP management center and click Integrate with TKE on the left sidebar.
3. Perform the following operations on the cluster monitoring page.
Associate a cluster: Associate a cluster with a TMP instance as instructed in Associating with Cluster.
Configure data collection: Configure a data collection rule to monitor your business data by adding the configuration in the console or via a YAML file.
Streamline basic monitoring metrics: Select only the required metrics to avoid unnecessary fees as instructed in Streamlining Monitoring Metrics.

Step 3. Integrating a service

To facilitate access, TMP integrates commonly used development languages, middleware, and big data. You only need to follow the instructions to monitor the corresponding components. It also provides out-of-the-box Grafana monitoring dashboards.


Step 4. View monitoring data in Grafana

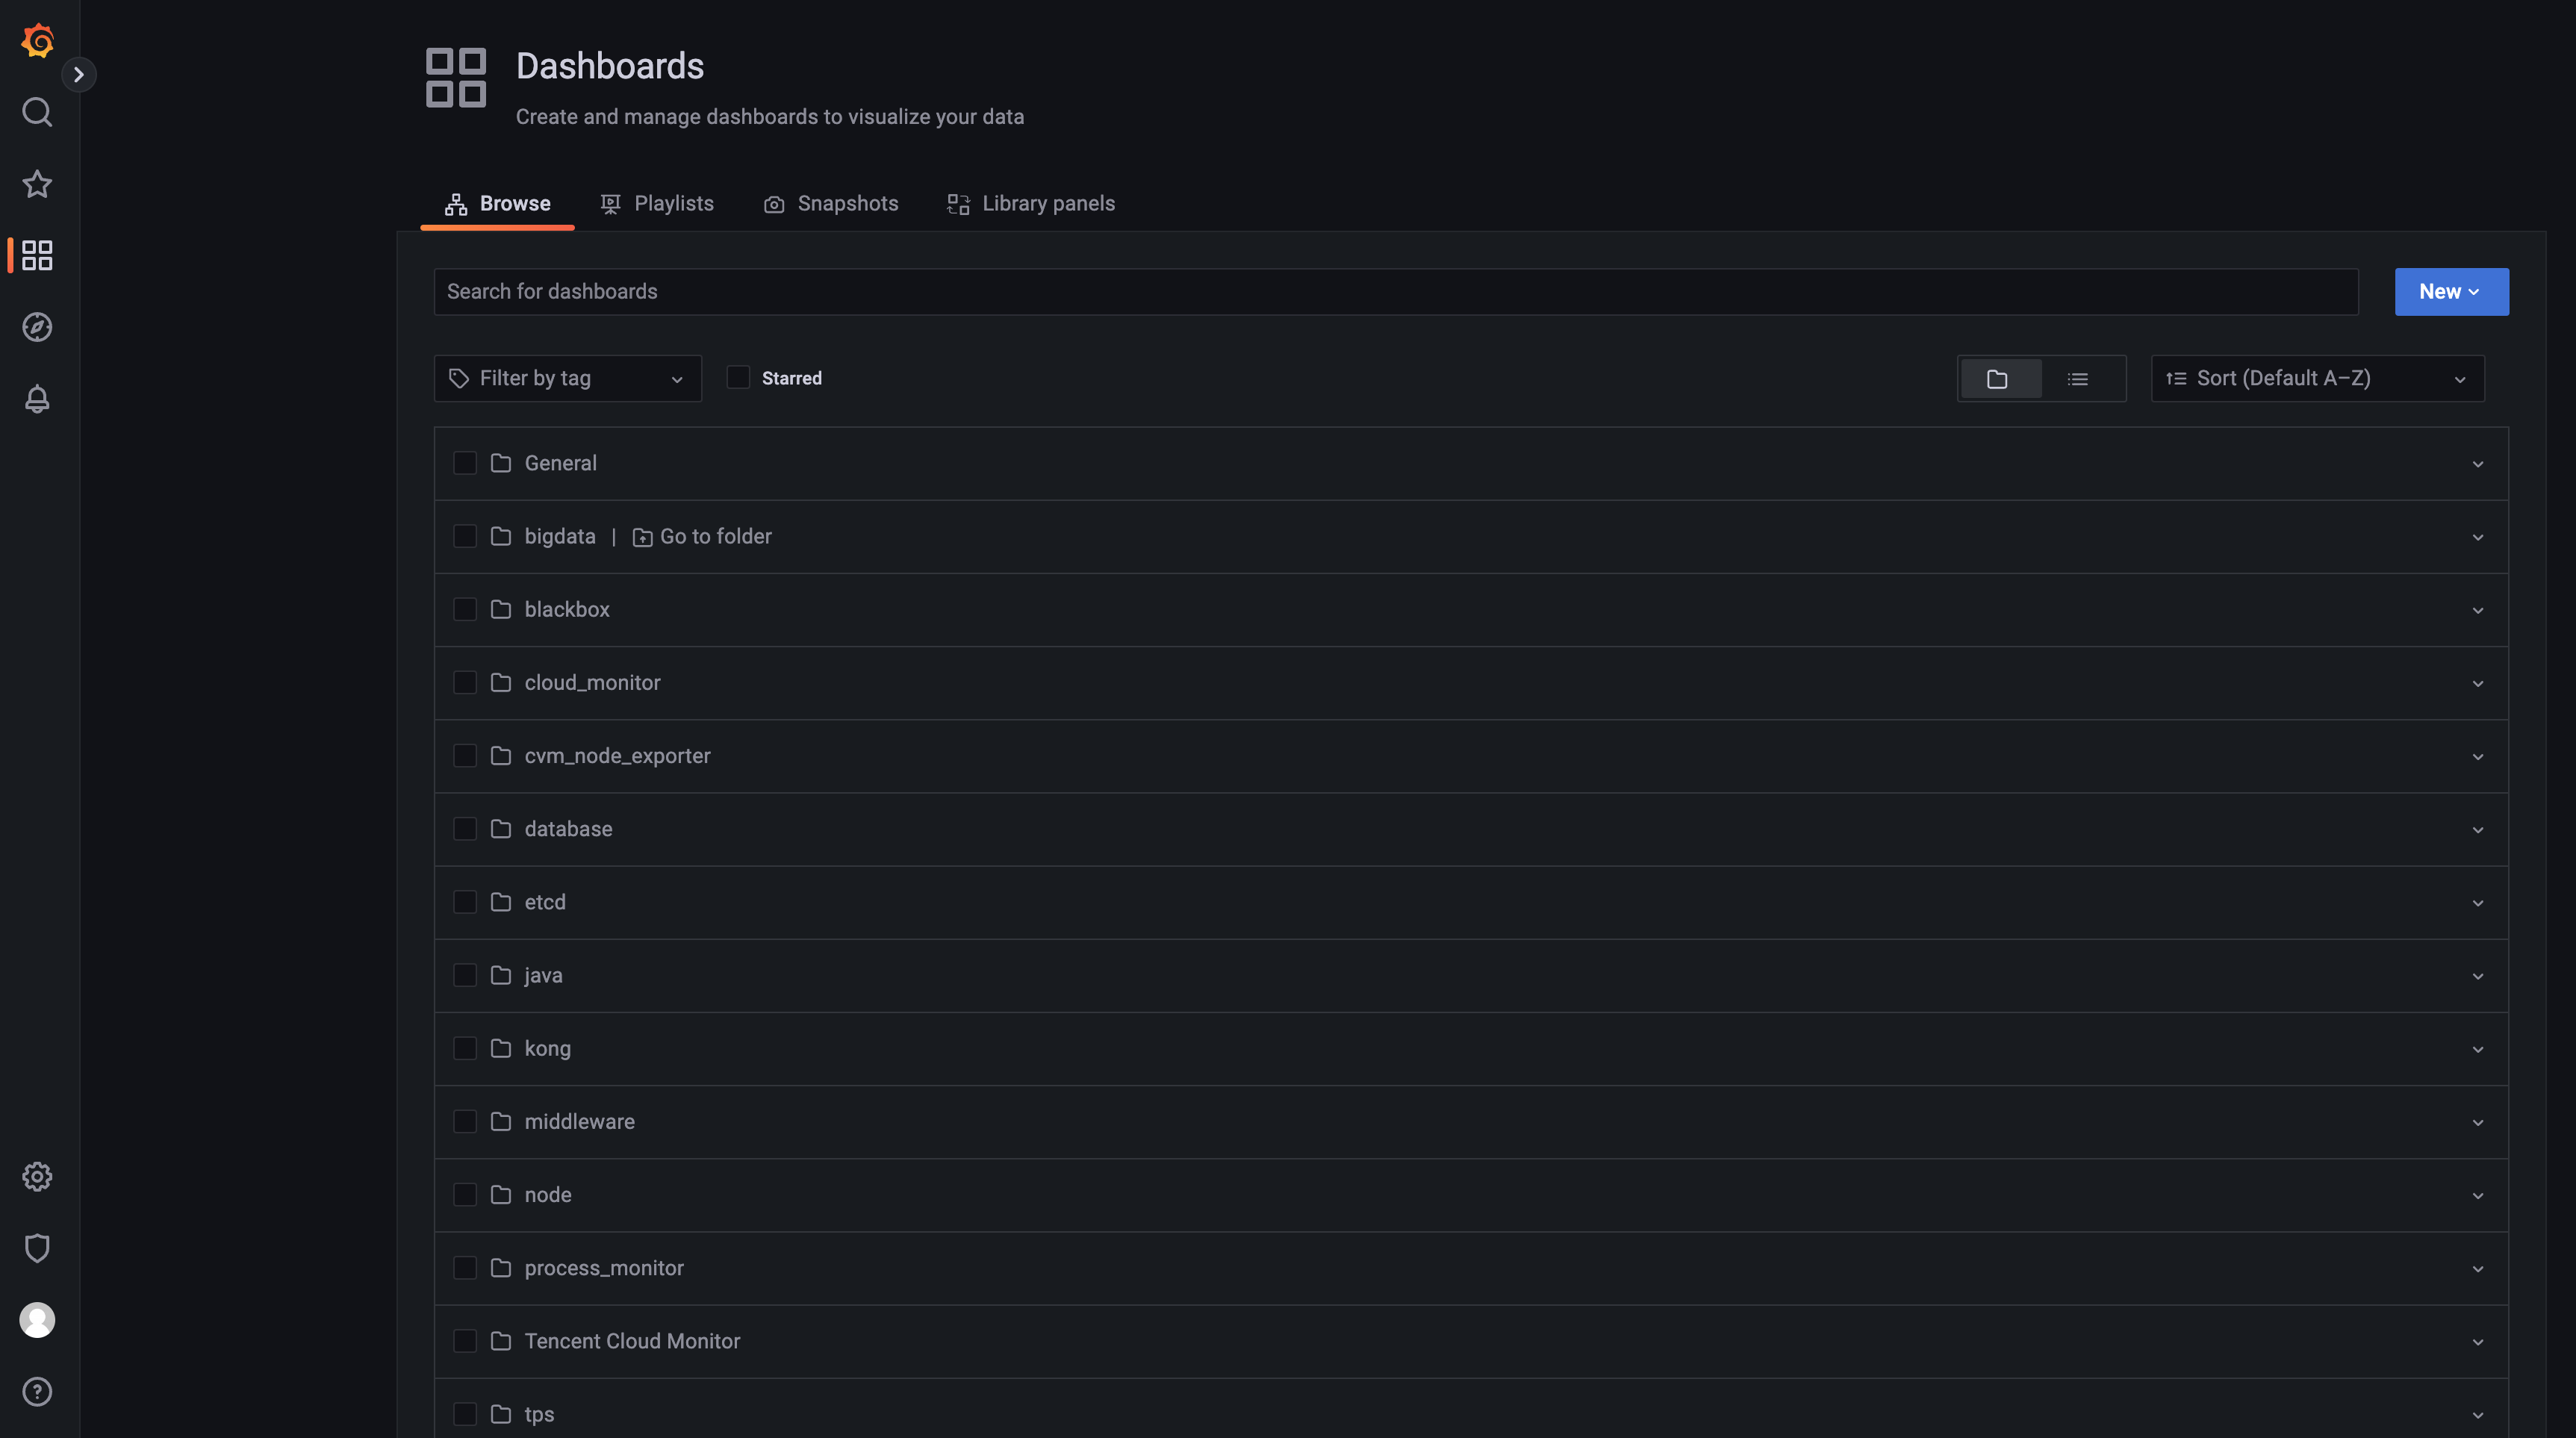
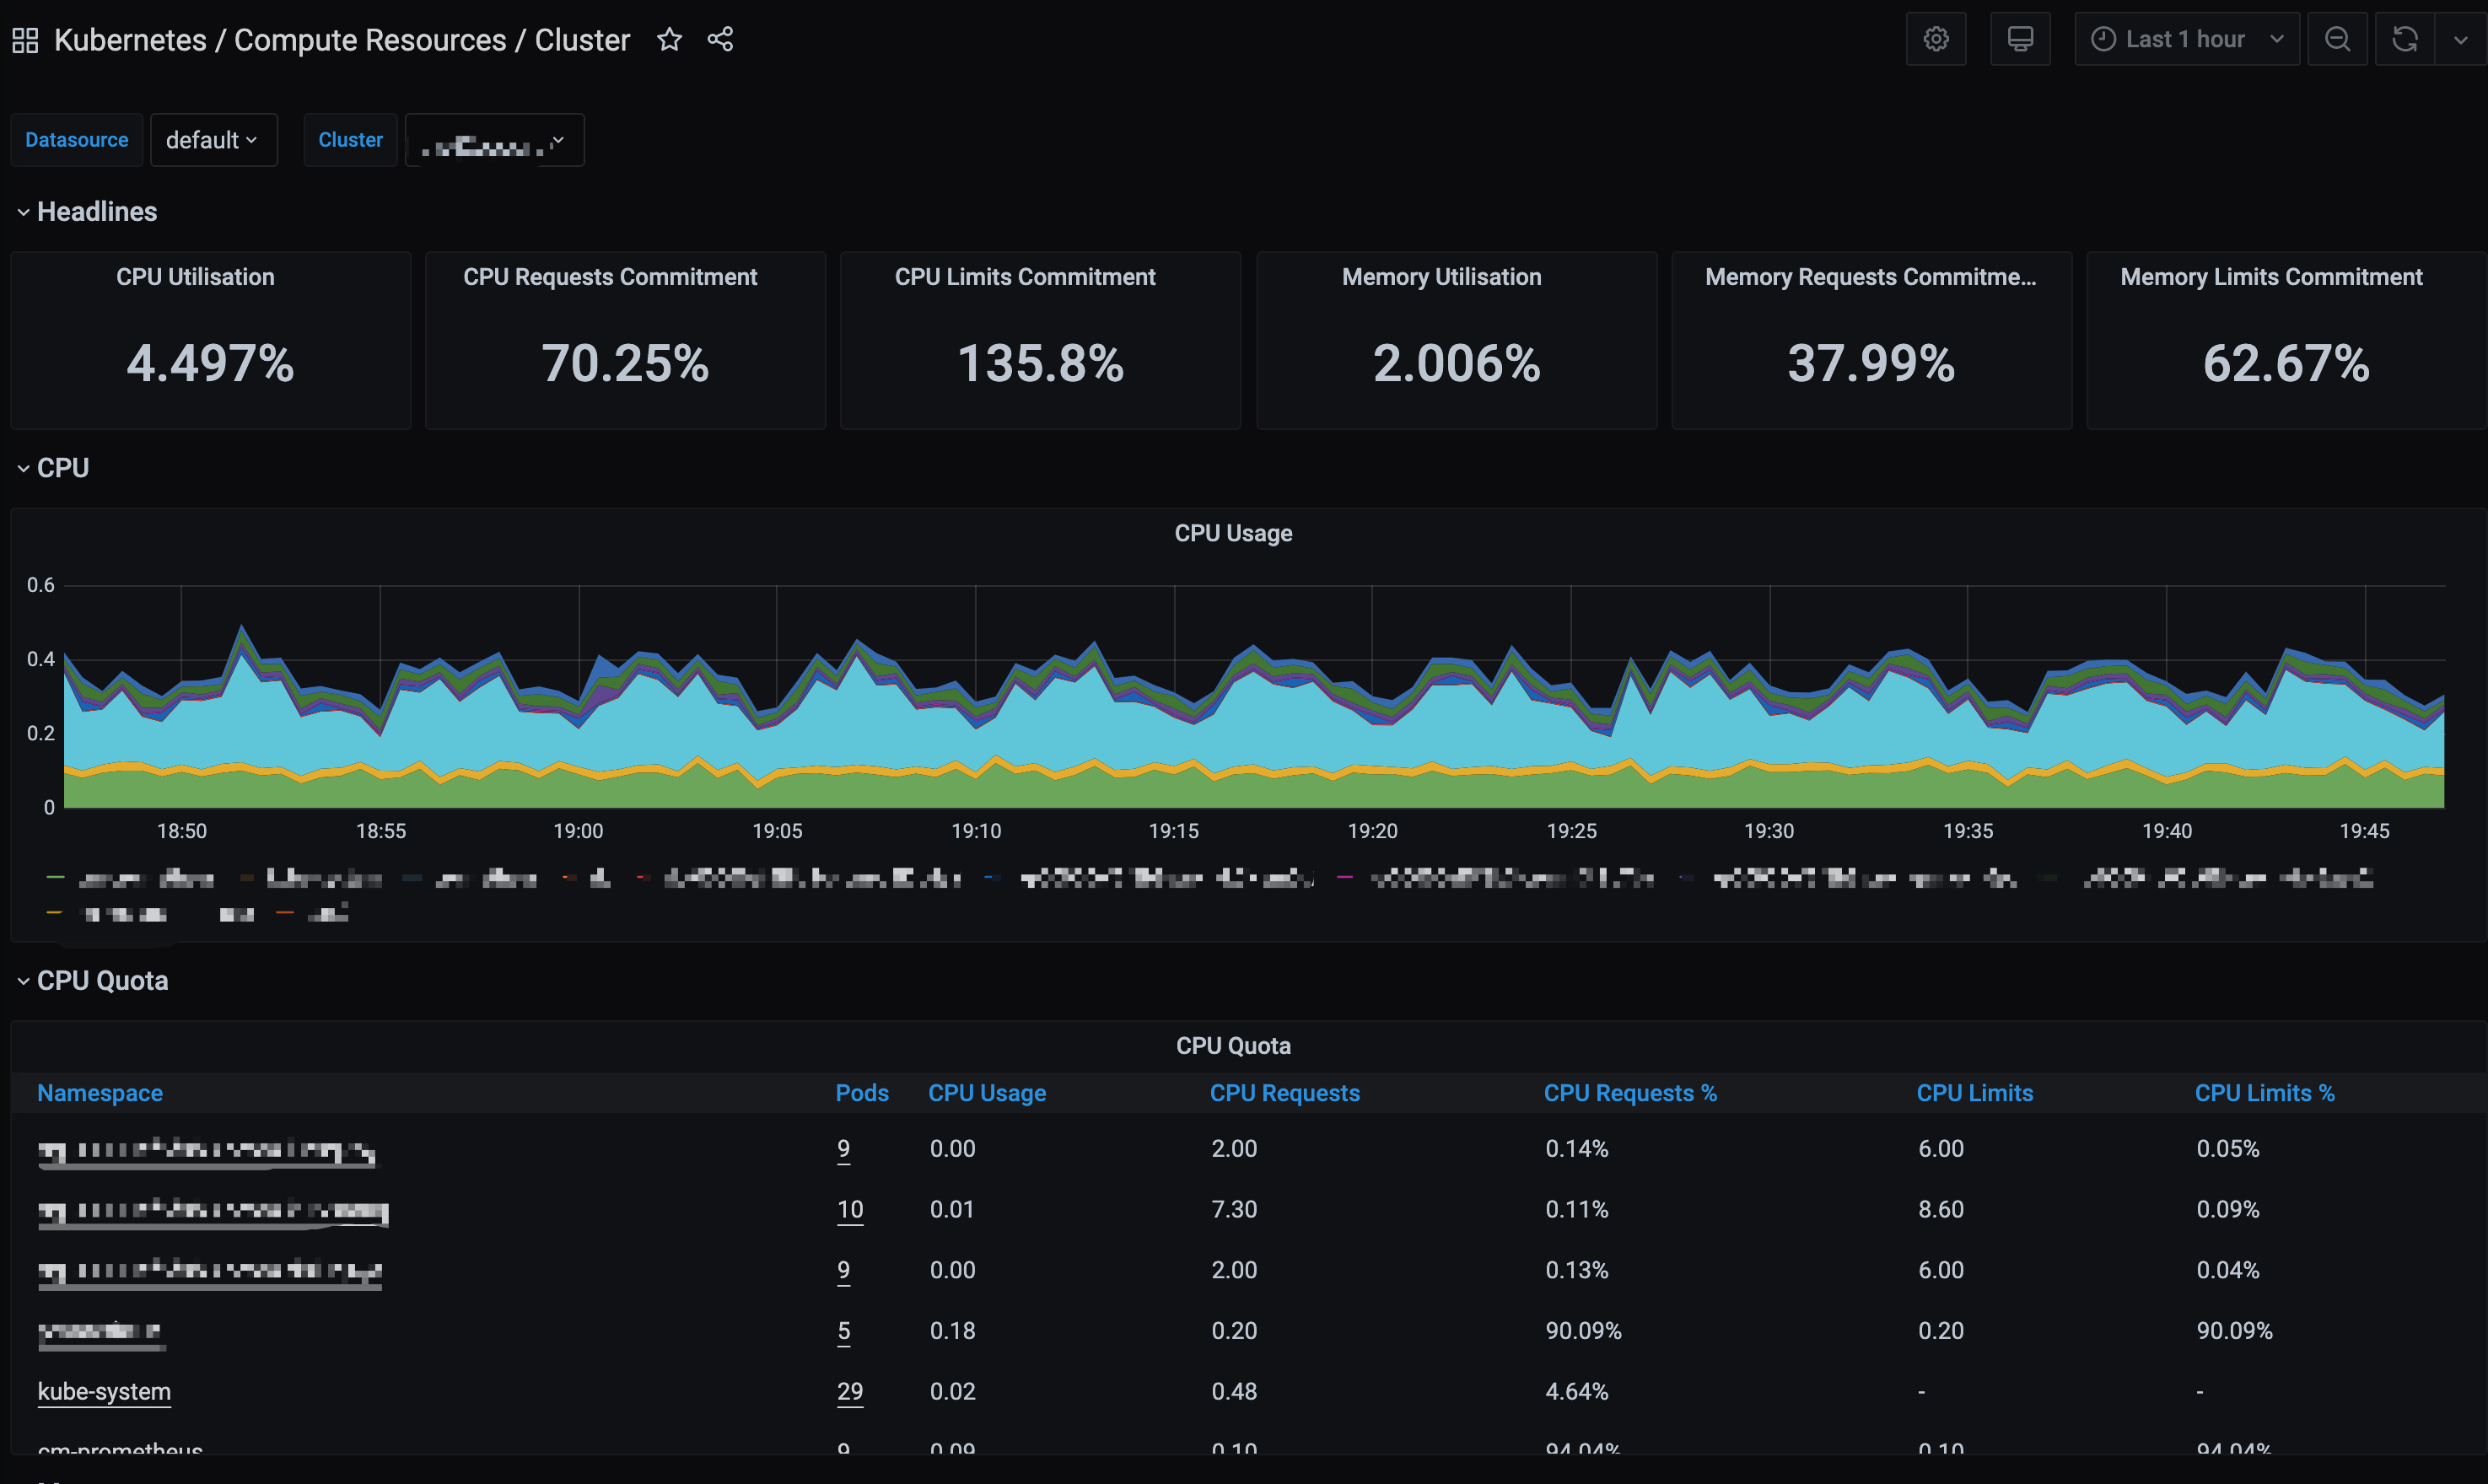
TMP offers the out-of-the-box Grafana service. It also integrates a wealth of dashboards for Kubernetes basic monitoring and common service monitoring, which can be quickly used.
1. In the TMP instance list, find the corresponding TMP instance, click

on the right of the instance ID to open your Grafana page, and enter your account and password to access the Grafana visual dashboard operation section.
2. Enter Grafana and click

to expand the monitoring panel.


3. Click the name of the corresponding monitoring chart to view the monitoring data.


Note:
For more information on how to use Grafana, see Get started.
Was this page helpful?
You can also Contact Sales or Submit a Ticket for help.
Yes
No

Feedback

Contact Us

Contact our sales team or business advisors to help your business.

Technical Support

Open a ticket if you're looking for further assistance. Our Ticket is 7x24 avaliable.

7x24 Phone Support
Hong Kong, China
+852 800 906 020 (Toll Free)
United States
+1 844 606 0804 (Toll Free)
United Kingdom
+44 808 196 4551 (Toll Free)
Canada
+1 888 605 7930 (Toll Free)
Australia
+61 1300 986 386 (Toll Free)
EdgeOne hotline
+852 300 80699
More local hotlines coming soon