
EMR Metric Collection Component of Prometheus

Last updated: 2025-03-28 17:25:30
Overview
During the use of Tencent Cloud Elastic MapReduce (EMR), you may need to report EMR monitoring metrics to TencentCloud Managed Service for Prometheus (TMP). Follow the guide in this document to quickly collect EMR monitoring metrics.
Collecting EMR on CVM Instances
Prerequisites
Using the region and Virtual Private Cloud (VPC) that are the same as those of the EMR, purchase a TMP instance. For the supported regions, see the service regions supported by TMP.
Notes:
TMP collects monitoring metrics through the private network address of EMR nodes. To collect metrics across VPCs, ensure the networks are interconnected.
With networks connected, cross-account collection is supported.
Operation Steps
1. Log in to TCOP console.
2. Select Managed Service for Prometheus in the left menu bar.
3. In the TMP instance list, select the corresponding instance.
4. Go to the instance details page, and select Data Collection > Integration Center.
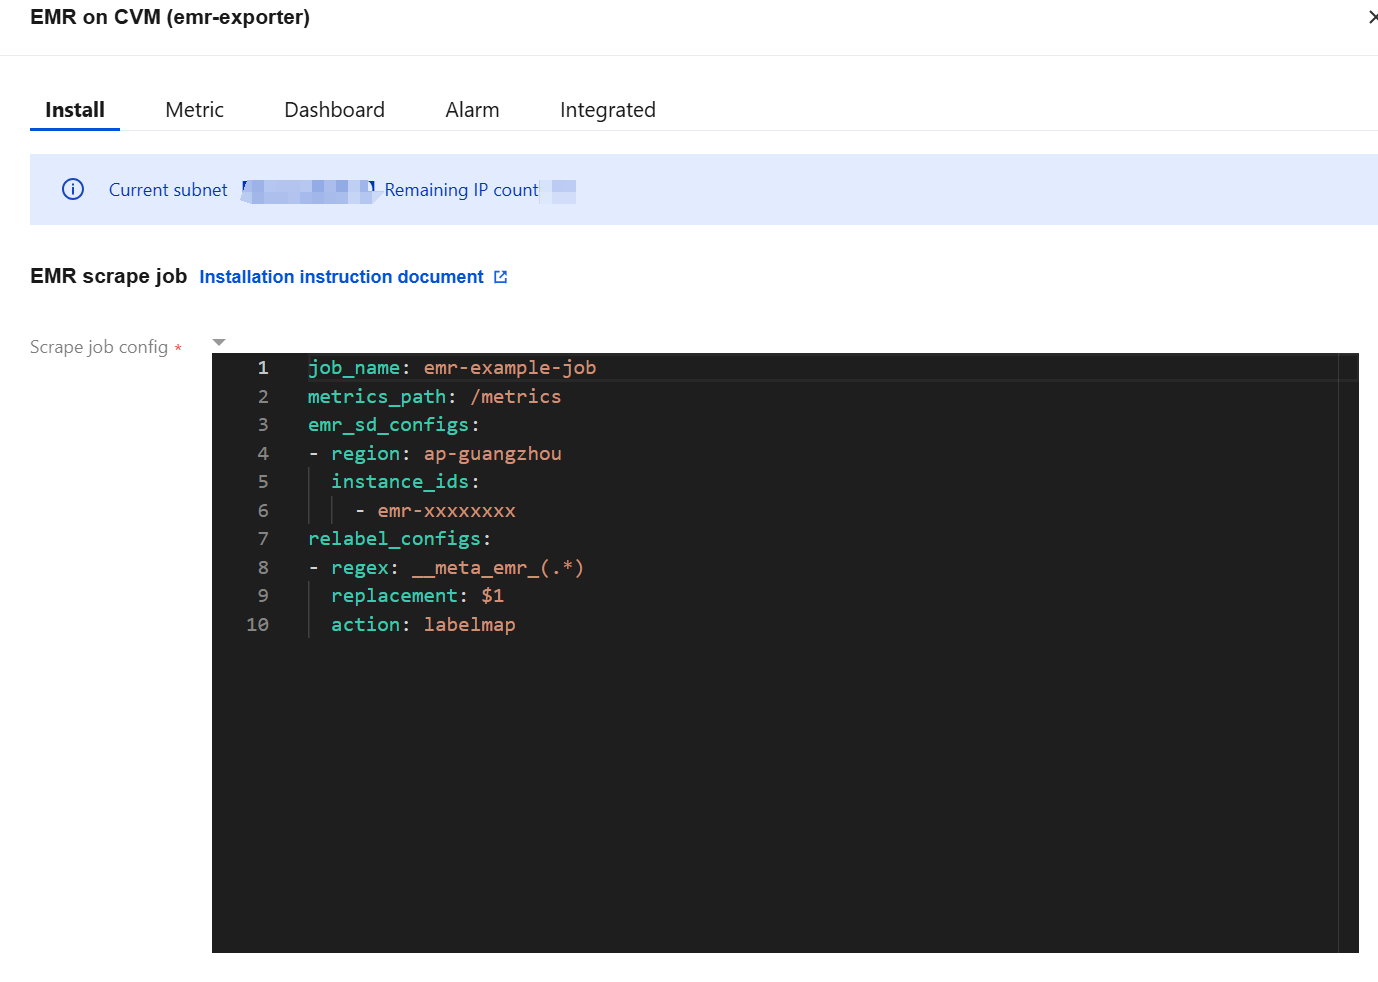
5. Find and click EMR on CVM in the Integration Center, and an installation window will pop up. Confirm the information and click Save.
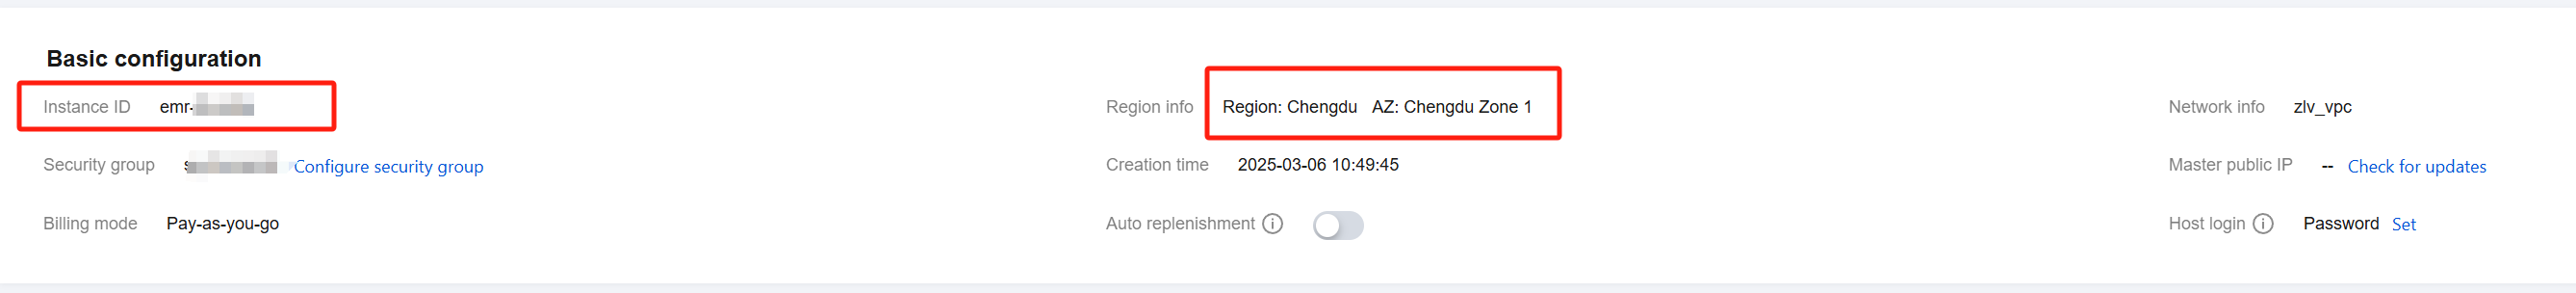
6. Enter the EMR console, click the cluster ID/name, and on the Instance Information page, obtain the region of the EMR cluster and the EMR instance ID.
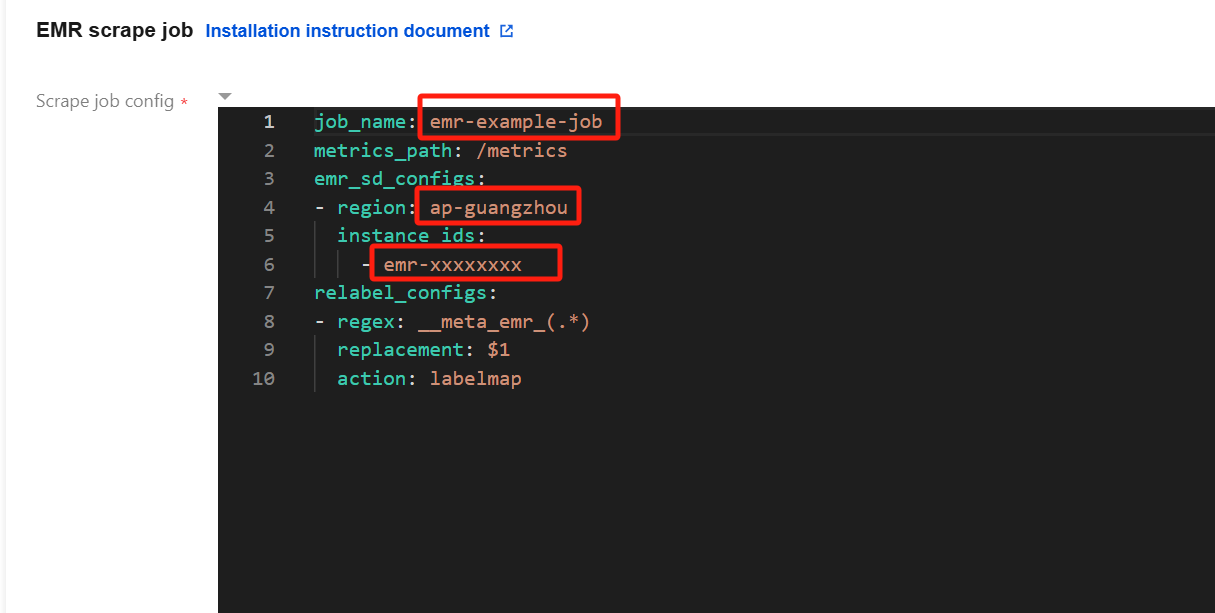
7. Fill in the task configuration (in YAML format) in EMR console. Then, fill in the task name, region where the EMR cluster is located, and EMR instance ID in the red box of the following figure.
Notes:
For the format of the region, see the region description in service regions. For example,
ap-guangzhou.Multiple instance IDs are supported.
For the relabel_configs configuration, see Capture Configuration Instructions.
Collecting EMR on TKE Instances
Prerequisites
Associate the TMP instance with the container cluster where the EMR on TKE instance is located. See Associating with a Cluster.
Operation Steps
1. Log in to the TCOP console.
2. Select Managed Service for Prometheus in the left menu bar.
3. In the TMP instance list, select the corresponding instance.
4. Go to the instance details page, and select Data Collection > Integration Center.
5. Find and click EMR on TKE in the Integration Center, and an installation window will pop up.
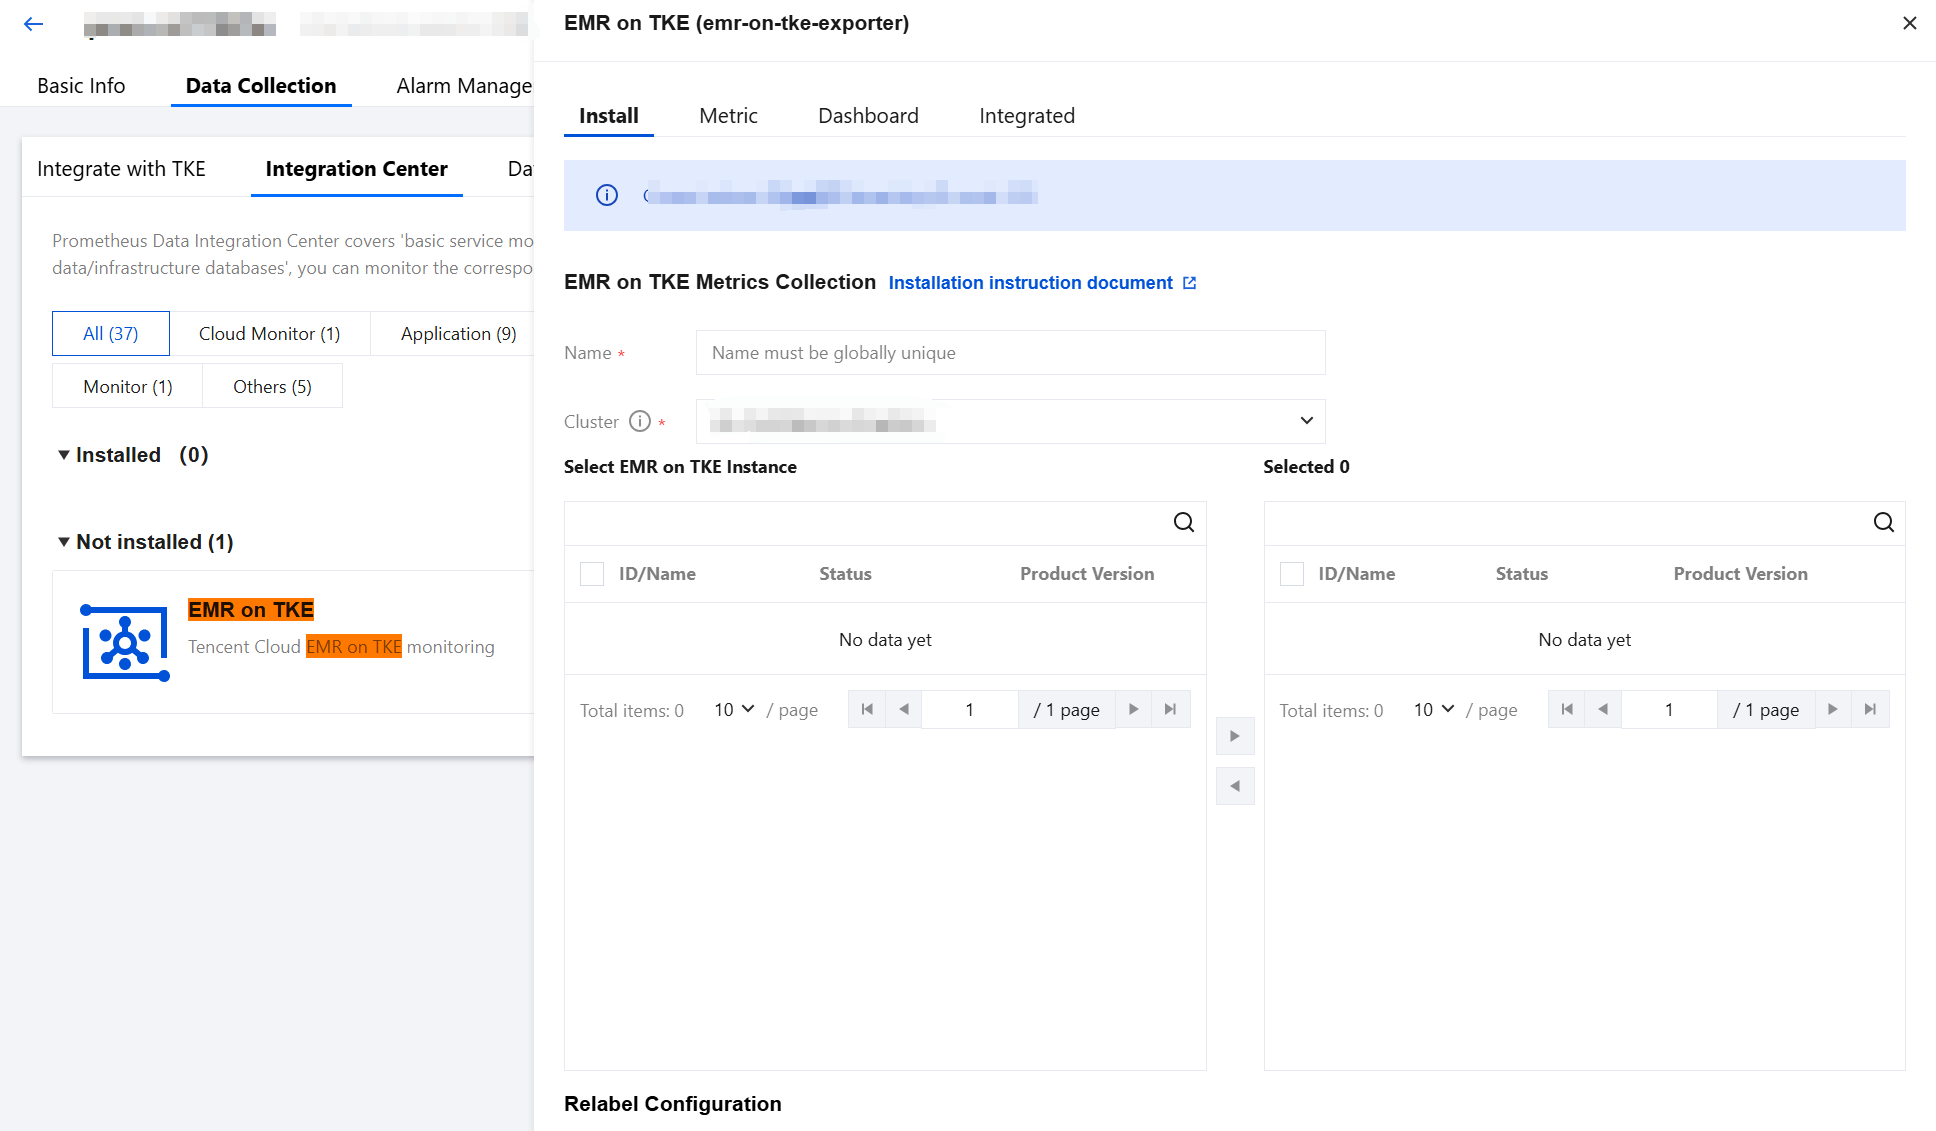
6. Select the container cluster where the EMR on TKE instance is located. The system will automatically find the EMR on TKE instances in the container cluster. Select the instances to be collected and move them to the box on the right. Click Save.
Collecting EMR Serverless Instances
Prerequisites
Using the region and Virtual Private Cloud (VPC) that are the same as those of the EMR, purchase a TMP instance. For the supported regions, see the service regions supported by TMP.
Notes:
TMP collects monitoring metrics through the private network address of EMR nodes. Establishing network connectivity is required for cross-VPC collection.
With networks connected, across-account collection is supported.
Operation Steps
1. Log in to the TCOP console.
2. Select Managed Service for Prometheus in the left menu bar.
3. In the TMP instance list, select the corresponding instance.
4. Go to the instance details page, and select Data Collection > Integration Center.
5. Find and click EMR Serverless in the Integration Center, and an installation window will pop up. After confirming the information, click Save.
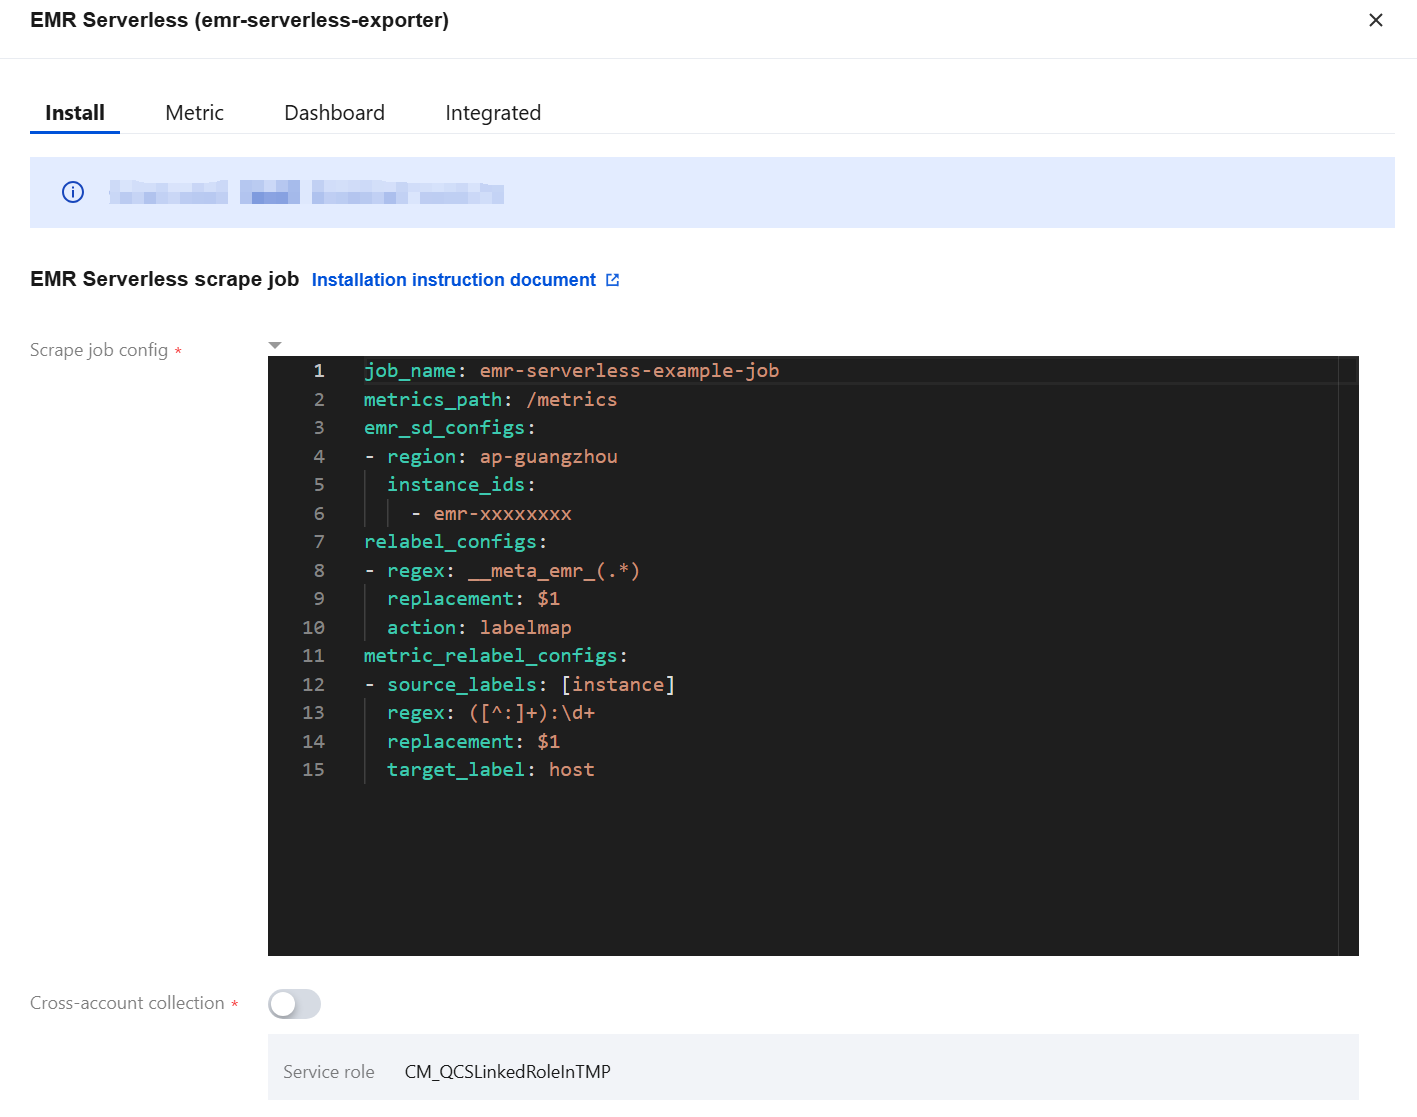
6. Enter the EMR console, click the Cluster ID/Name, and on the Instance Information page, obtain the region of the EMR cluster and the EMR Instance ID.

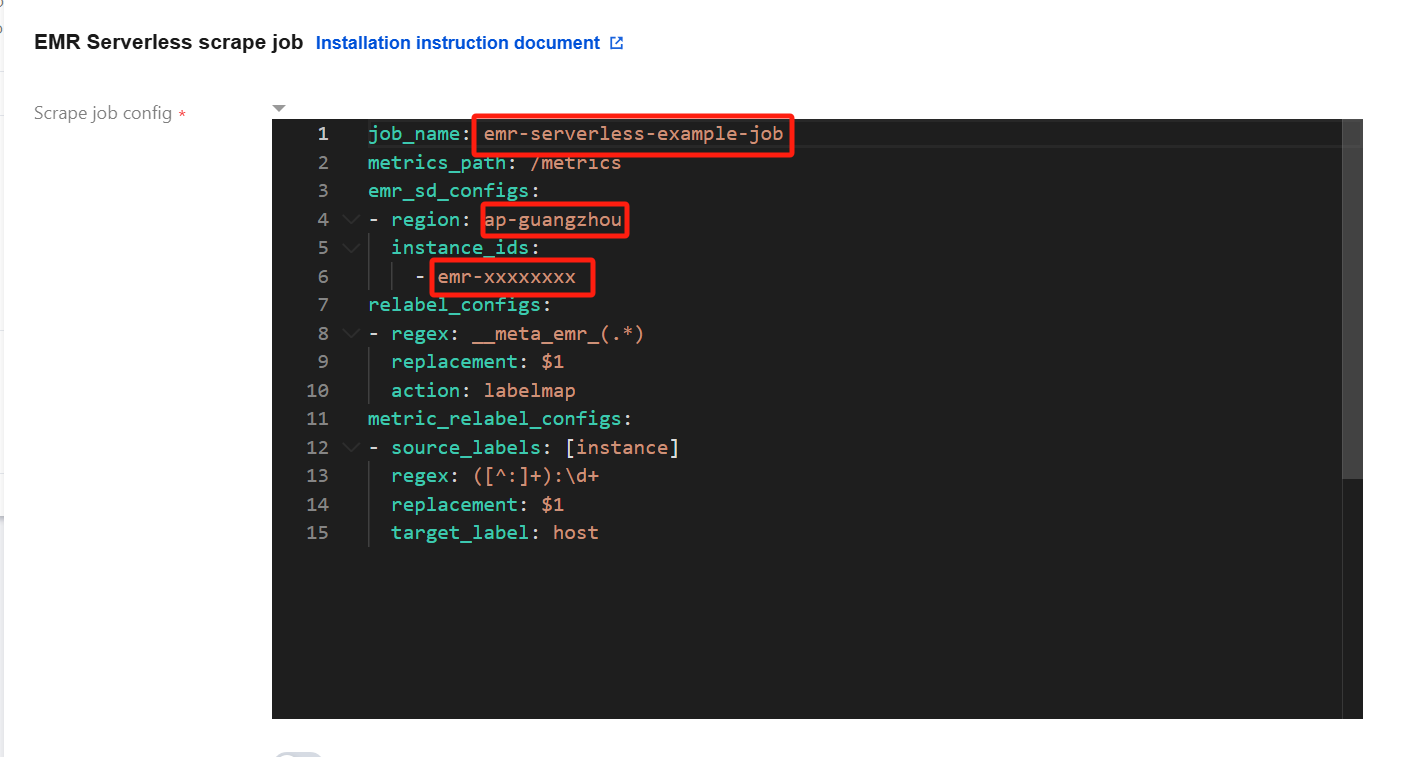
7. Fill in the task configuration (Yaml format). In the red box of the following figure, fill in the task name, region where the EMR cluster is located, and EMR Instance ID in order.
Notes:
For the format of the region, see the region description in service regions. For example,
ap-guangzhou.Multiple instance IDs are supported.
For the relabel_configs configuration, see Capture Configuration Instructions.
Supported Metrics
How to Correctly Tell Service Anomaly?
The service_status metric of EMR on CVM displays 0 when service is abnormal or the user manually stops the service. You cannot distinguish service anomaly, because EMR cannot directly provide metrics of service anomaly. You can only judge whether the user has manually stopped the service. TMP adds the emr_additional_service_status metric according to the information of whether the service is manually stopped. Together with the service_status metric, you can tell whether it is service anomaly. The value 0 indicates service anomaly.
(service_status{} * on(instance_id, host, type) group_left() (emr_additional_service_status{} == 1))For the EMR on TKE instances and EMR Serverless instances, they do not have the above situation. You can use the service_status metric to tell whether it is service anomaly. The value 0 indicates service anomaly.
Was this page helpful?
You can also Contact Sales or Submit a Ticket for help.
Yes
No
Feedback