This feature provides WebView metric analysis based on page loading time, slow loading proportion, and JavaScript error rate. It allows you to drill down into WebView and JavaScript errors through the issue list.
2. In the left navigation bar, select WebView. Select the business system, app, and time range to analyze WebView issues.
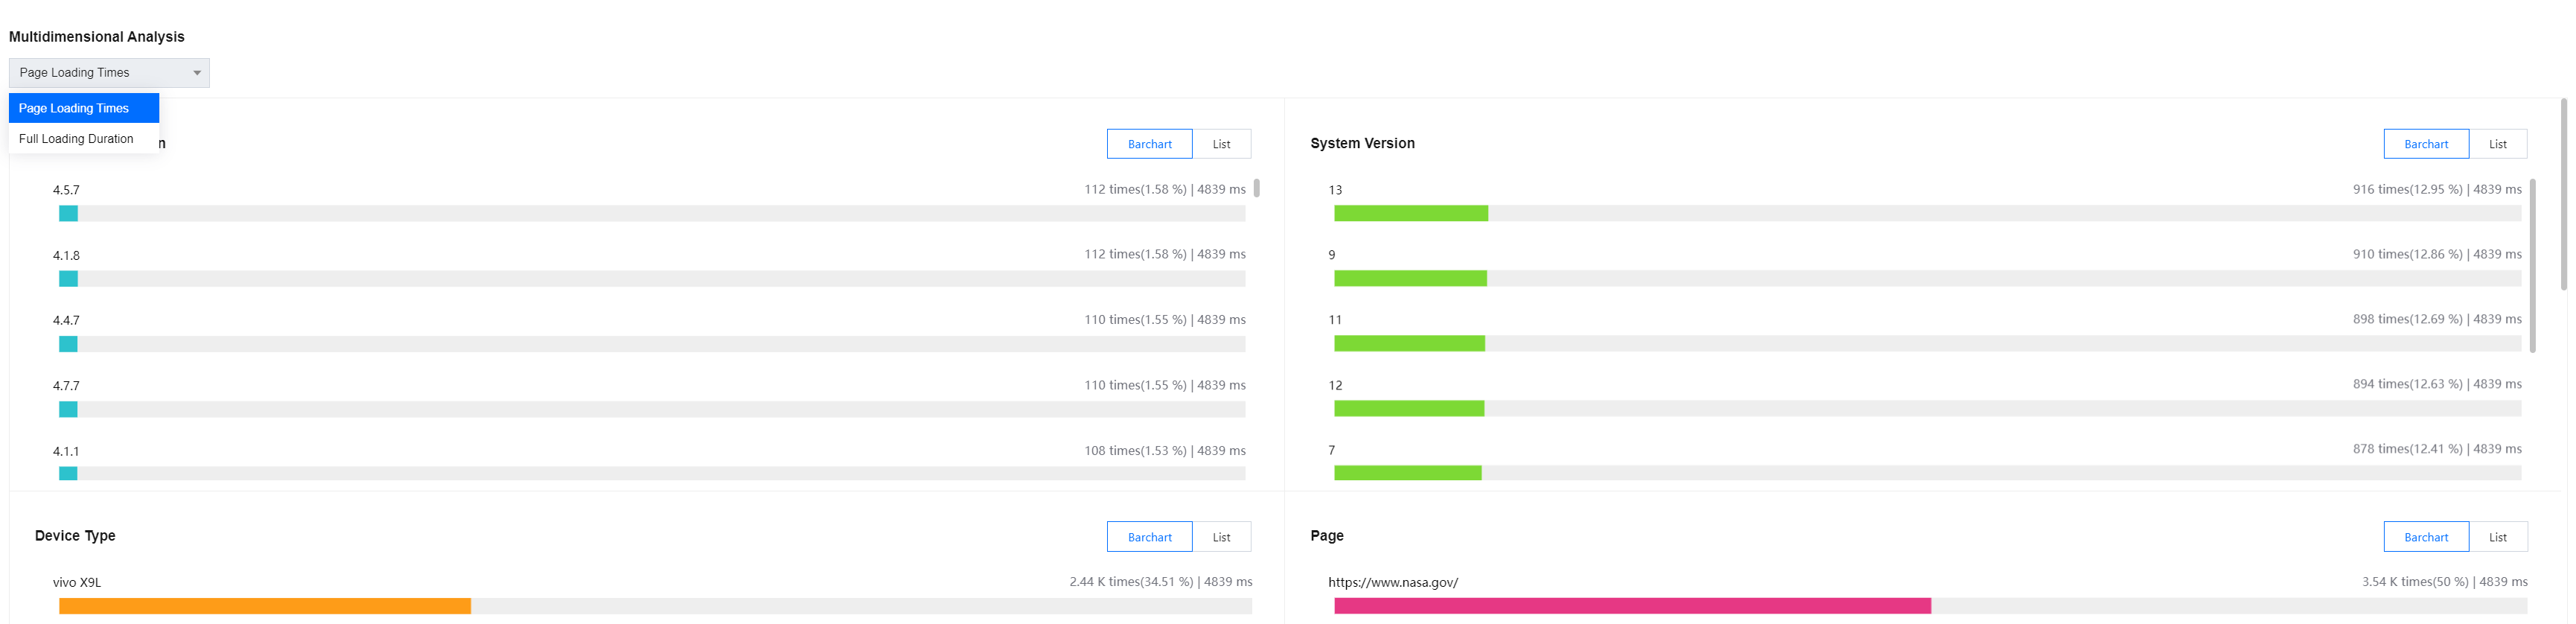
Slow loading and JavaScript Error Multidimensional Analysis
The multidimensional analysis page shows the analysis of key metrics from multiple dimensions such as app version, system version, device type, page, network type, internet service provider, and region. It facilitates targeted root cause analysis of specific slow loading issues or JavaScript errors.
Slow Loading Issues List
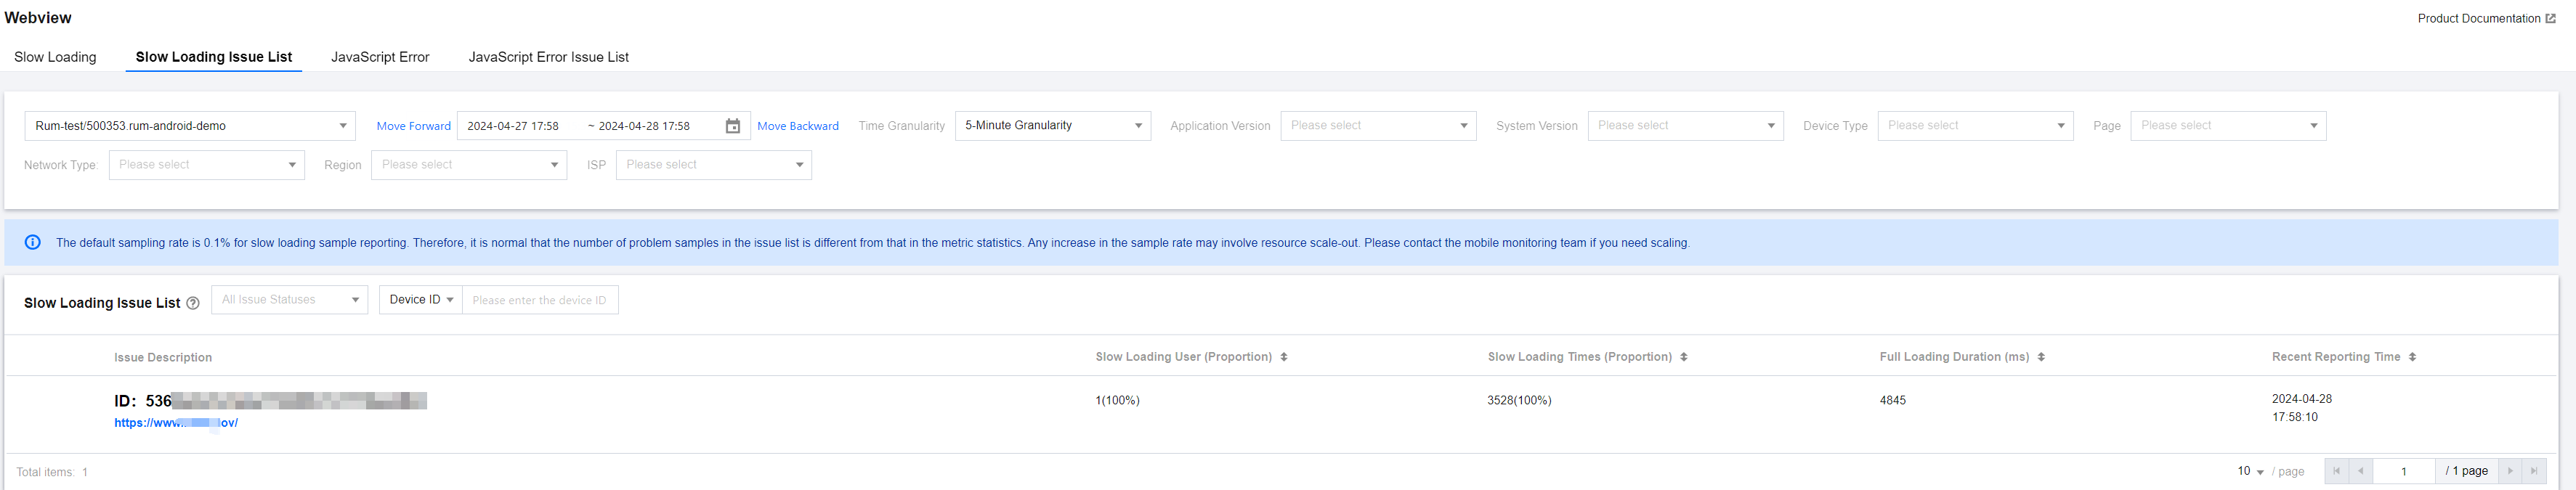
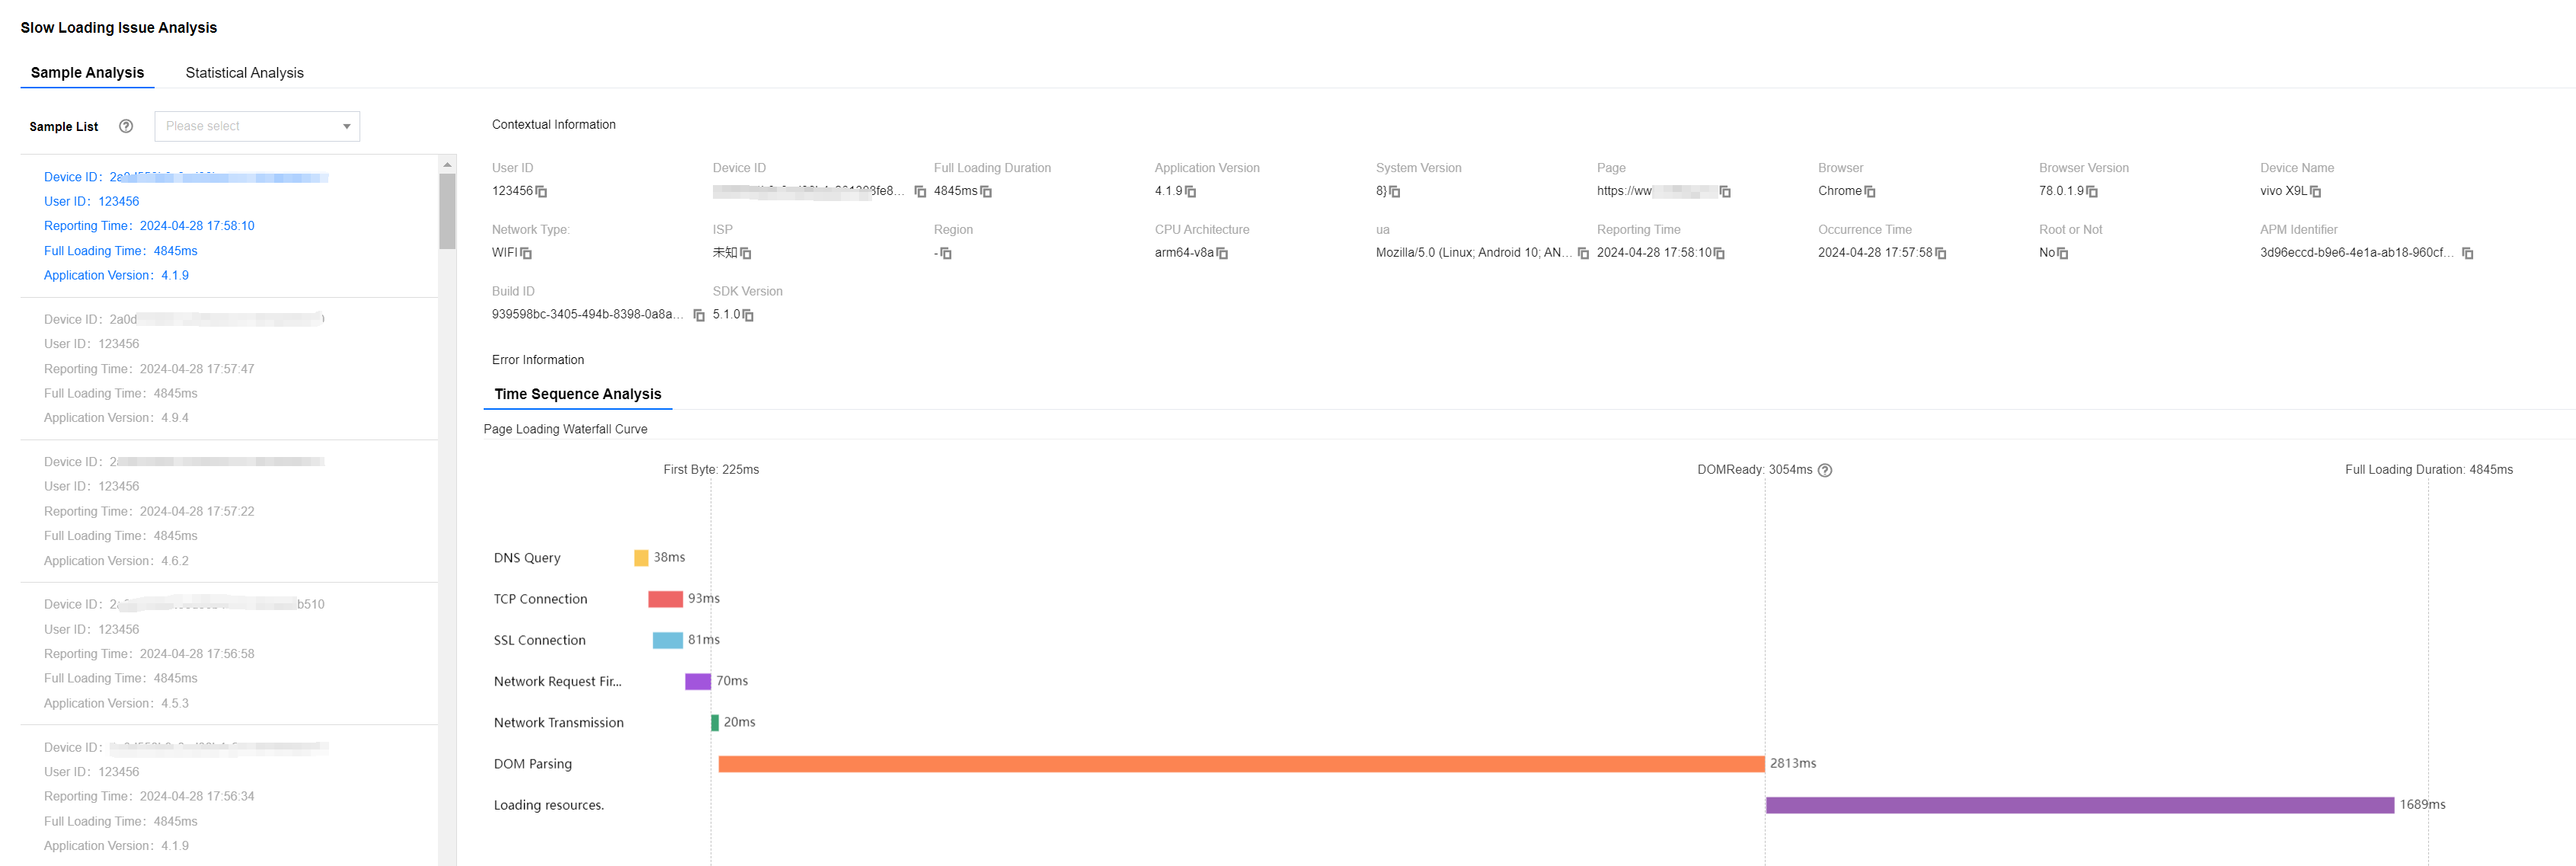
The slow loading issue list shows slow loading issues of all devices. You can quickly filter slow-loading devices by error type and device ID. You can also click Issue Description to view the details of slow loading and pinpoint and analyze the root causes of slow loading for your app.
Note:
The default sampling rate for slow loading sample reporting is 0.1%, so it is normal for the number of issue samples in the issue list to not match the metric statistics.
For each page loading sample, a full loading time greater than 3,500 ms is considered slow loading, and slow loading samples will be displayed in the issue list.
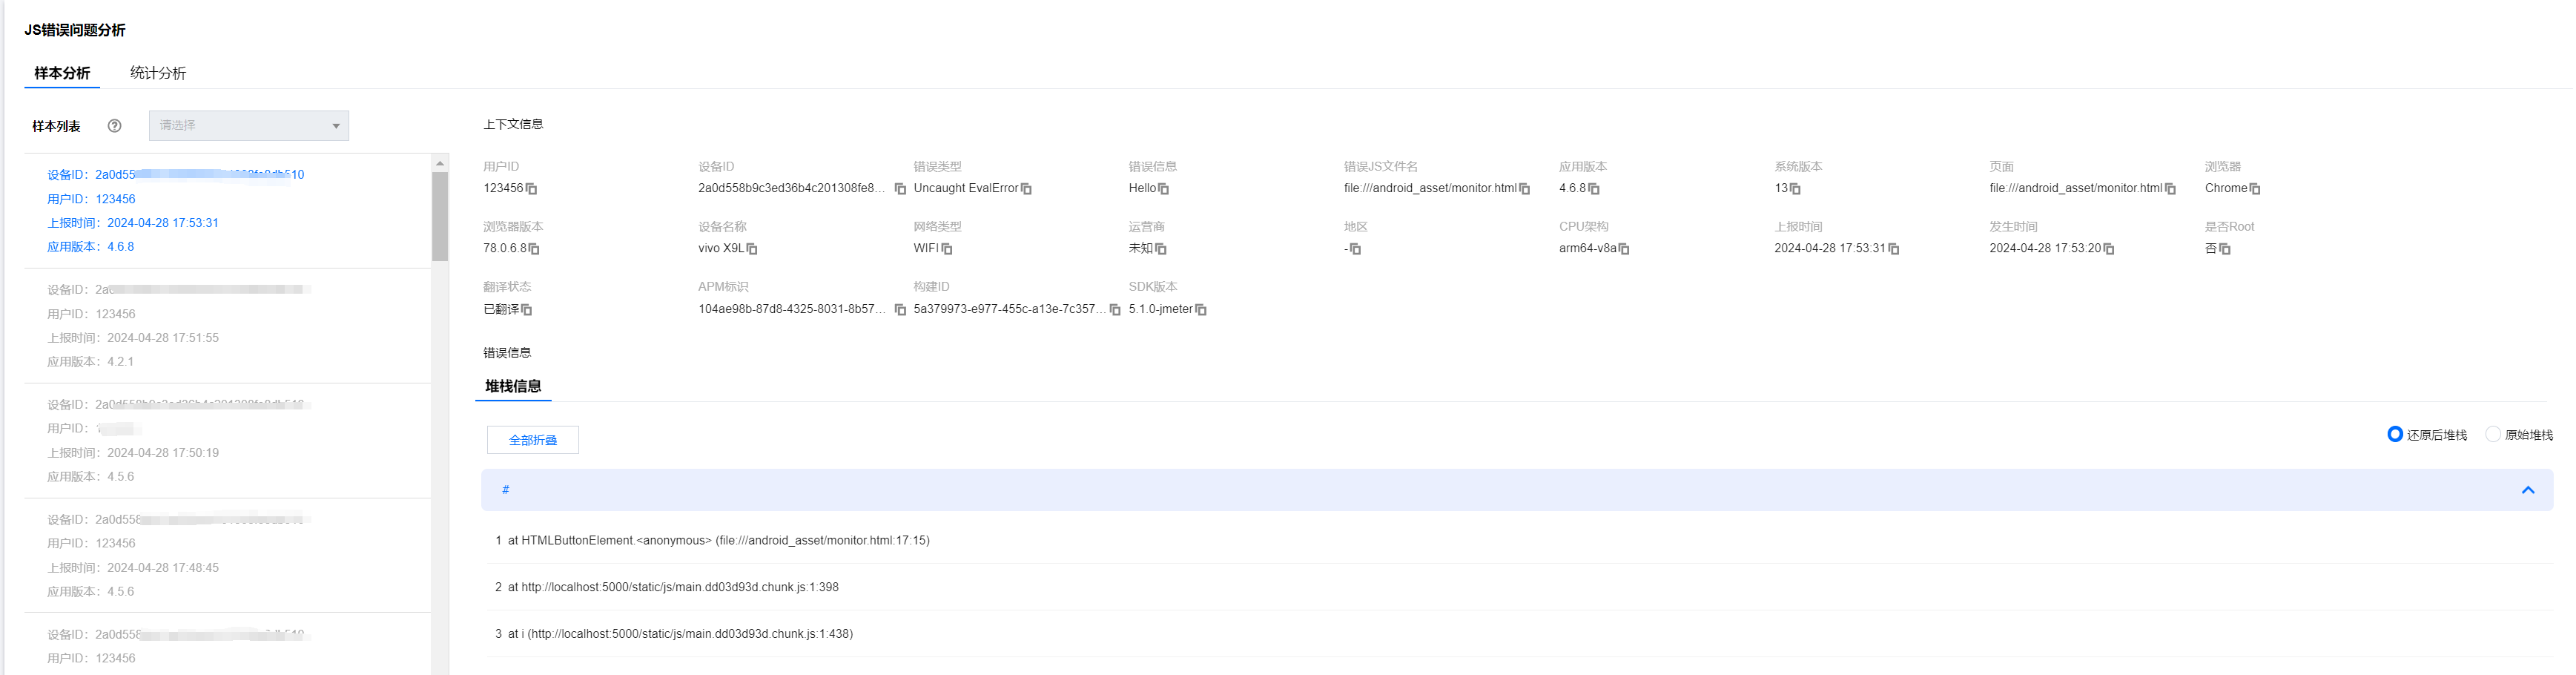
JavaScript Error Issues List
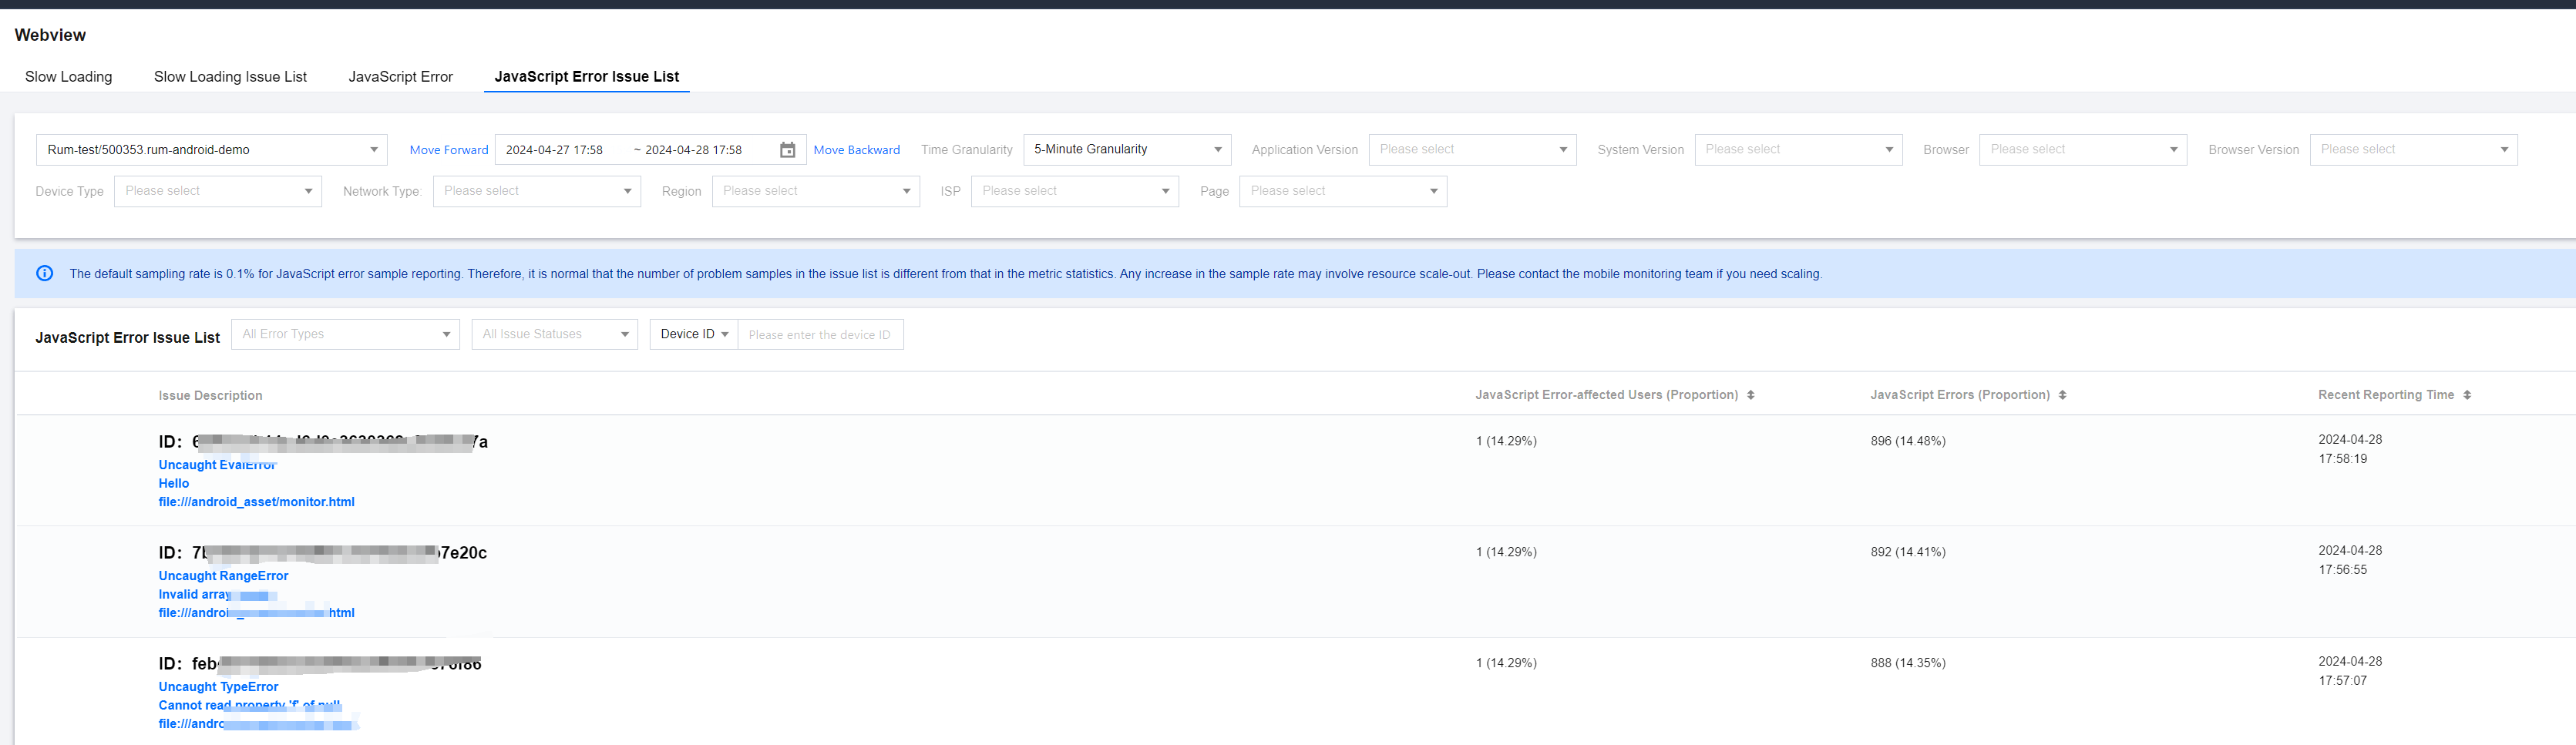
You can view all JavaScript errors in the JavaScript error Issues list.
Note:
The default sampling rate for JavaScript error reporting is 0.1%, so it is normal for the number of issue samples in the issue list to not match the metric statistics.
You can also click Issue Description to view details of JavaScript errors and pinpoint and analyze the causes of JavaScript errors.
Metrics Description
Related Metrics are as follows:
Metric Name
Metrics Description
Page Loading Times
Number of times a page is opened or refreshed
Full Loading Duration
Time taken for the entire web page to be fully loaded
JavaScript Errors
Total number of JavaScript errors within a specified time range
JavaScript Error Rate
Number of users experiencing JavaScript errors/Total number of users accessing the WebView page. Due to computational resource limitations, the numerator and denominator of this metric are not deduplicated.
JavaScript Error-affected User Proportion
Number of users affected by JavaScript errors/Total number of users within a specified time range
JavaScript Error-affected Users
Number of users affected by JavaScript errors within a specified time range