SDK Integration
Manual Integration
1. Download SDK.
2. Drag and drop the QAPM.framework file into the Xcode project (check the Copy items if needed option).
3. Go to TARGETS > Build Phases - Link Binary Libraries to add the dependent library:
libc++.dylib (libc++.tbd)
libz.dylib (libz.tbd)
libresolv.tbd
4. In the project's Other LinkerFlags, add the parameter -ObjC.
5. Import the configuration file:
For versions before 5.3.5, import the js_sdk.js file from the framework into the project root directory;
For versions 5.3.5 and later, import the QAPMResourceFile.bundle file from the framework into the project root directory.
CocoaPods Integration
In the podfile, after the following operation, execute the pod install command:
pod 'QAPM',:source => 'https://github.com/TencentCloud/QAPM-iOS-CocoaPods.git'
Note:
The minimum compatible system version for iOS SDK is iOS 8.0.
Web Environment Configurations
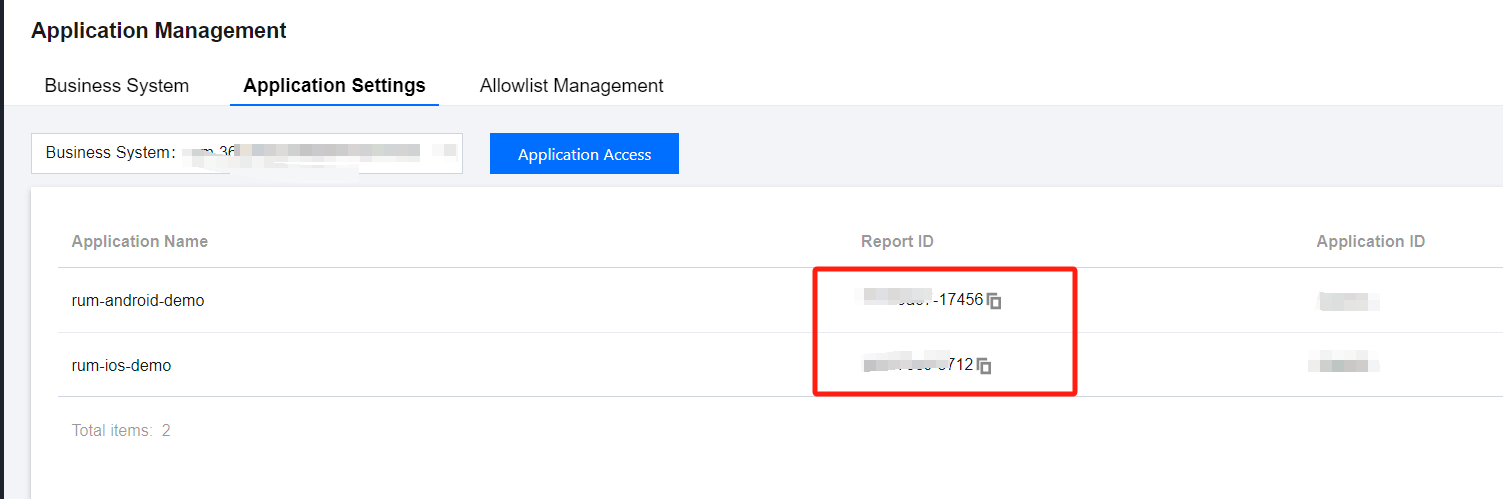
Log in to TCOP, on the Mobile App Performance Monitoring page, select Application Management > Application Settings, and enter Application Settings to obtain the Appkey (Report ID). 1. In the AppDelegate.m file of the project, import the header file: #import <QAPM/QAPM.h>. If it is a Swift project, import it in the corresponding bridging-header.h.
2. Initialize QAPM in the application:didFinishLaunchingWithOptions method of AppDelegate.m:
void loggerFunc(QAPMLoggerLevel level, const char* log) {
#ifdef RELEASE
if (level <= QAPMLogLevel_Event) {
NSLog(@"%@", [NSString stringWithUTF8String:log]);
}
#endif
#ifdef GRAY
if (level <= QAPMLogLevel_Info) {
NSLog(@"%@", [NSString stringWithUTF8String:log]);
}
#endif
#ifdef DEBUG
if (level <= QAPMLogLevel_Debug) {
NSLog(@"%@", [NSString stringWithUTF8String:log]);
}
#endif
}
- (BOOL)application:(UIApplication *)application didFinishLaunchingWithOptions:(NSDictionary *)launchOptions {
[QAPMConfig getInstance].collectOptionalFields = YES;
NSLog(@"qapm sdk version : %@", [QAPM sdkVersion]);
[QAPM registerLogCallback:loggerFunc];
[QAPMConfig getInstance].host = @"https://app.rumt-sg.com";
[QAPMConfig getInstance].customerAppVersion = @"Set app custom version number";
[QAPMConfig getInstance].userId = @"Set userId";
[QAPMConfig getInstance].deviceID = @"Custom deviceId";
[QAPM startWithAppKey:@"Unique product appKey"];
return YES;
}
Note:
During the development process, you can add the set user ID/device ID to the allowlist to ensure that the feature reporting of the specified device is not affected by sampling. It can be done in Mobile App Performance Monitoring > Application Management > Allowlist Management by clicking Allowlist Configuration > Add. Monitoring Feature Enabled
Recommended Use:
In the API of QAPMModelStableConfig.h file: - (void)setupModelAll; //This API can enable all monitoring features.
In the API of QAPMModelStableConfig.h file: - (void)setupModelStable;//This interface can enable all monitoring features except network monitoring and user behavior monitoring. According to the requirements of the Ministry of Industry and Information Technology Document No. 26, network monitoring and user behavior monitoring are classified as extended business features. You can choose whether to activate them based on your needs.
Custom Use:
To custom enabling QAPM features (including stalling, crash, native network, native user behavior, startup, and WebView), you can set a combination of enumerated values in the API of enableMonitorTypeOptions in the QAPMConfig.h file, adding multiple parameter enumeration values to activate a series of features. The code is as follows:
[QAPMConfig getInstance].enableMonitorTypeOptions =
QAPMMonitorTypeBlue |
QAPMMonitorTypeCrash |
QAPMMonitorTypeHTTPMonitor |
QAPMMonitorTypeIUPMonitor|
QAPMMonitorTypeLaunch |
QAPMMonitorTypeJSError |
QAPMMonitorTypeWebViewNetWork |
QAPMMonitorTypeWebViewIUPMonitor |
QAPMMonitorTypeWebMonitor;
API Description:
API: In the QAPMConfig.h class @property (nonatomic, assign) QAPMMonitorType enableMonitorTypeOptions;
Parameter Description: QAPMMonitorType is a feature type, with optional values as shown in the following code. Optional Item Description
:
QAPMMonitorTypeBlue
QAPMMonitorTypeCrash
QAPMMonitorTypeHTTPMonitor
QAPMMonitorTypeIUPMonitor
QAPMMonitorTypeLaunch
QAPMMonitorTypeJSError
QAPMMonitorTypeWebViewNetWork
QAPMMonitorTypeWebViewIUPMonitor
QAPMMonitorTypeWebMonitor
Note:
1. Use the OR operation to custom enabling the required monitoring features, for example, for stalling: QAPMMonitorTypeBlue.
2. In response to the Ministry of Industry and Information Technology's (MIIT) notice on further enhancing the service capabilities of mobile Internet applications, we have divided network monitoring and user behavior monitoring into
, based on the MIIT's definition of basic features for performance monitoring SDKs. To avoid collecting personal information such as network log information and user operation records, you can selectively enable these two features. At the operational level, you can prevent the entry of QAPMMonitorTypeHTTPMonitor and QAPMMonitorTypeWebViewNetWork parameters in the custom performance module configuration to disable the network monitoring feature. Similarly, you can prevent the entry of QAPMMonitorTypeIUPMonitor and QAPMMonitorTypeWebViewIUPMonitor parameters to disable the user behavior monitoring feature, or simply use the ModelStable feature activation mode to automatically enable other recommended features while all extended business features are disabled. SDK Feature Introduction
Stalling and Smoothness Monitoring
Stalling Detection Feature
QAPMMoniterType: QAPMMonitorTypeBlue Stalling detection feature collects and reports stack informaiton if the stalling duration exceeds the 200 ms threshold.
Smoothness Monitoring
To start monitoring smoothness statistics in swipe scenarios, add the following codes to the relevant pages. Logs will be reported upon the next app startup.
#pragma mark - TableView Delegate
- (void)scrollViewWillBeginDragging:(UIScrollView *)scrollView {
[QAPMBlueProfile beginTrackingWithStage:NSStringFromClass([self class])];
}
- (void)scrollViewDidEndDragging:(UIScrollView *)scrollView willDecelerate:(BOOL)decelerate {
if(!decelerate){
[QAPMBlueProfile stopTrackingWithStage:NSStringFromClass([self class])];
}
}
- (void)scrollViewDidEndDecelerating:(UIScrollView *)scrollView {
[QAPMBlueProfile stopTrackingWithStage:NSStringFromClass([self class])];
}
Crash Monitoring
QAPMMonitorTypeCrash Crash logs will be reported upon the next SDK startup.
Note:
1. If the business side is using a third-party SDK for collecting normal crash data, please uninstall the third-party monitoring software to avoid reporting inaccurate stack information.
2. After a FOOM or deadlock freeze exit, the related stack information recorded from the last session will be reported upon the next startup. FOOM are fully reported in debug or non-App Store scenarios. In the App Store environment, data is sampled at 2%.
Startup Duration Monitoring
Description
By using the startup duration monitoring feature, you can measure the duration from the creation of the app process to the first frame of the UI being rendered.
When the startup time exceeds the threshold (4,000 ms by default), detailed case information is reported. This includes the startup duration, automatic tagging interval, custom tagging intervals, and the startup process stack information.
Related APIs
@interface QAPMLaunchProfile : NSObject
- (void)setBeginTimestampForScene:(NSString *)scene;
- (void)setEndTimestampForScene:(NSString *)scene;
@end
Sample Code
In the corresponding class of the project, import the header file #import <QAPM/QAPMLaunchProfile.h>.
Starting monitoring component in the main function:
int main(int argc, char * argv[]) {
@autoreleasepool {
[QAPMLaunchProfile didEnterMain];
return UIApplicationMain(argc, argv, nil, NSStringFromClass([AppDelegate class]));
}
}
Web Monitoring
Note:
1. Currently, WKWebView supports iOS 11 and later.
2. This feature can monitor the loading time of web network resources and jserror.
Feature Configurations
Web Configurations
Note:
If you use manual integration, you need to import the js_sdk inside the framework into the project using the Add Files to method. If integrated with CocoaPods, this step is not needed. If you use the TMFWebOffline offline package feature, you need to import #import <TMFQWebView/QBWKWebView.h> into the header file of the related pages in the project and adhere to the TMFWebOfflineWebViewControllerProtocol proxy. WKWebView inherits TMFWkWebView as set below:
#import <TMFQWebView/QBWKWebView.h>
@interface WKWebviewViewController ()<WKUIDelegate, WKNavigationDelegate, WKScriptMessageHandler,TMFWebOfflineWebViewControllerProtocol>
{
TMFWkWebView *wkWebView;
}
iOS SDK Configurations
Add #import <QAPM/QAPMLaunchProfile.h> in the class file to import the SDK header file.
Add the following code in the WKWebView proxy method of webView:didFinishNavigation to provide a Web API for obtaining native-related information.
- (void)webView:(WKWebView *)webView didFinishNavigation:(WKNavigation *)navigation
{
[webView evaluateJavaScript:[QAPMWebViewProfile qapmBaseInfo:@" "] completionHandler:nil];
[webView evaluateJavaScript:[QAPMWebViewProfile qapmJsStart] completionHandler:nil];
}
User Privacy Agreement
Privacy compliance policy: Due to privacy compliance requirements, ensure not to call any QAPM APIs before users' consent for privacy compliance. In addition, QAPM still requires a device-level unique identifier to determine the uniqueness of the device, used for user-level metric calculation.
if (isAgree) { }
[QAPMConfig getInstance].deviceID = @"Custom deviceId";
[QAPMConfig getInstance].userId = @"Set userId";
Note:
The background of deviceID collection method change: The current regulations require the SDK not to collect information such as UDID directly or indirectly. We can only let users input identifiers to distinguish different devices. This effectively reduces the distortions in crash rate metric data.
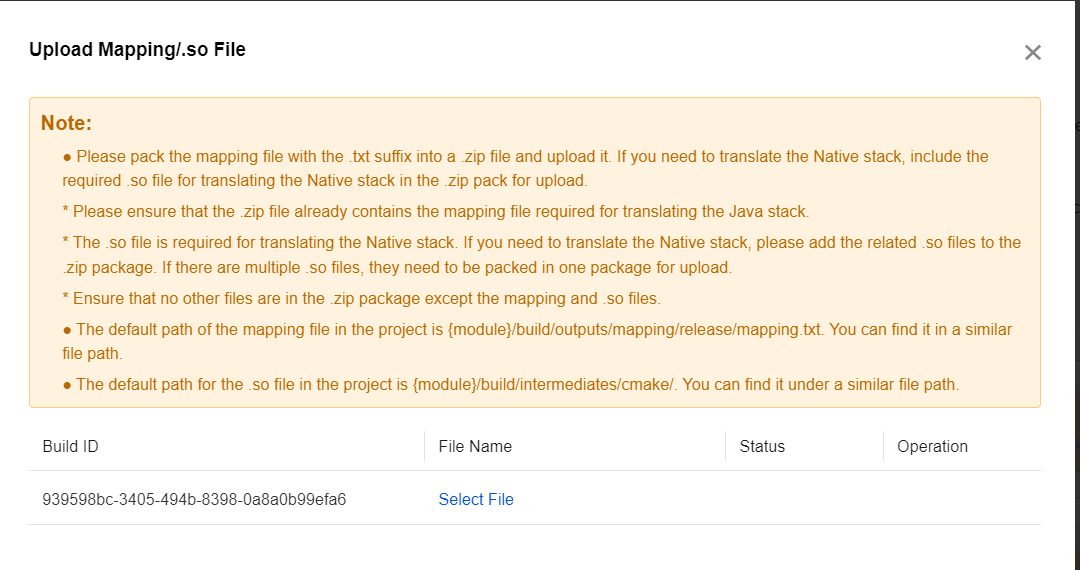
Symbol Table Configurations
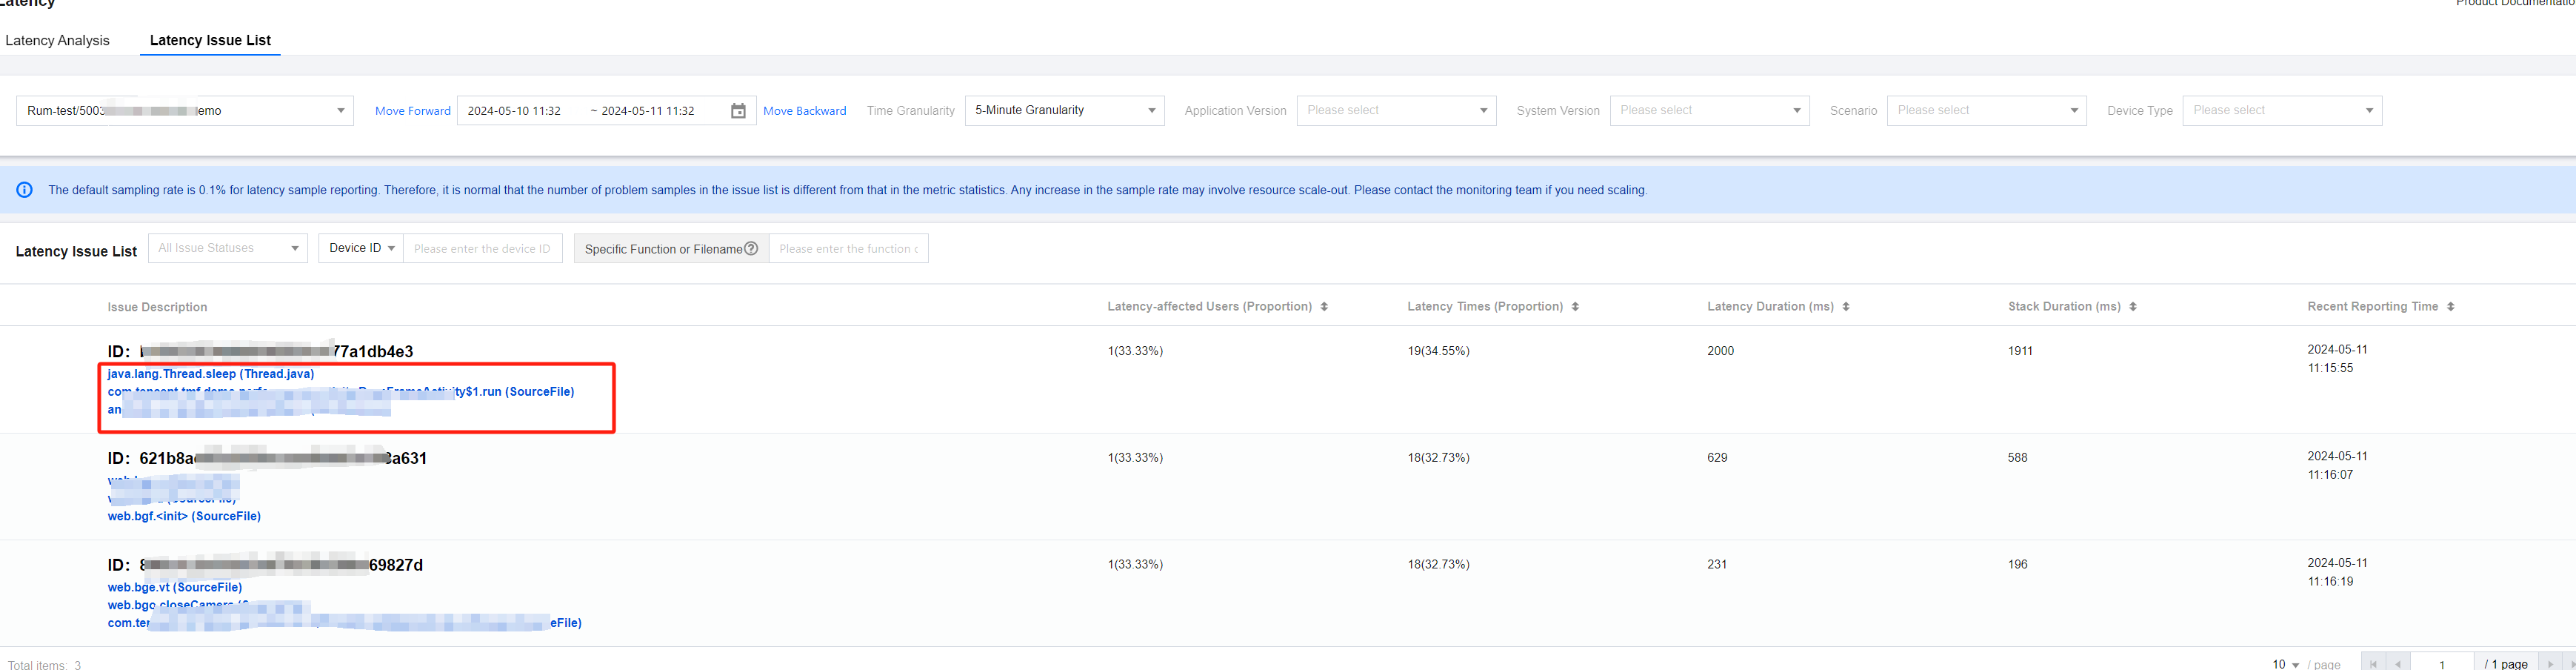
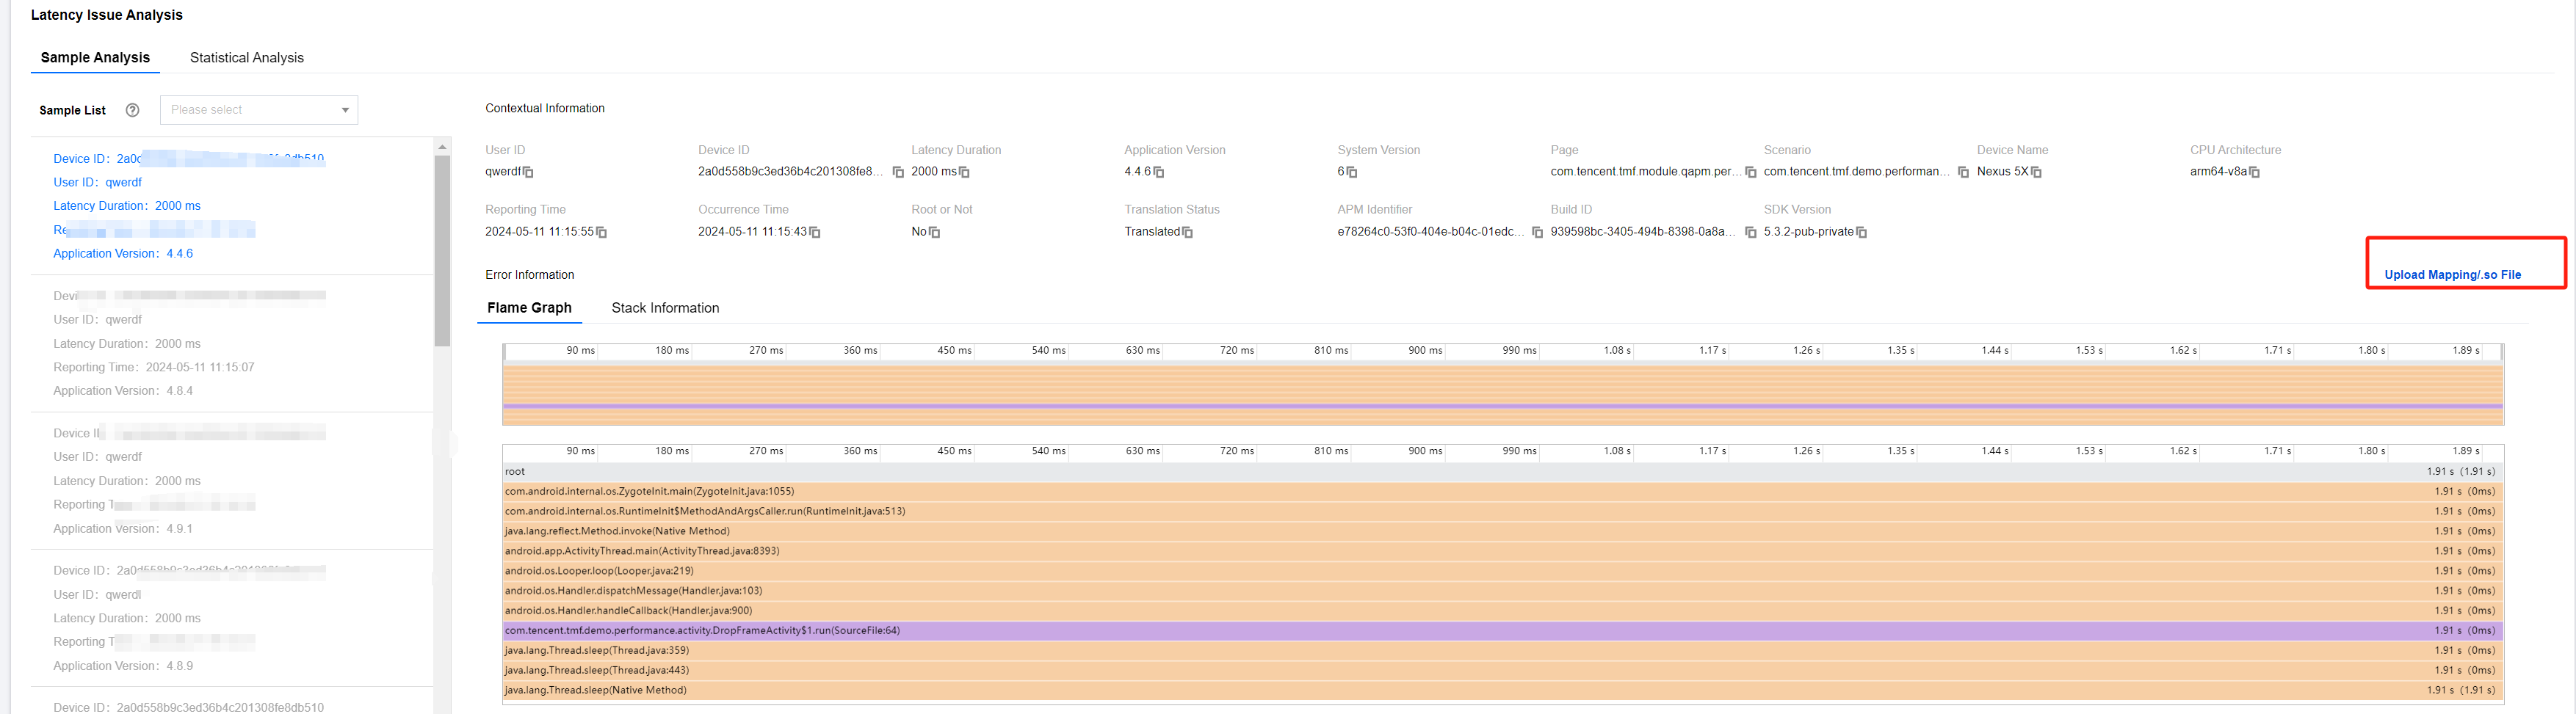
Use the reported individual case data to upload the symbol table. Identify the corresponding symbol table via the build ID on the individual case page. You can use the official atos command to translate a certain line of stack on the individual case page to ensure the symbol table and translation are normal.
1. There is an uploading entrance on the individual case page. For example, select Latency > Latency Analysis > Latency Issue List, to enter the details page.
2. On the details page, click Upload Mapping/.so File.. 3. Go to the symbol table upload page, click Select File, then select the dSYM file corresponding to that build.
Viewing QAPM Work Log
Setting Work Log Viewing
Before you start the QAPM SDK with [QAPM startWithAppKey:], set the log output function to control the log output according to different release versions:
void loggerFunc(QAPMLoggerLevel level, const char* log) {
#ifdef RELEASE
if (level <= QAPMLogLevel_Event) {
NSLog(@"%@", [NSString stringWithUTF8String:log]);
}
#endif
#ifdef GRAY
if (level <= QAPMLogLevel_Info) {
NSLog(@"%@", [NSString stringWithUTF8String:log]);
}
#endif
#ifdef DEBUG
if (level <= QAPMLogLevel_Debug) {
NSLog(@"%@", [NSString stringWithUTF8String:log]);
}
#endif
}
- (BOOL)application:(UIApplication *)application didFinishLaunchingWithOptions:(NSDictionary *)launchOptions {
[QAPM registerLogCallback:loggerFunc];
}
Submitting Log Analysis
After the SDK is connected, the monitoring features are usually confirmed to be enabled by analyzing logs.
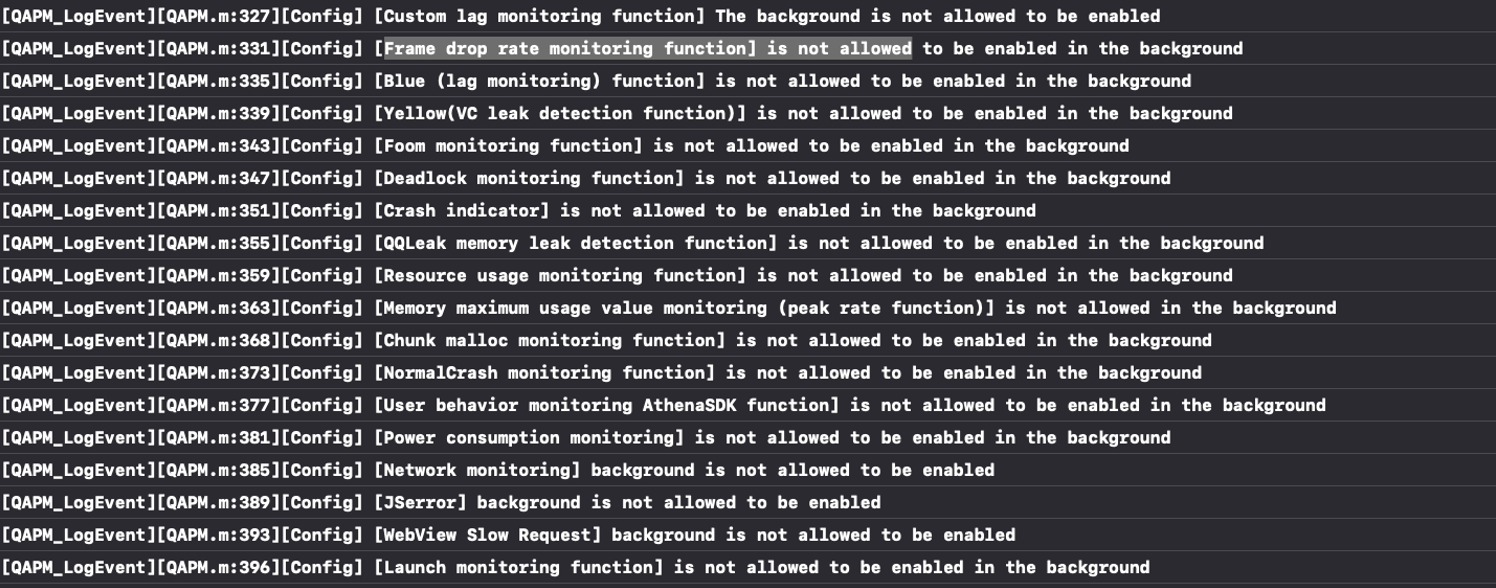
When the monitoring feature is not enabled, the logs are as follows:
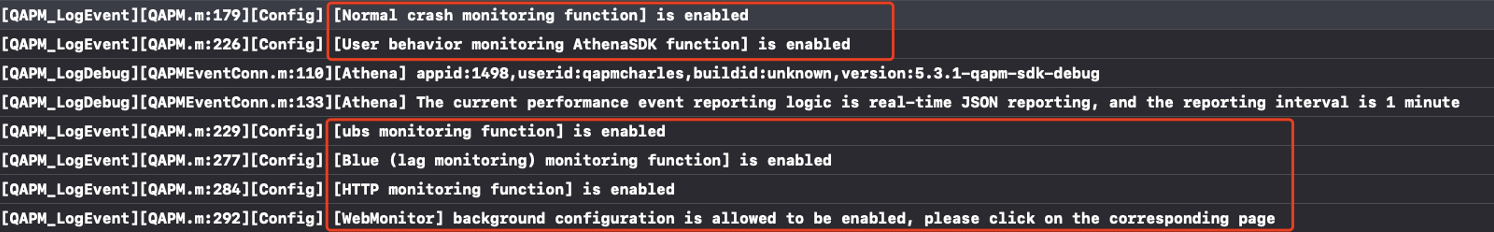
When the monitoring feature is enabled, the logs are as follows:
By checking the initialization logs, you can confirm whether the initialization is successful. All monitoring features are enabled, and then each feature's successful reporting is verified.
Startup Duration Report
Stalling Case Report
FOOM Case Report
Deadlock Case Report
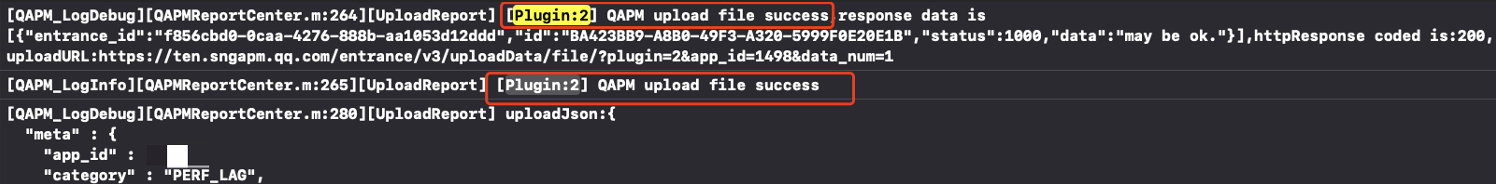
HTTP Monitoring Report
Report of a Normal Crash
When the report of a normal crash is being triggered, do not connect the data cable to Xcode. After the normal crash is triggered, the report information can be seen upon the restart of the App. This reporting log can be viewed using the console that comes with Mac, and the log is as follows:
Webview and JSerror Report
Webview and jserror report can be viewed in Xcode, based on plugin:43 and plugin:41.