
压测指标导出使用指南

最后更新时间:2025-03-10 22:20:39
云压测提供从实时运行的测试任务中导出压测指标到指定系统的能力,支持用户自定义管理和查询压测指标的需求。
压测指标导出
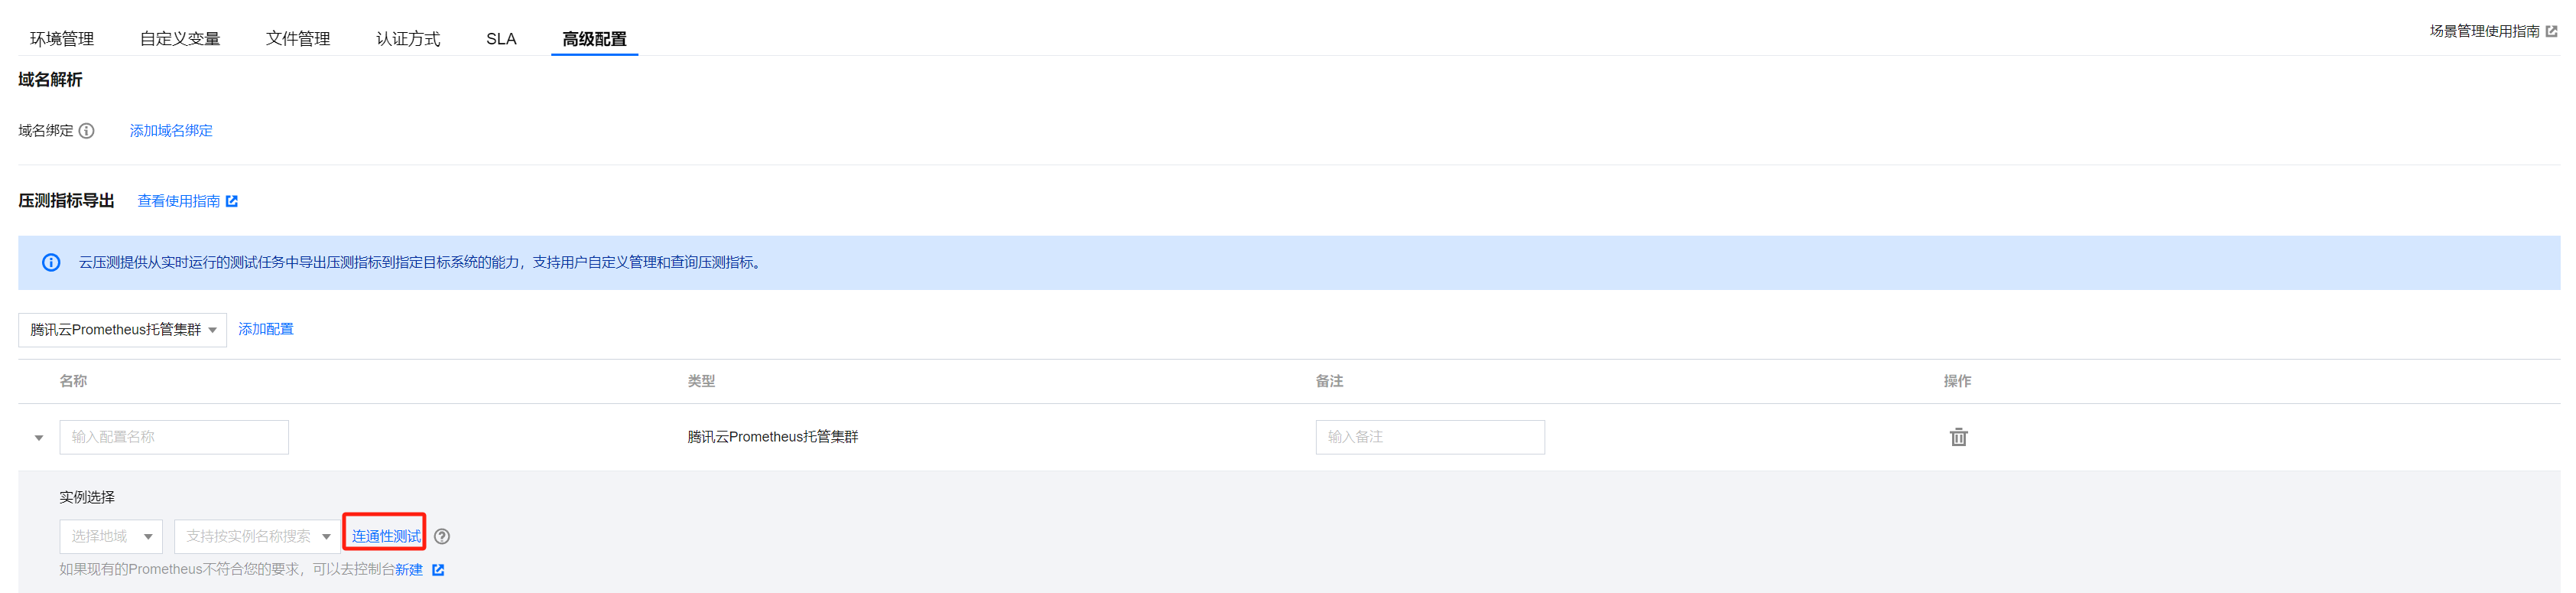
1. 登录 云压测控制台,选择测试场景,创建压测场景并单击高级配置菜单,可以看到压测指标导出的配置选项。
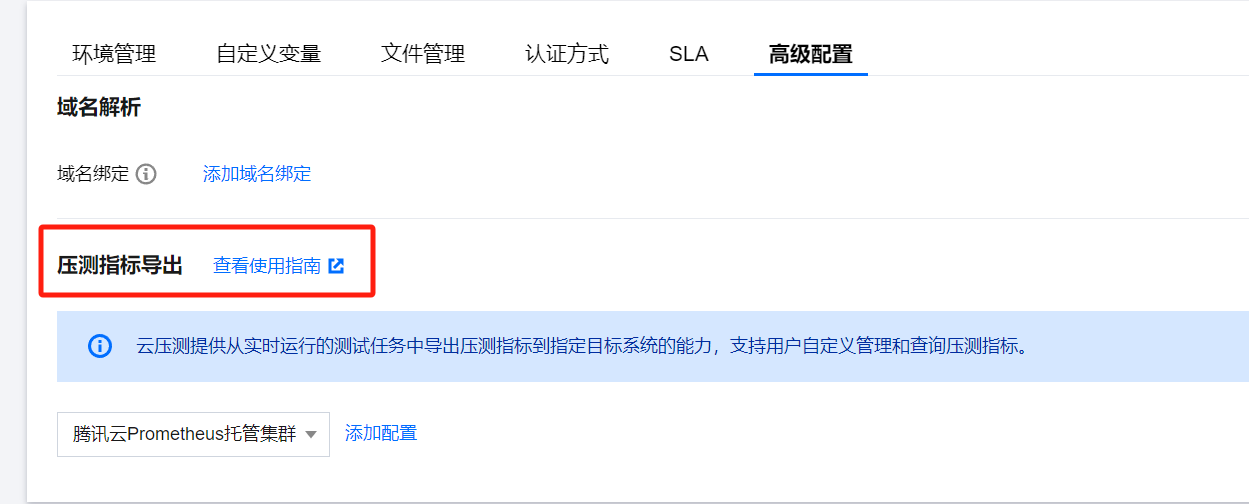
2. 选择压测指标导出的目标系统类型并单击添加配置,目前,云压测支持将压测指标导出到腾讯云 Prometheus 托管集群。若要查看账号已有的 Prometheus 托管集群,请 前往控制台 查看。
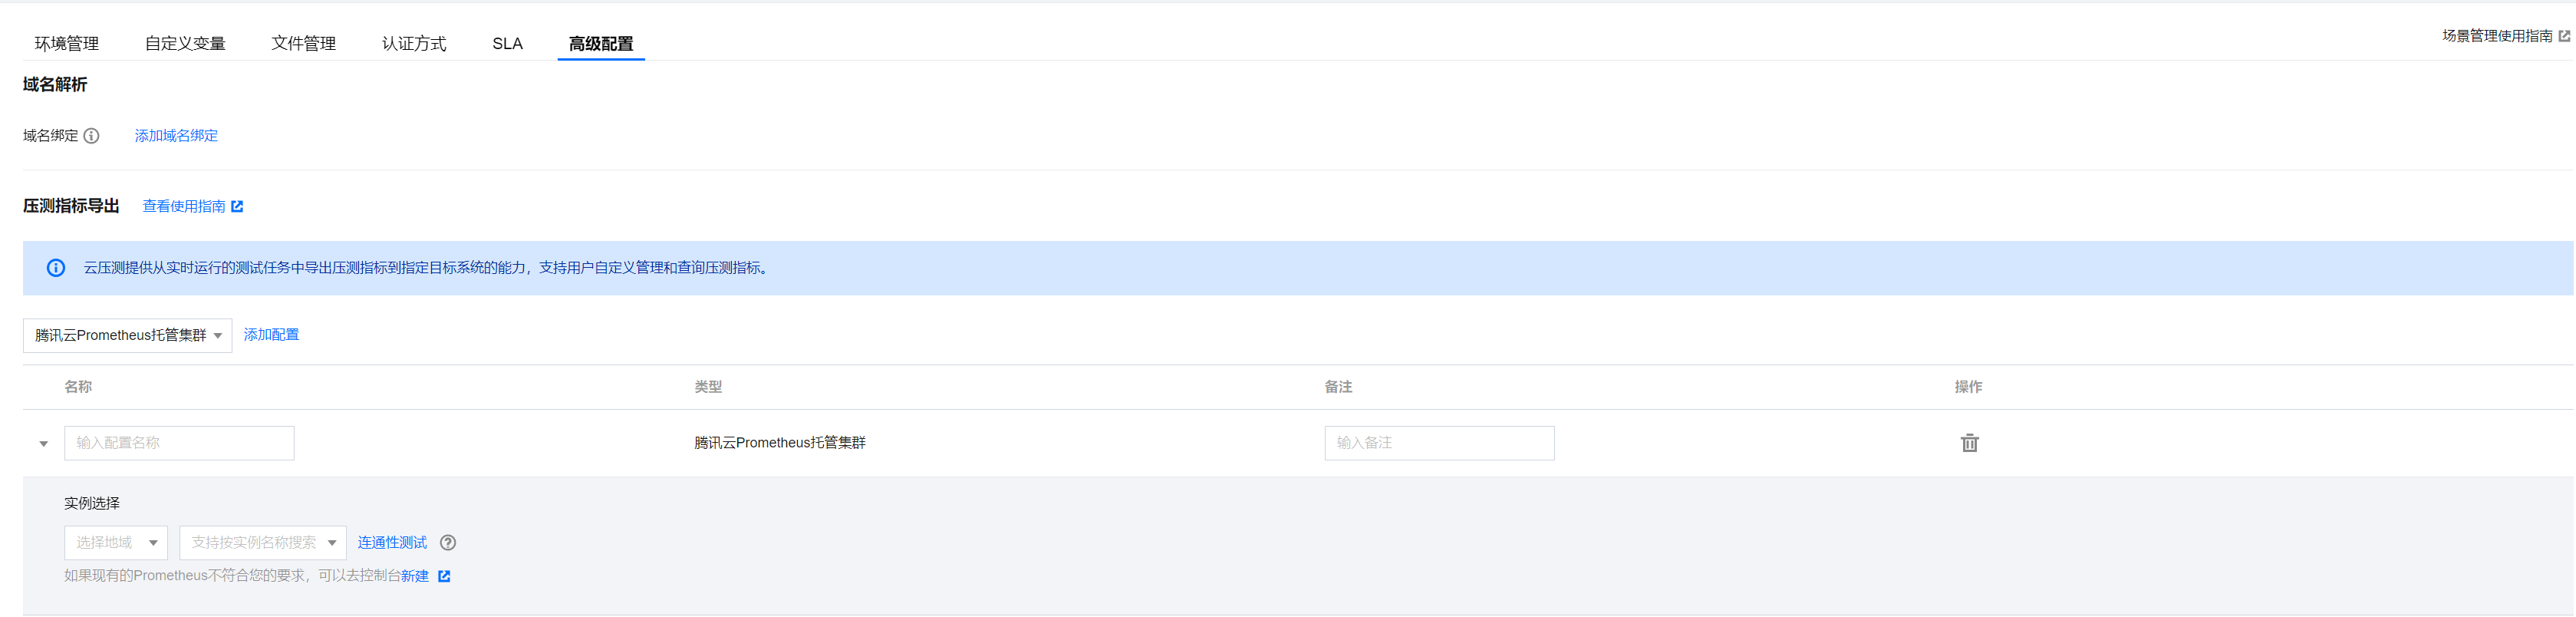
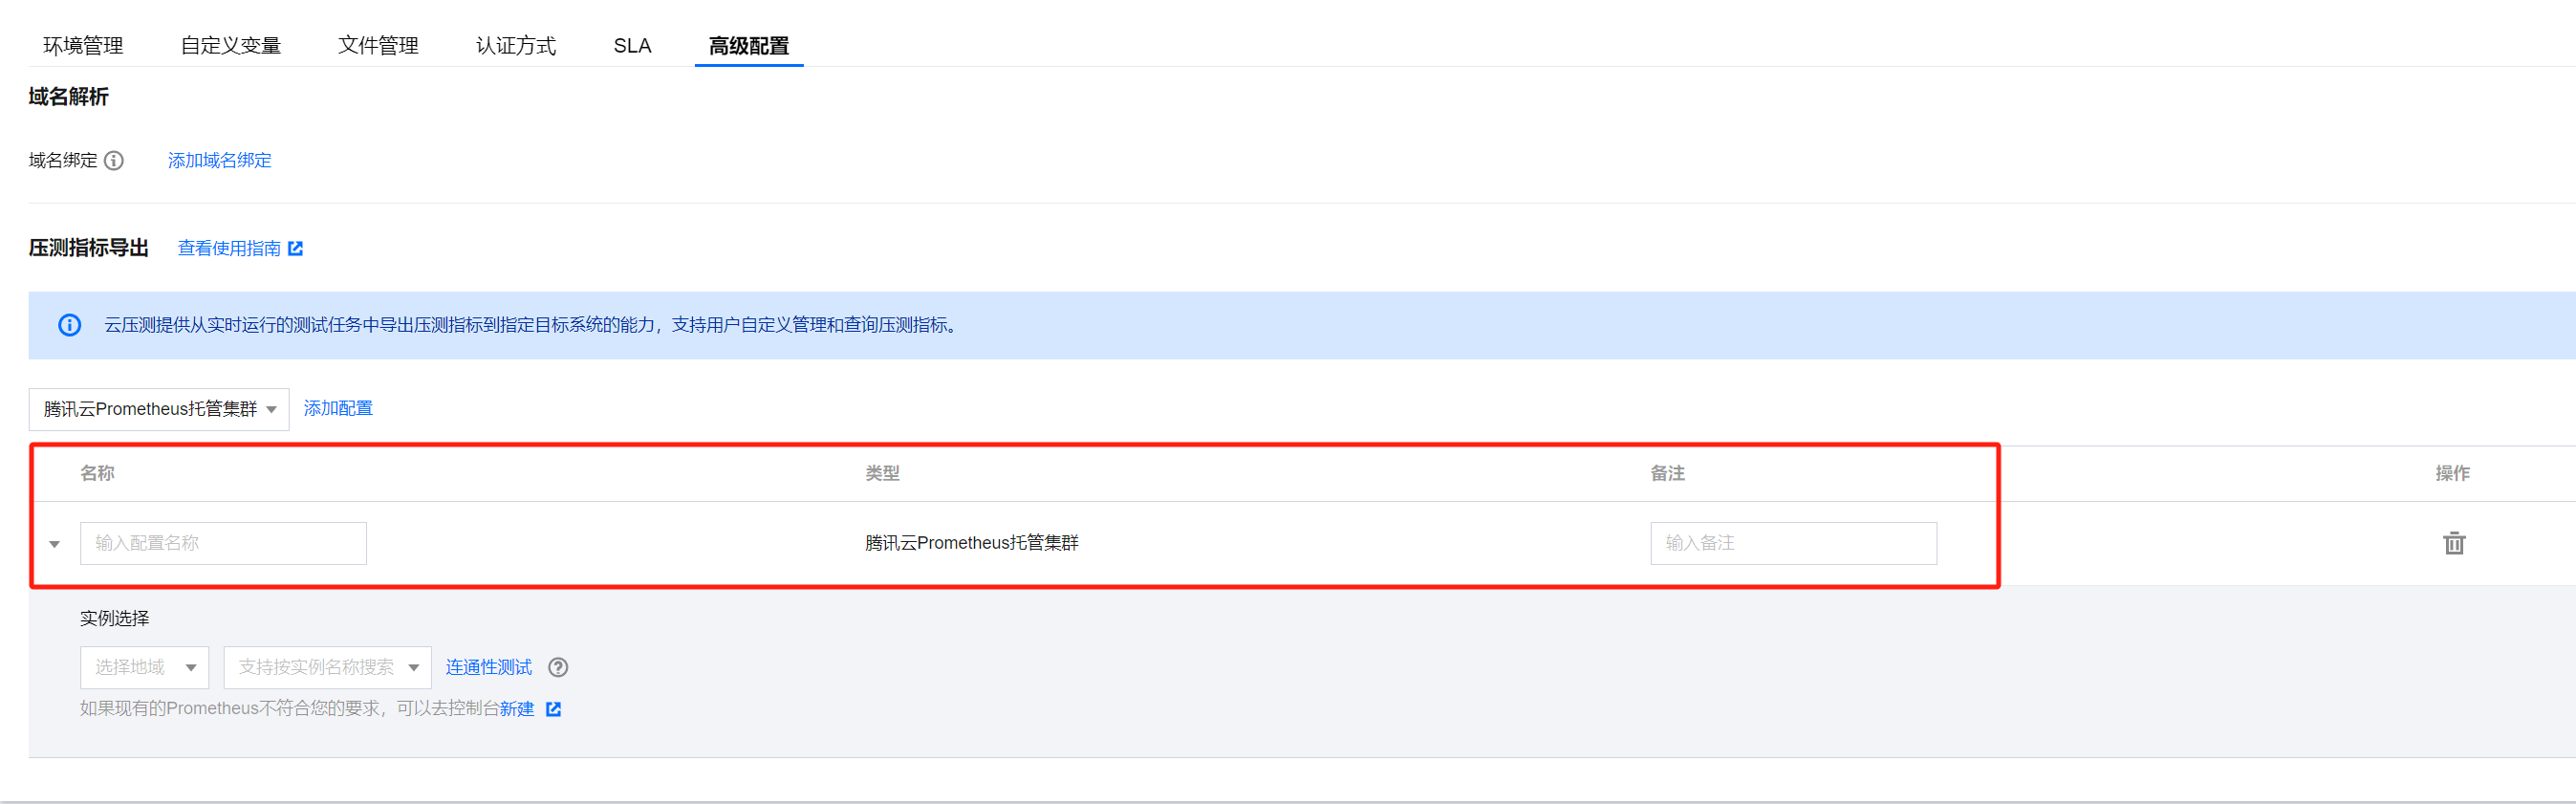
3. 进行配置基础信息的填写,其中配置名称是必填项、配置备注是选填项。
4. 选择 Prometheus 实例,指定地域后,选择压测指标导出的 Prometheus 实例。
若现有的 Prometheus 实例不符合您的要求,可以单击新建跳转链接到 Prometheus 控制台新建实例。
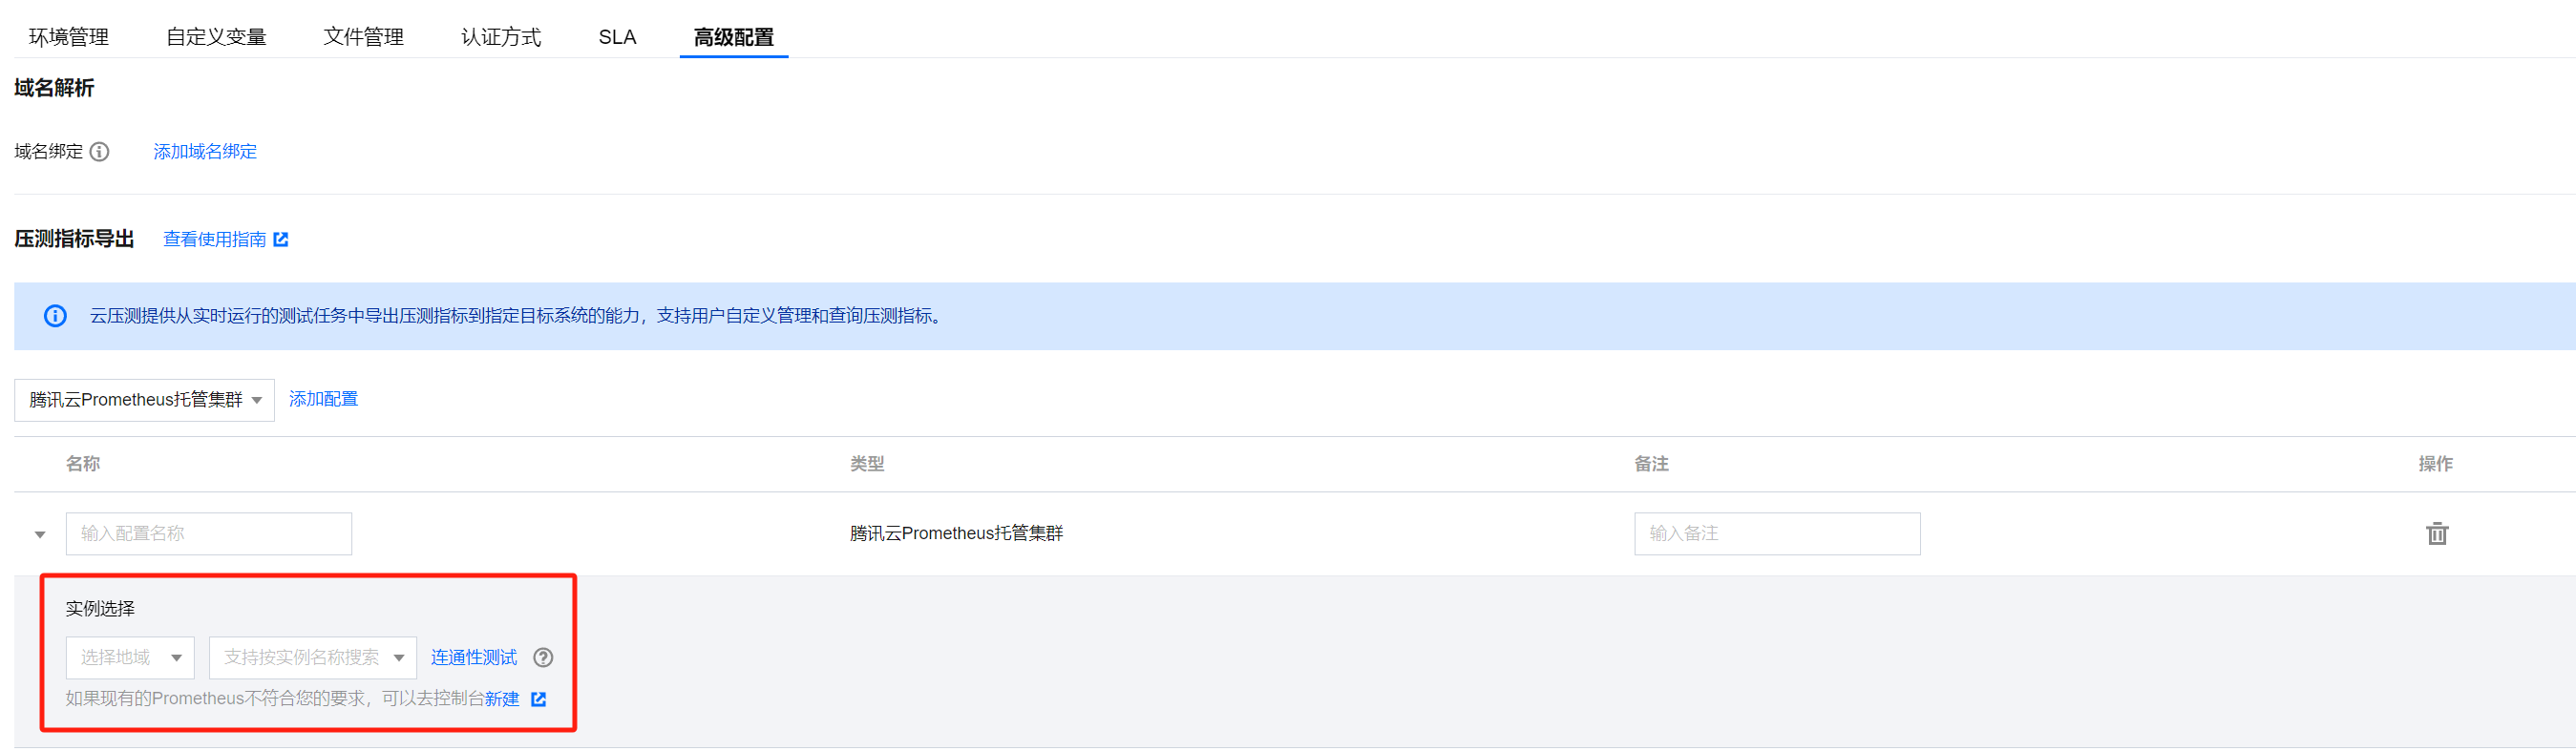
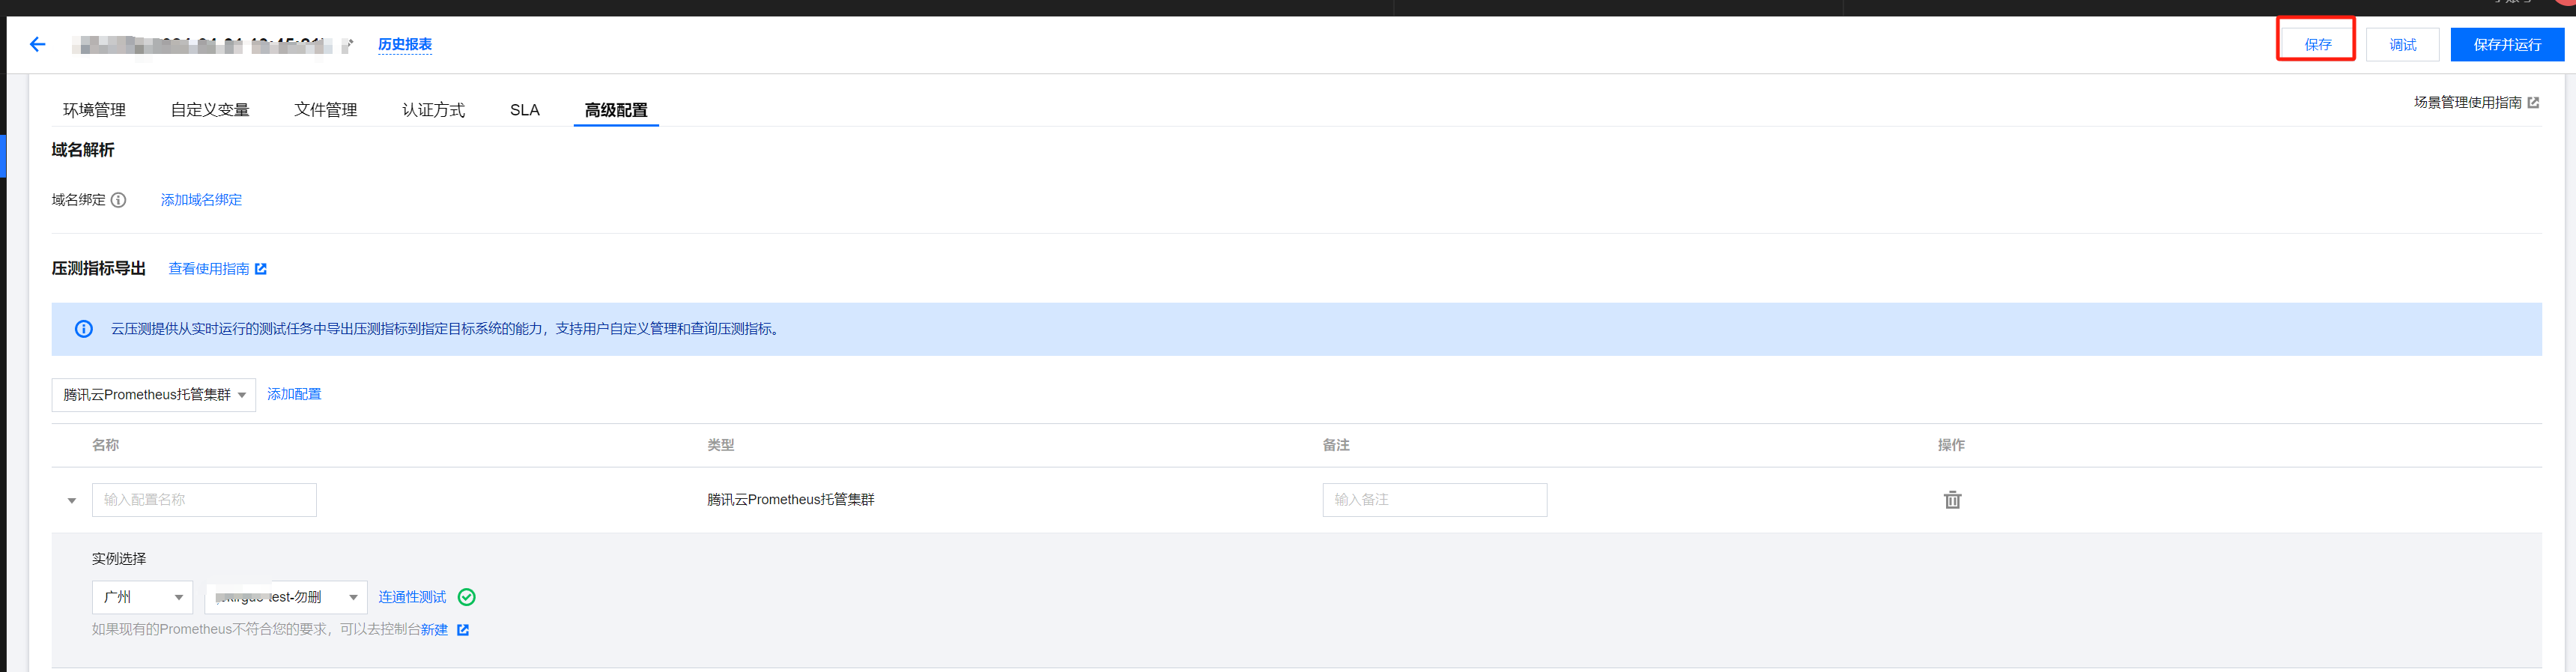
5. 单击连通性测试,检测云压测后台能否访问已选定的 Prometheus 实例。
若显示为绿色的对勾,则说明通过连通性测试;若显示橙色的叹号,则说明云压测后台无法访问到对应的实例。
注意:
“连通性测试”仅对当前的实例状态进行检测,在未来的压测任务执行的过程中,若实例出现故障或销毁等情况导致云压测后台无法访问,则也无法将压测指标导出到对应实例中。
6. 单击保存即可保存场景,在任务运行时就可以将压测指标导入到配置的 Prometheus 中;目前云压测支持导出的压测指标详情请参见 压测指标介绍。
压测指标查看
云压测将压测指标导出到指定的 Prometheus 实例中,支持用户自定义地查询和管理压测指标数据。
以下主要介绍如何在 Grafana 中查看云压测导出的压测指标数据:
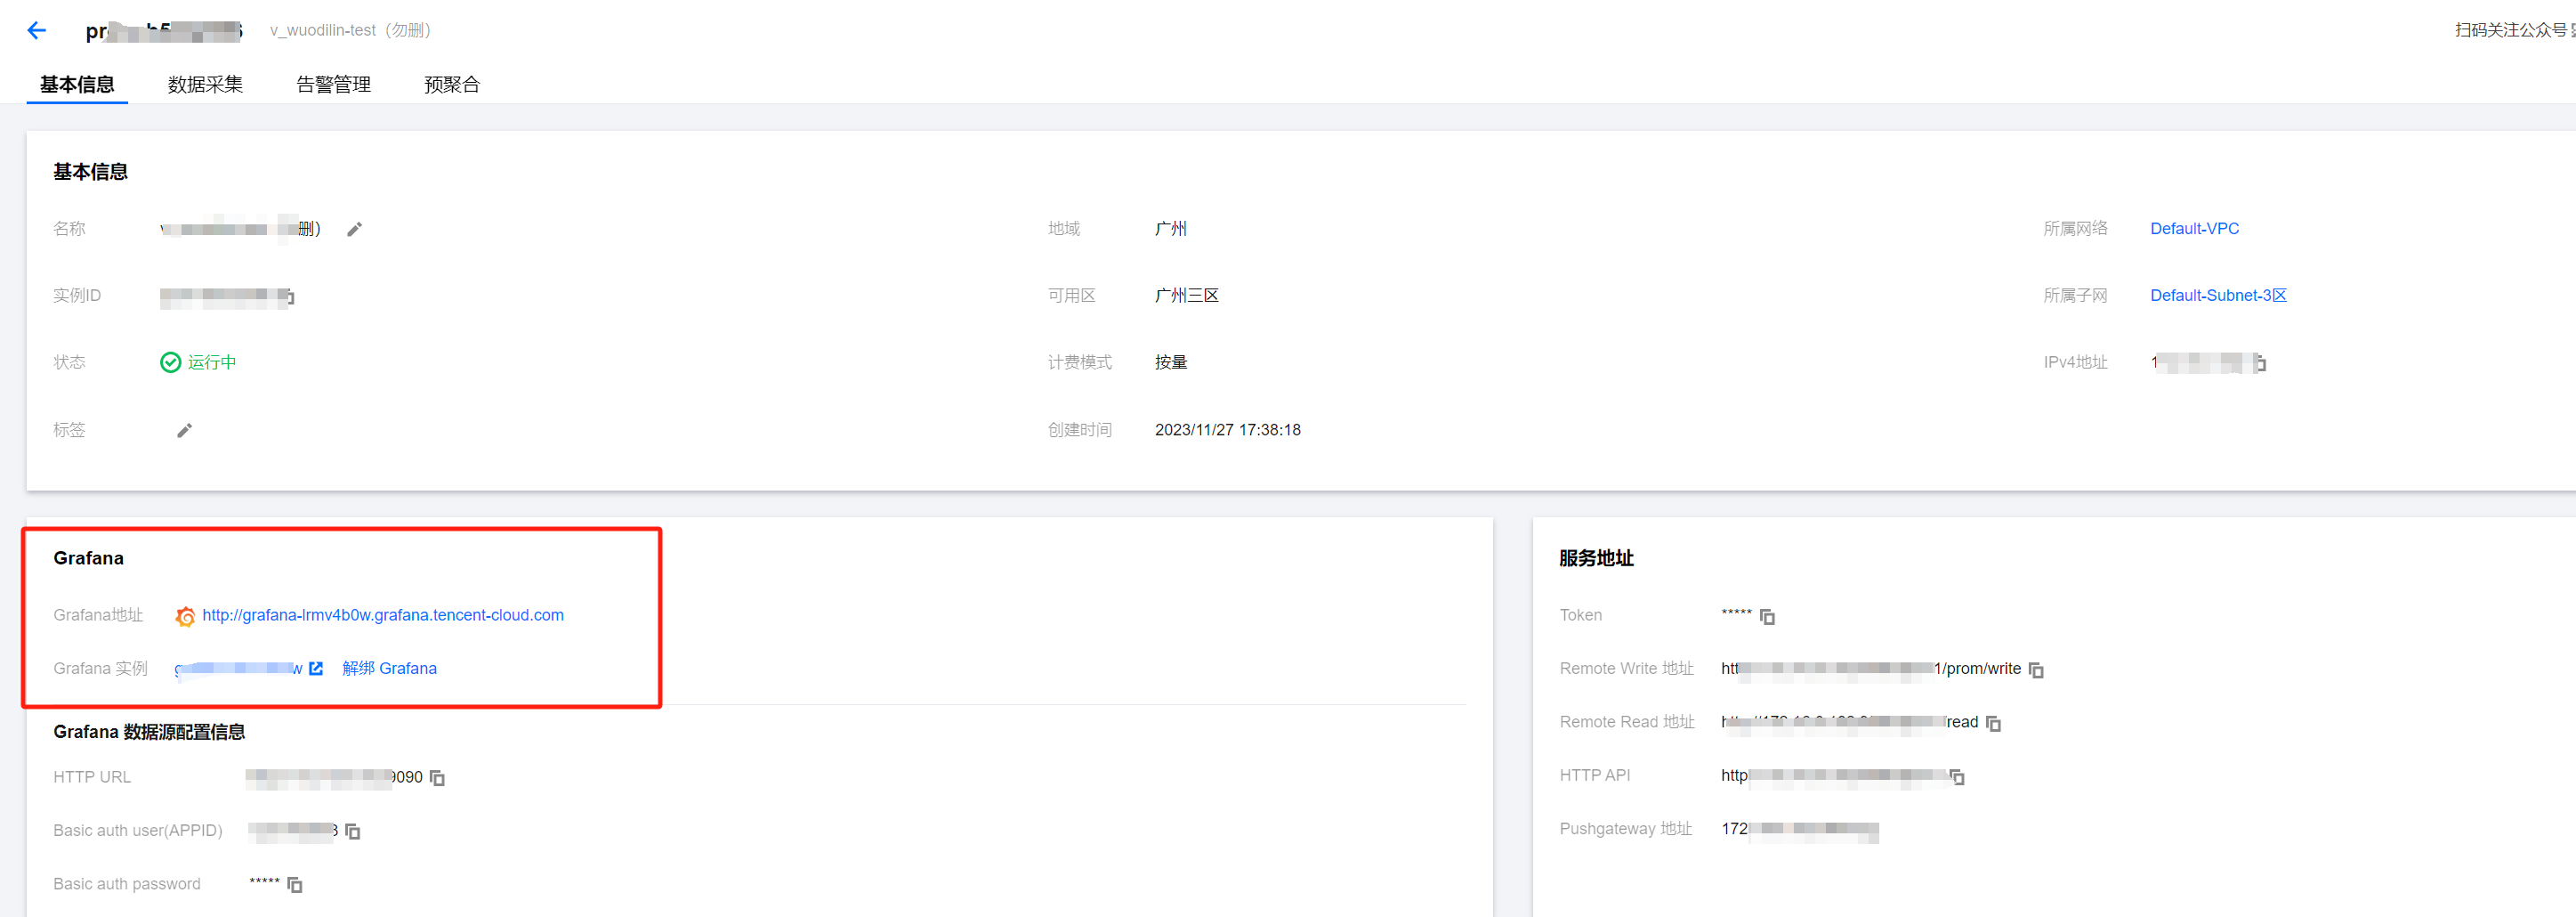
1. 进入 Prometheus 实例的“基本信息”页面,确认是否已绑定可用的 Grafana 实例。
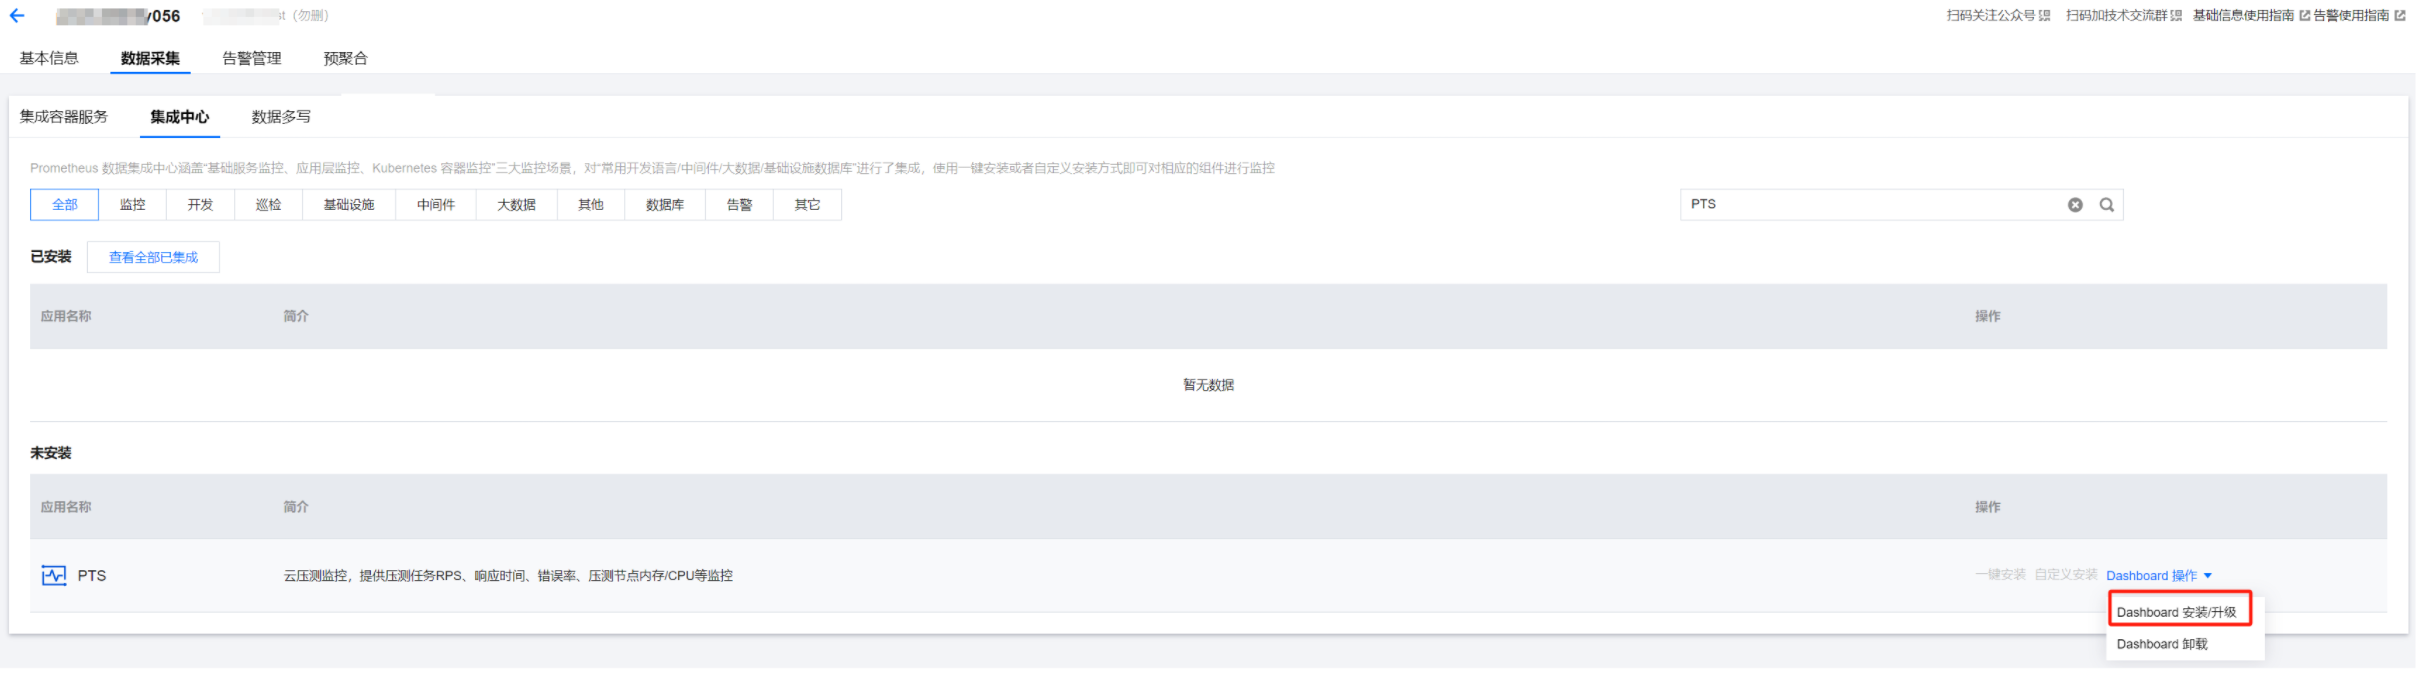
2. 在 Prometheus 实例的集成中心页面,搜索“PTS”找到 PTS 集成,单击 Dashboard 操作 > Dashboard 安装/升级并单击确定,可以在 Grafana 中自动安装云压测 Dashboard。
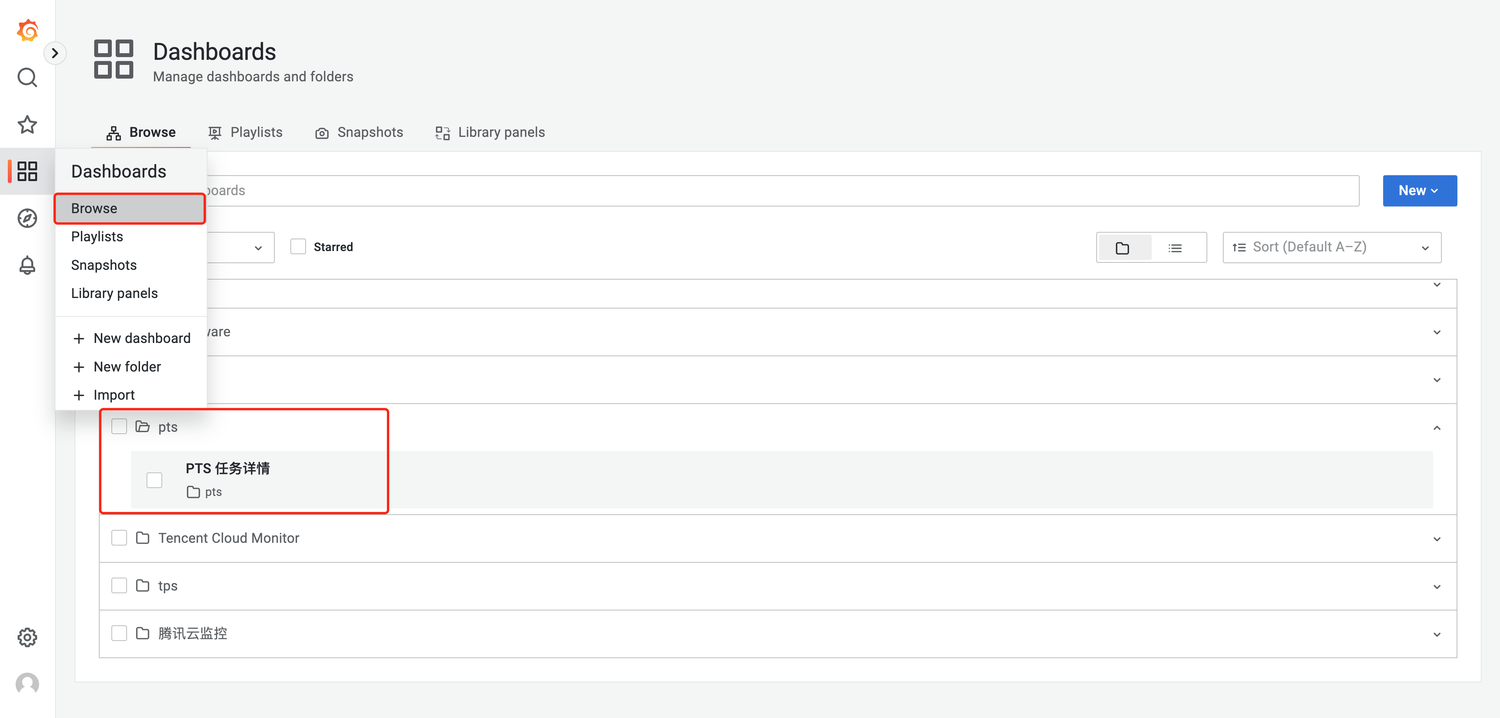
3. 在 Prometheus 实例的“基本信息”页面,单击绑定的 Grafana 并登录进入 Grafana 界面,进入“Dashboards”-“Browse”-“pts”-“PTS 任务详情”即可看到安装的云压测 Dashboard。
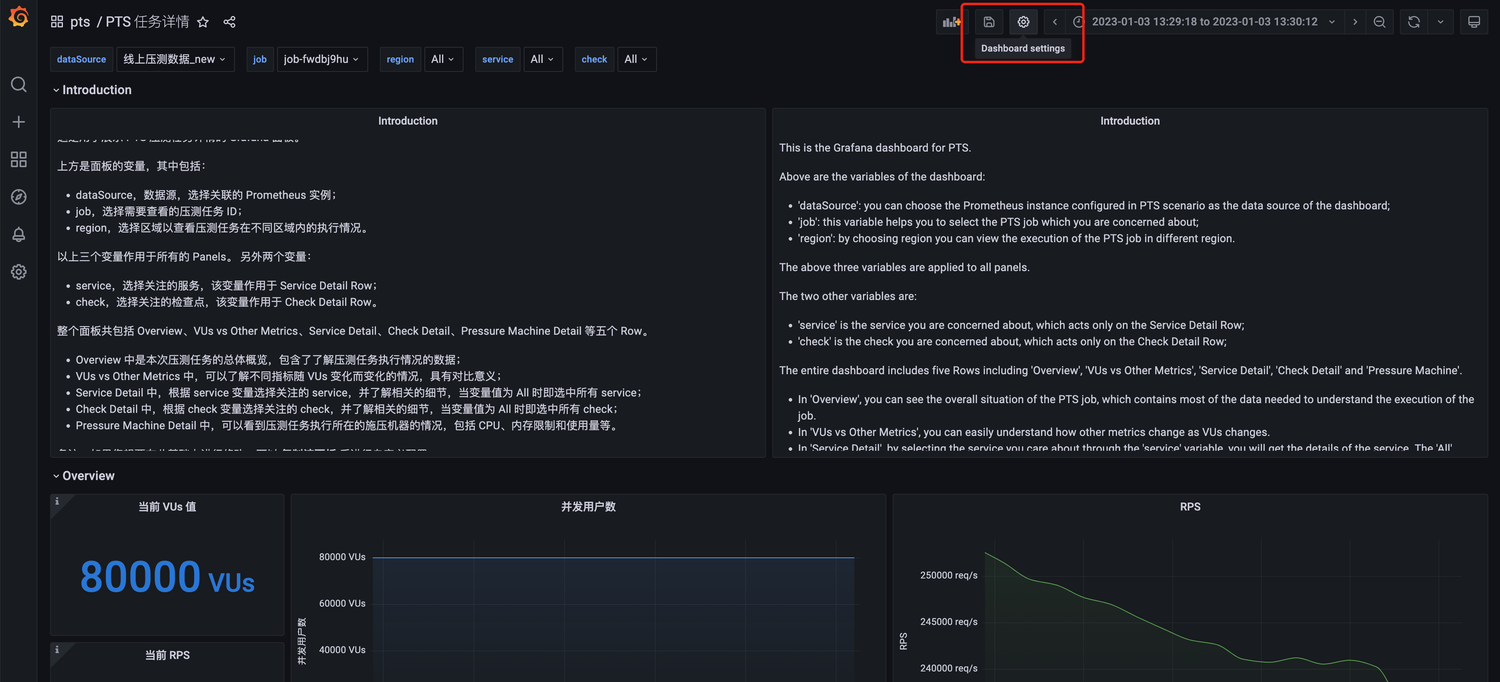
监控面板使用
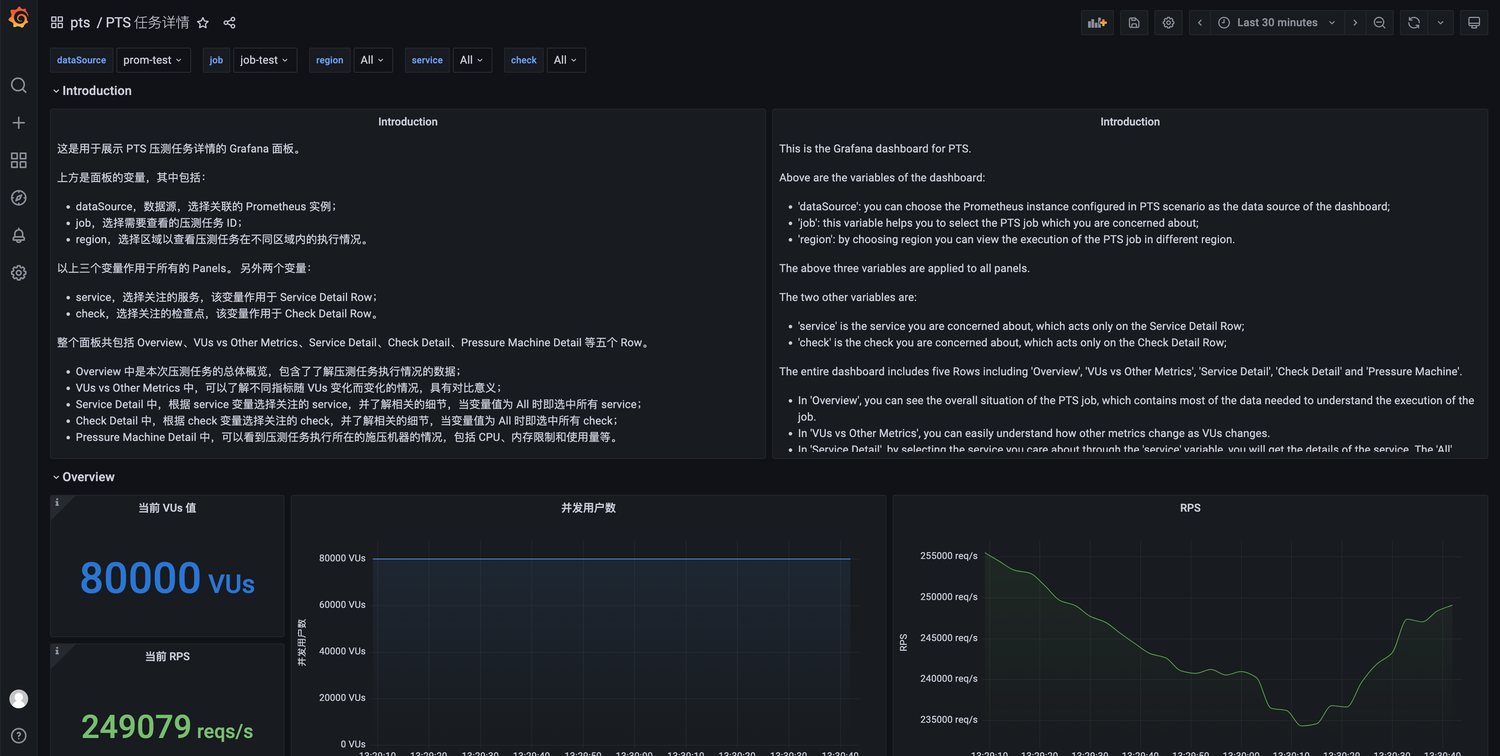
面板概览图:
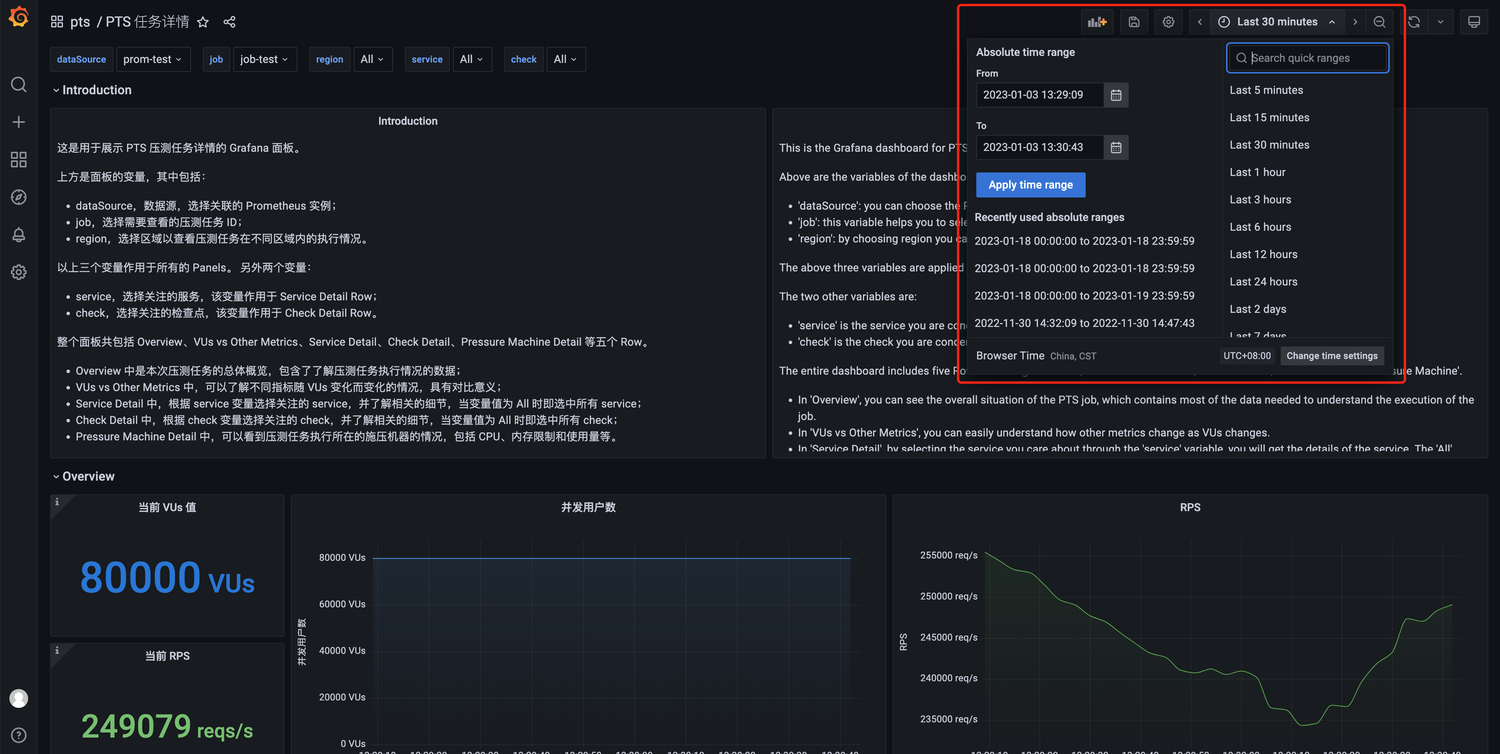
其中,右上方的时间栏代表了查询数据的时间范围,通过下拉填写能够改变面板展示不同时间范围的数据。
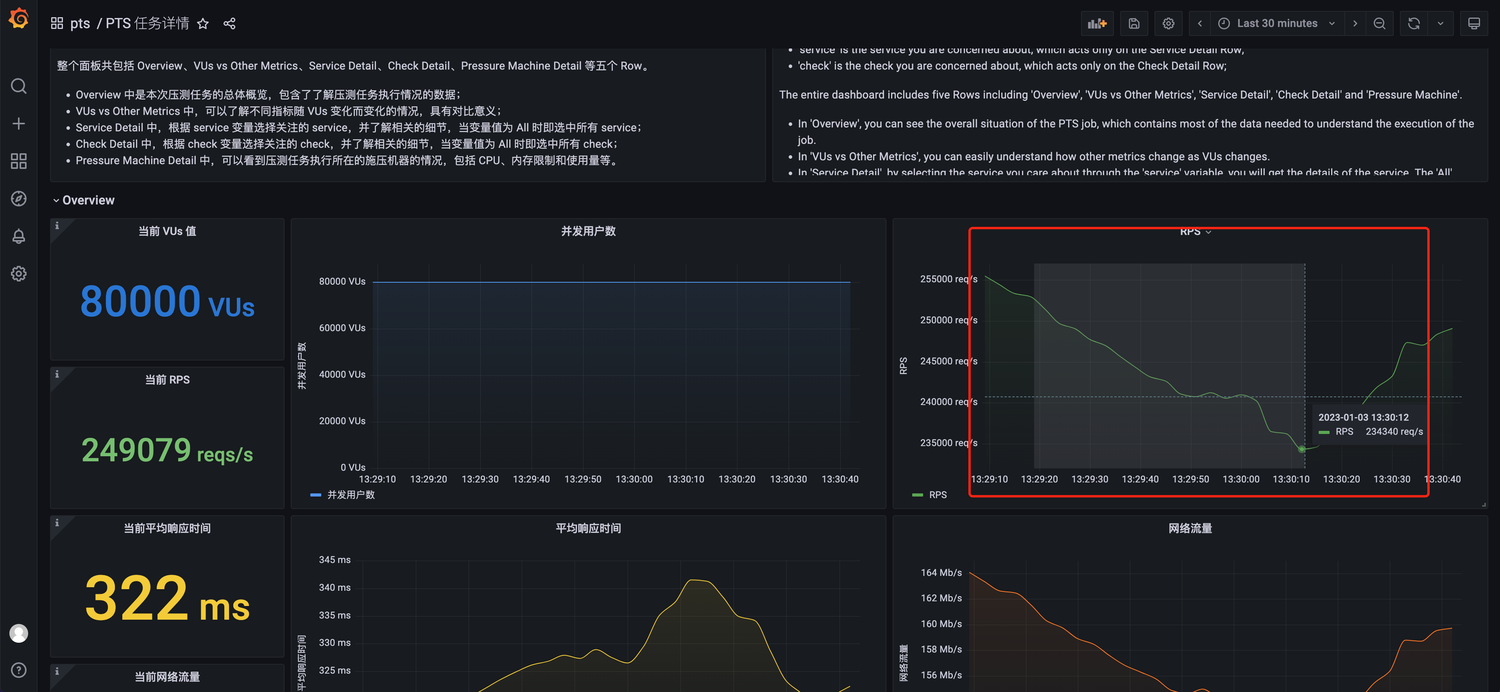
时间的变化也可以在面板里面选择,如图,在需要的时间开始处按住并拖动即可:
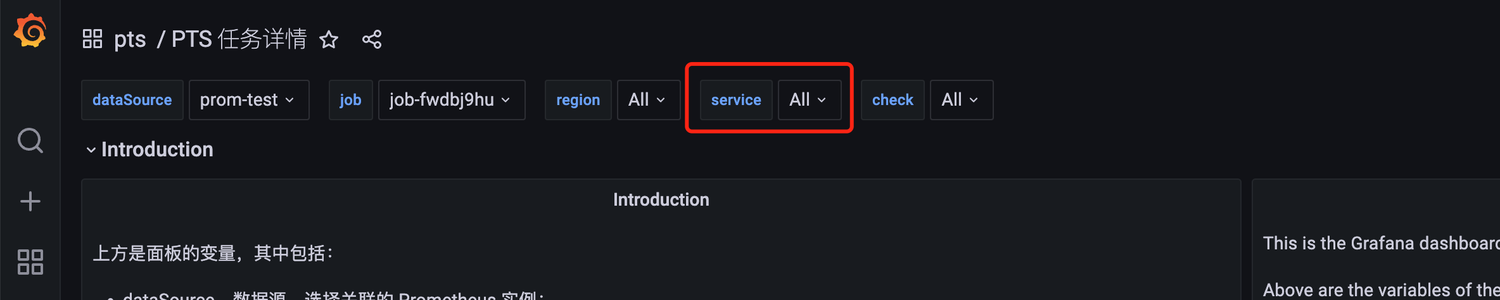
界面的正上方是该 Dashboard 包含的变量,包括:
dataSource,数据源,可以选择关联的监控指标导出的 Prometheus 实例。
job,选择需要查看的压测任务 ID。
region,选择区域以查看压测任务在不同区域内的执行情况。
以上三个变量作用于后面所有的图表。
另外两个变量是:
service,选择关注的服务,该变量作用于 Service Detail Row 栏。
check,选择关注的检查点,该变量作用于 Check Detail Row 栏。
整个面板共包括 Overview、VUs vs Other Metrics、Service Detail、Check Detail、Pressure Machine Detail 等五个栏。
Overview 中是压测任务的总体概览,包含了解压测任务总体执行情况的数据。
VUs vs Other Metrics 中,您可以了解不同指标随 VUs 变化而变化的情况,具有对比意义。
Service Detail 中,根据 service 变量选择关注的 service,并了解相关的细节,当变量值为 All 时即选中所有 service。
Check Detail 中,根据 check 变量选择关注的 check,并了解相关的细节,当变量值为 All 时即选中所有 check。
Pressure Machine Detail 中,可以看到压测任务执行所在的施压机器的情况,包括 CPU、内存限制和使用量等。
图表栏 Overview
Overview 中是压测任务的总体概览,通过该栏能够大致了解压测任务执行的情况。
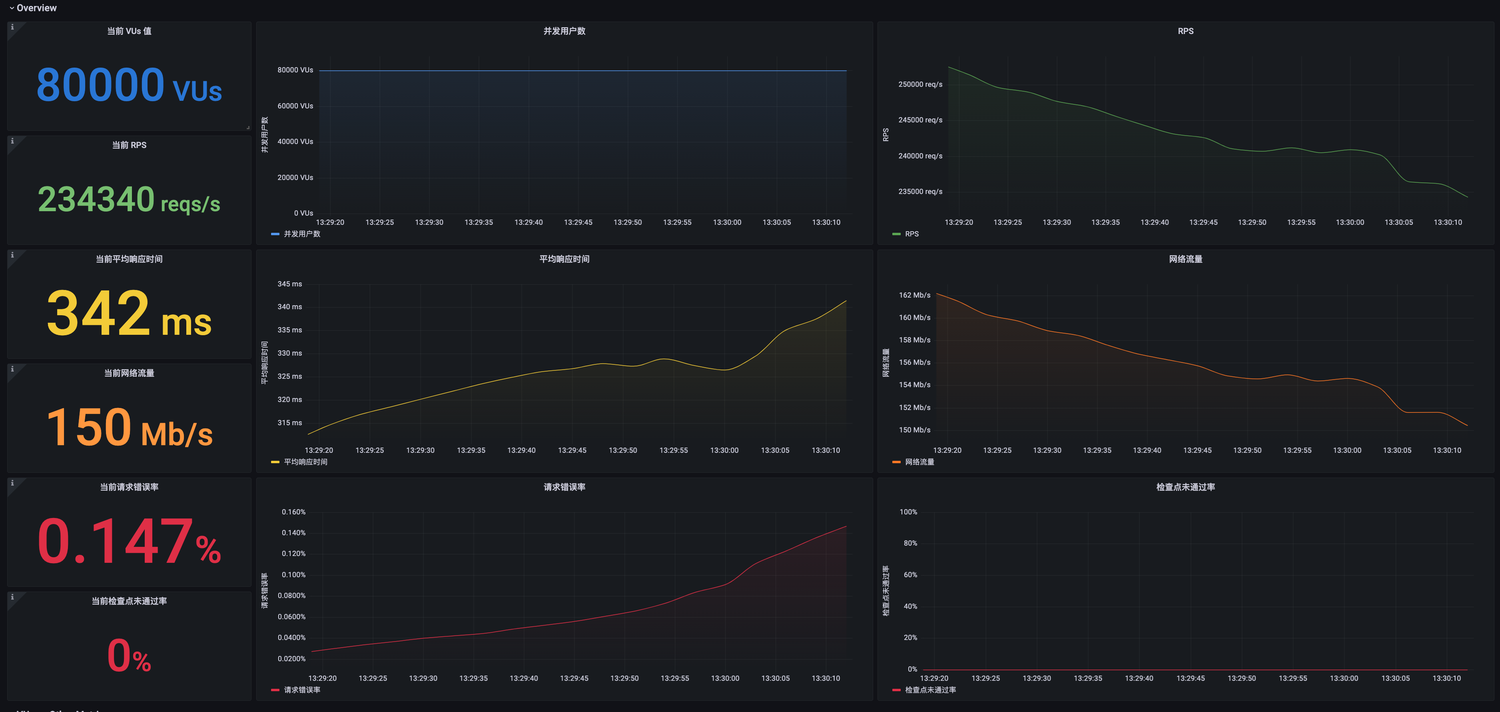
左侧为六个“瞬时”数值,代表当前任务运行的状态,右侧为六个时序曲线图表。
分别代表:
当前执行压测的 VU 数量及其随时间的变化。
当前的 RPS 数值及其随时间的变化。
当前执行请求的平均响应时间及其随时间的变化。
当前网络流量及其随时间的变化,包括入流量和出流量的加和。
当前请求错误率及其随时间的变化。
当前检查点未通过率及其随时间的变化。
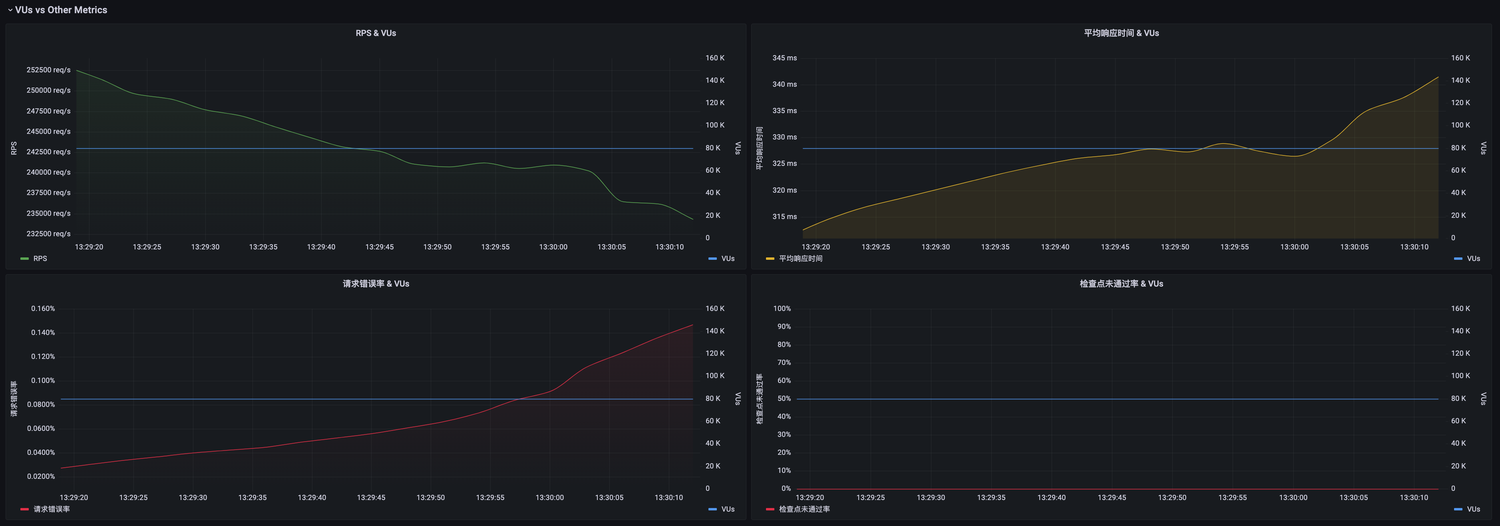
图表栏 VUs vs Other Metrics
VUs vs Other Metrics 中,可以了解不同指标随 VUs 变化而变化的情况,具有对比意义。
当压测场景中配置了 VU 梯度时,如图所示:
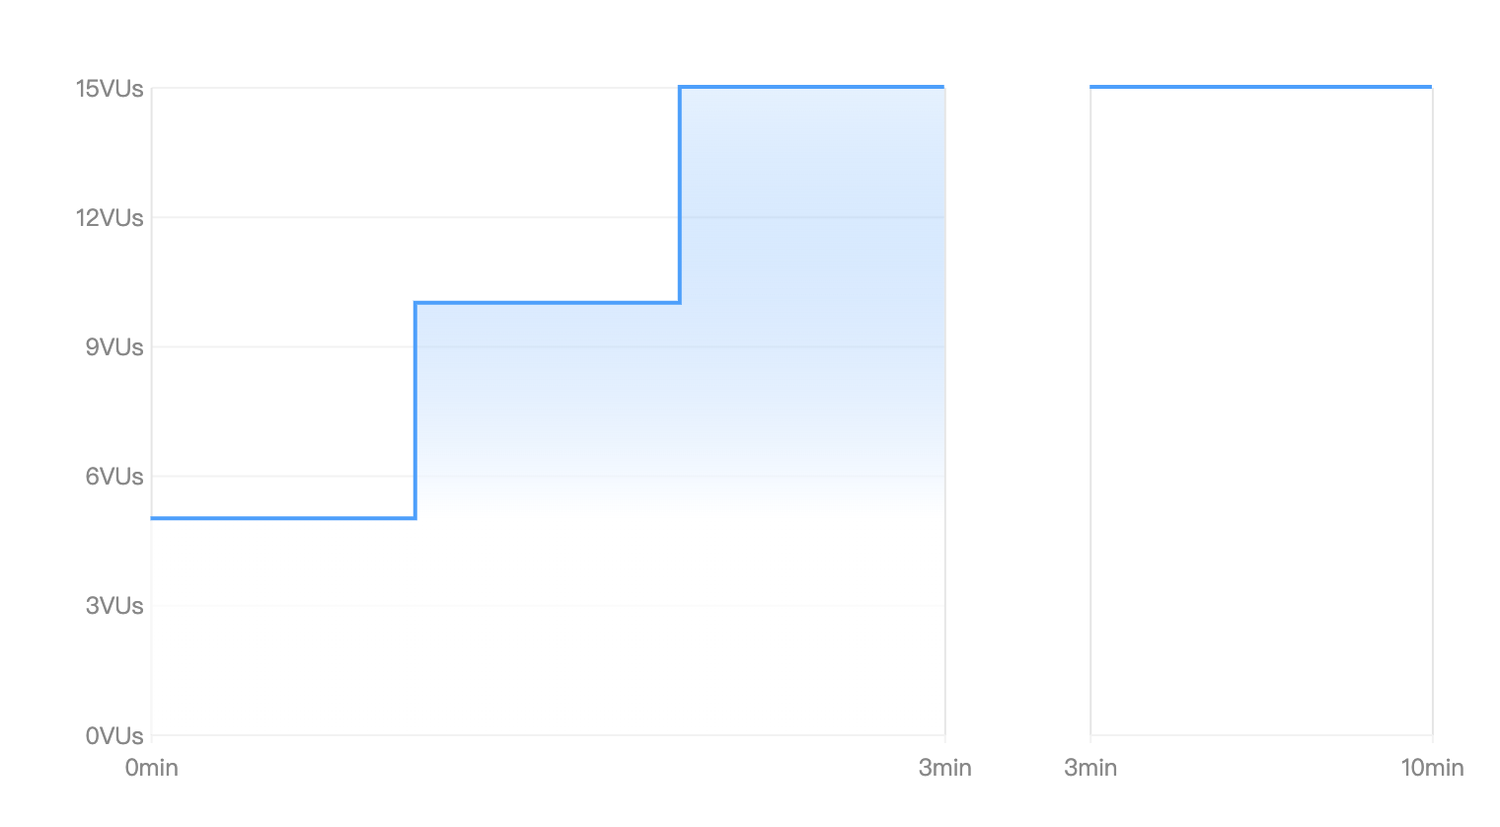
对应的施压力度会随着时间根据不同的梯度进行变化,因此,在不同 VU 数值下观察关键指标的变化具有重要的意义。
在该栏中,包括了 RPS 吞吐量、平均响应时间、请求错误率、检查点未通过率等和 VU 的对比时序曲线图,能够反映随 VU 变化时被压端执行请求的情况。
图表栏 Service Detail
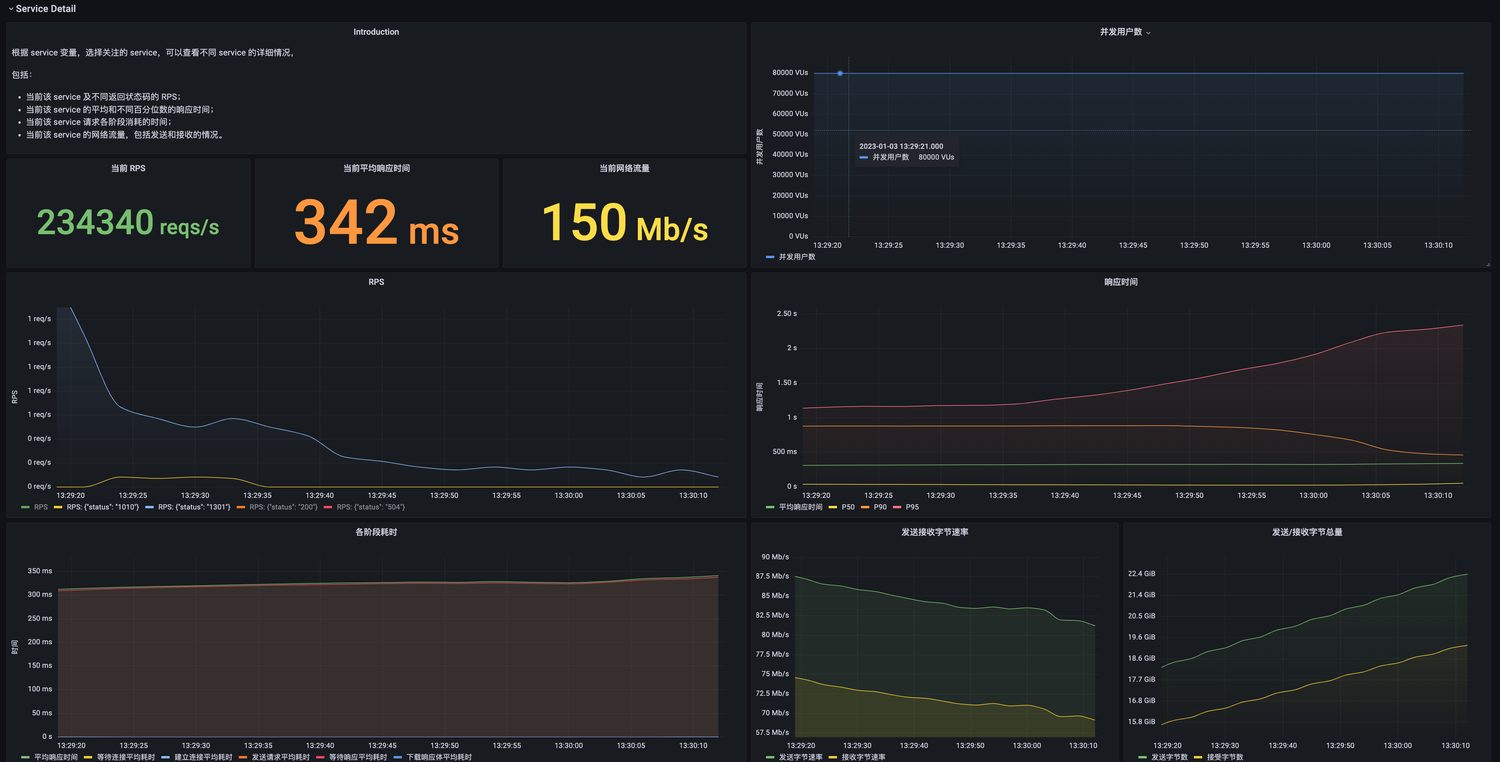
Service Detail 中,根据 service 变量选择关注的 service,并了解相关的细节,当变量值为 All 时即选中所有 service。
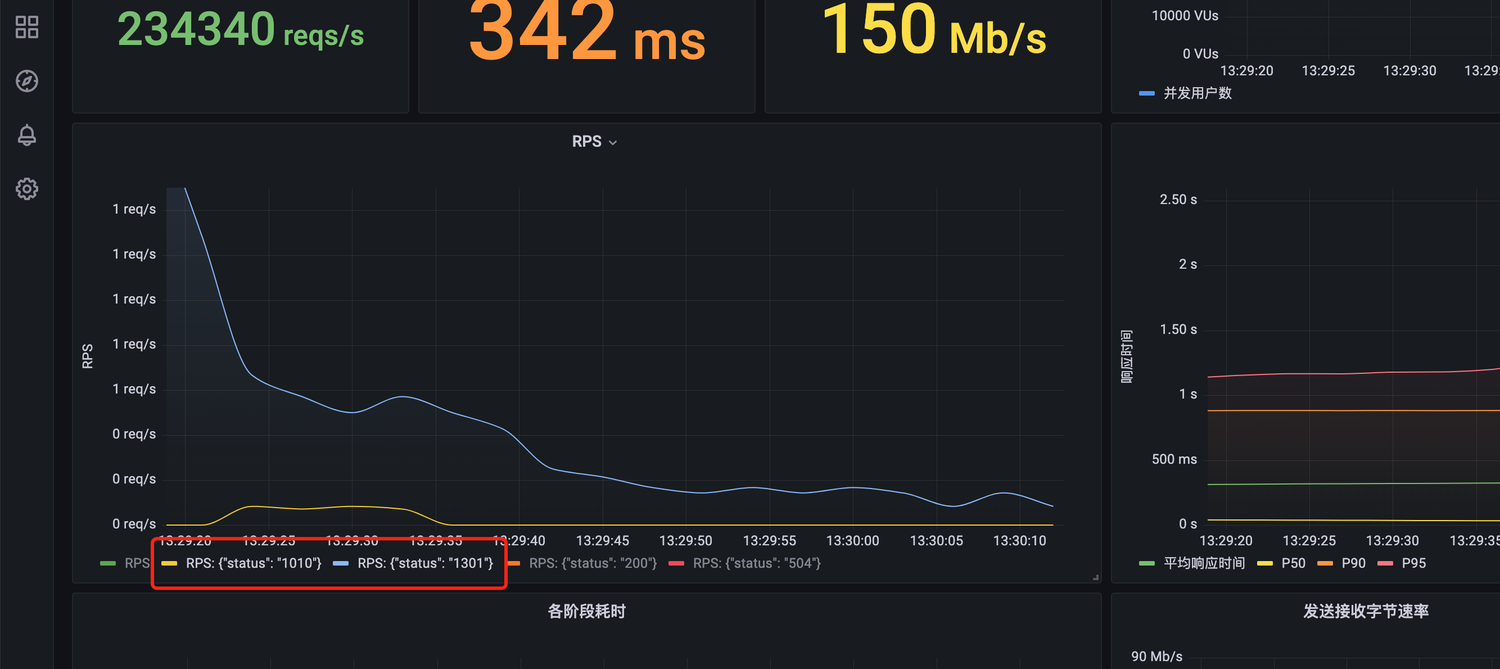
选择关注的 service,获得该 service 的信息,包括当前的瞬时量,例如 RPS、平均响应时间、网络流量等。
以及 RPS 和不同状态码、响应时间的不同百分位数、请求不同阶段的耗时、发送和接收的流量和速率等的时序曲线。
以 RPS 为例,如果想看某个状态码的曲线,单击下方图例即可;若要查看多条曲线,按住 ctrl 或 shift 再单击多个图例即可:
图表栏 Check Detail
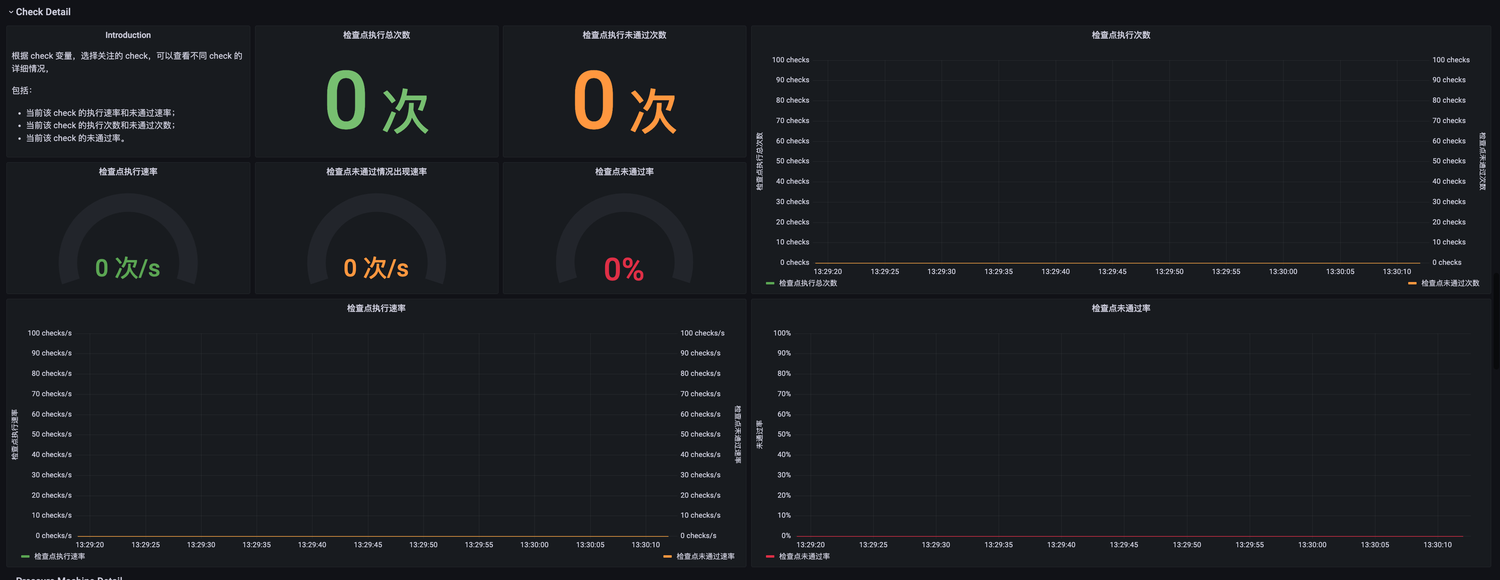
Check Detail 中,根据 check 变量选择关注的 check,并了解相关的细节,当变量值为 All 时即选中所有 check。
该栏中,包括了检查点当前的执行次数、执行速率、未通过次数、未通过速率和未通过率,以及其随时间变化的情况等信息。
图表栏 Pressure Machine Detail
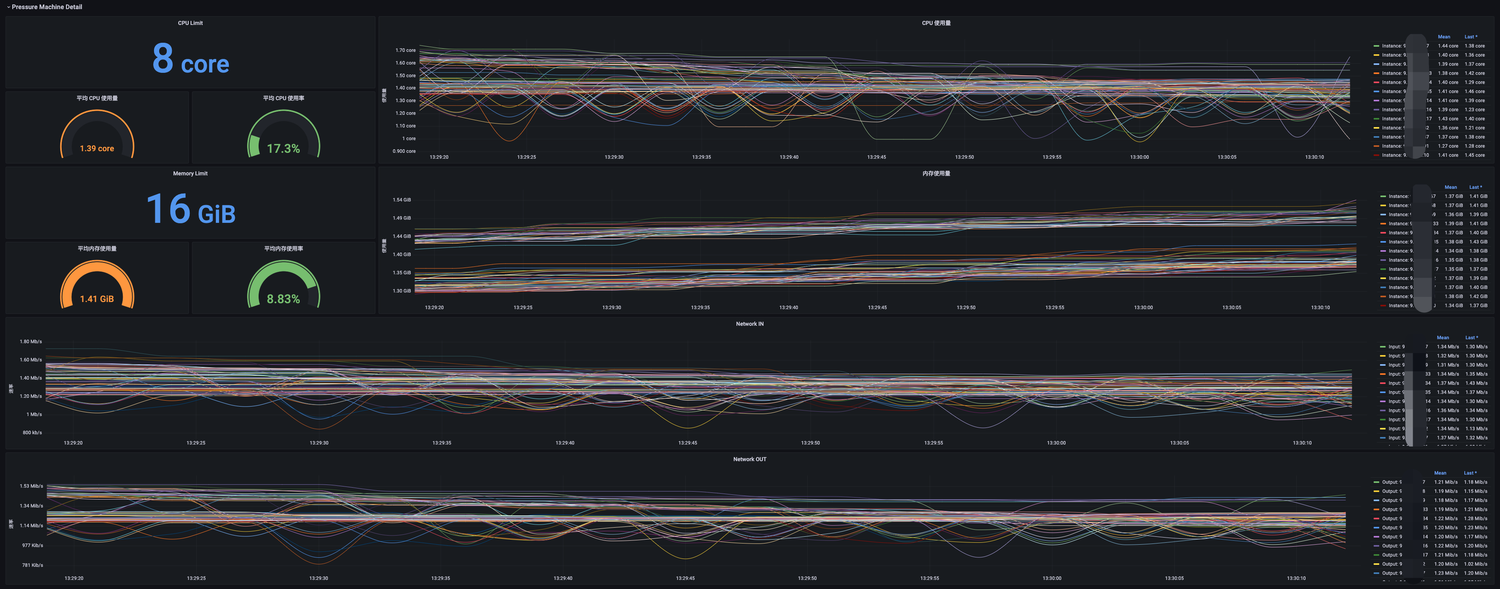
Pressure Machine Detail 中,可以看到压测任务执行所在的施压机器的情况,包括 CPU、内存限制和使用量等。
根据用户在压测场景中的配置,云压测会拉起不同配置和数量的 Pod 进行压测任务执行,通过施压机监控可以查看任务运行过程中 CPU 或内存的情况。
备注
如果您想要在此面板的基础上进行修改,可以复制该面板后进行自定义配置。
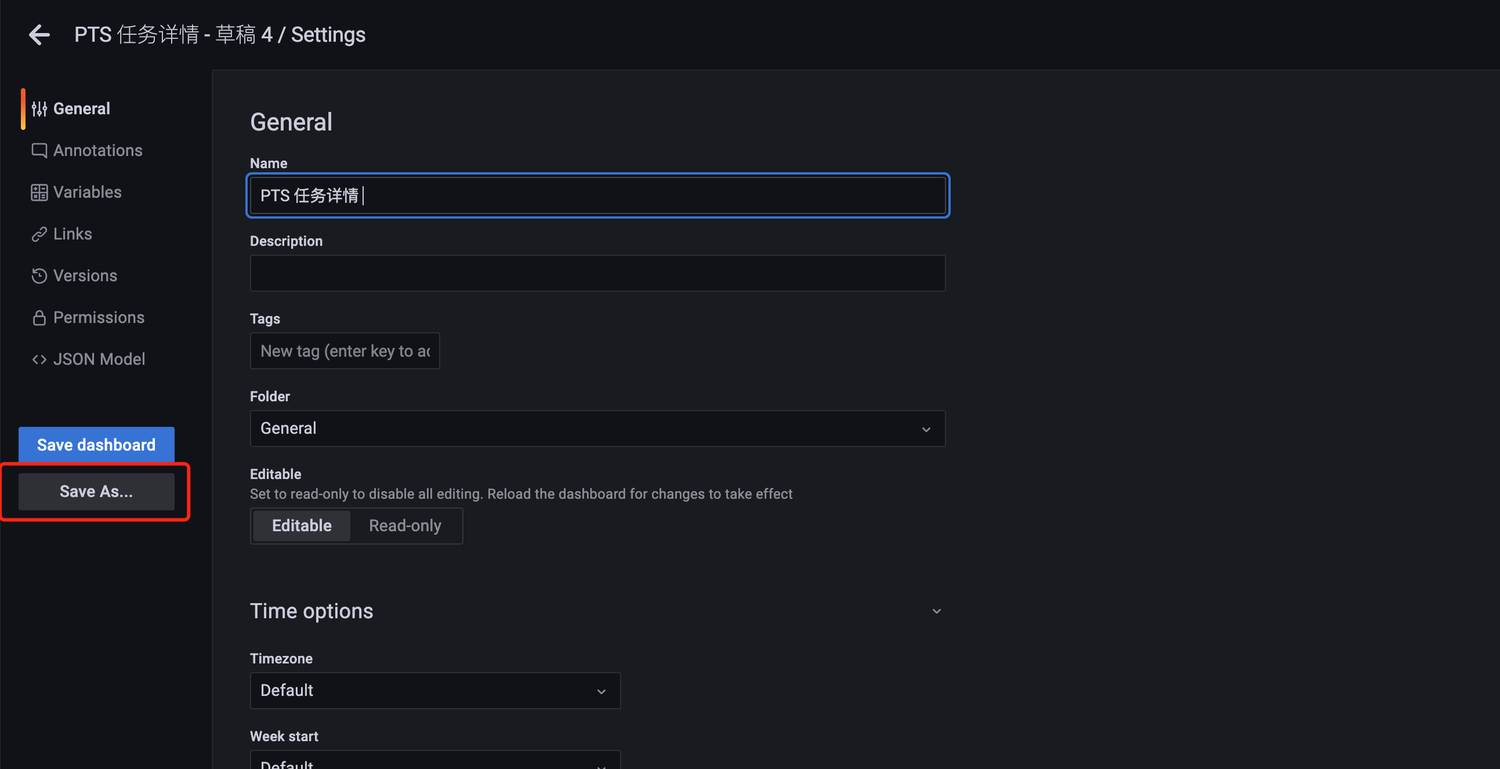
1. 单击设置符号。
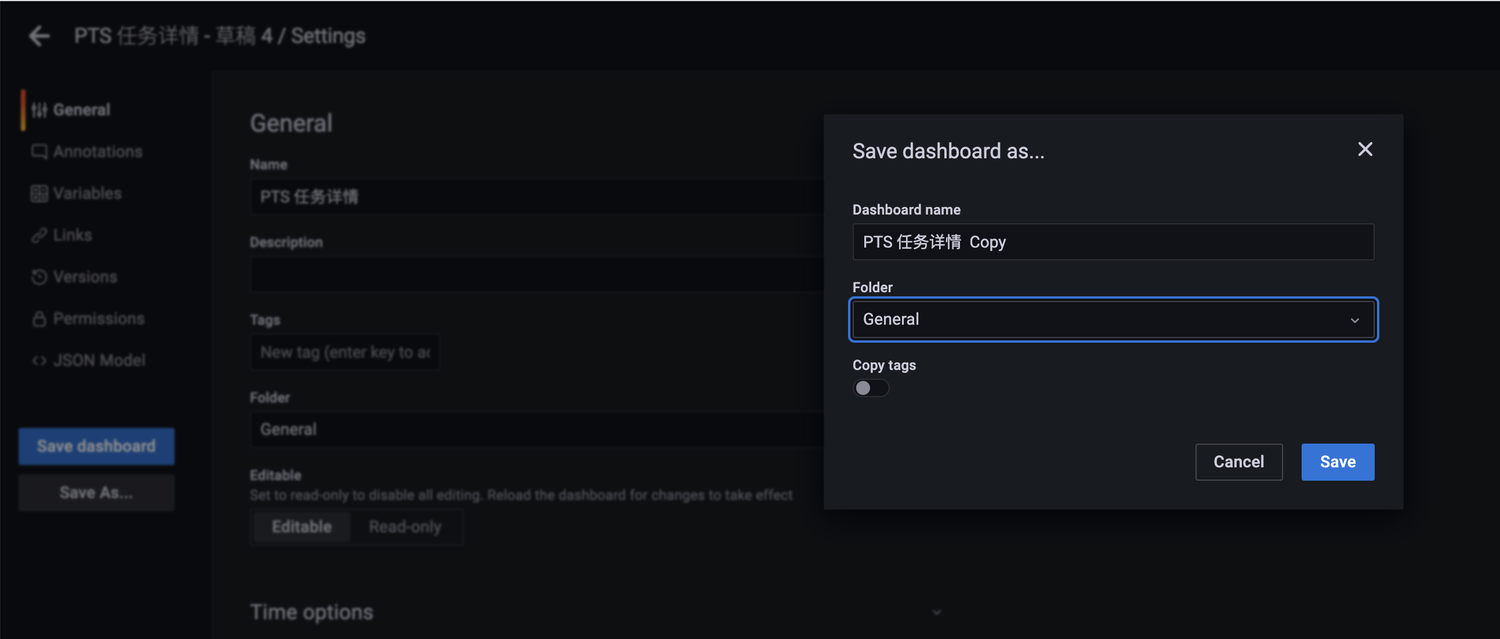
2. 单击 Save As...,设置并保存到想要的名称和目录。
3. 单击 Save 保存。
之后,Grafana 会跳转到复制后的 Dashboard 界面,该 Dashboard 即可以由用户自定义修改和删除。
压测指标查询
除了 Dashboard,Grafana 还支持通过 PromQL 语句进行临时的指标查询,通过自定义 PromQL 语句,来查询聚合出丰富的业务指标。
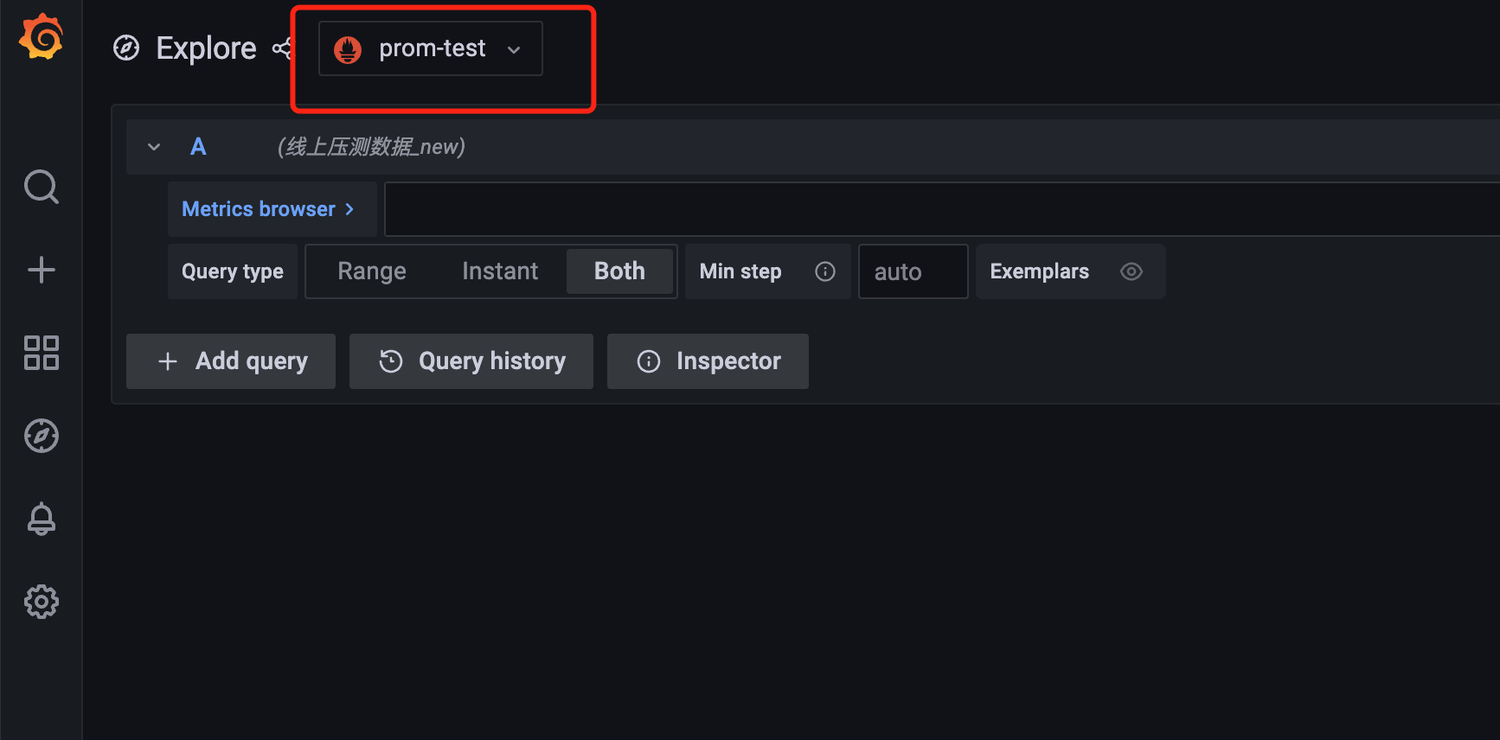
1. 在 Grafana 中单击 Explore。
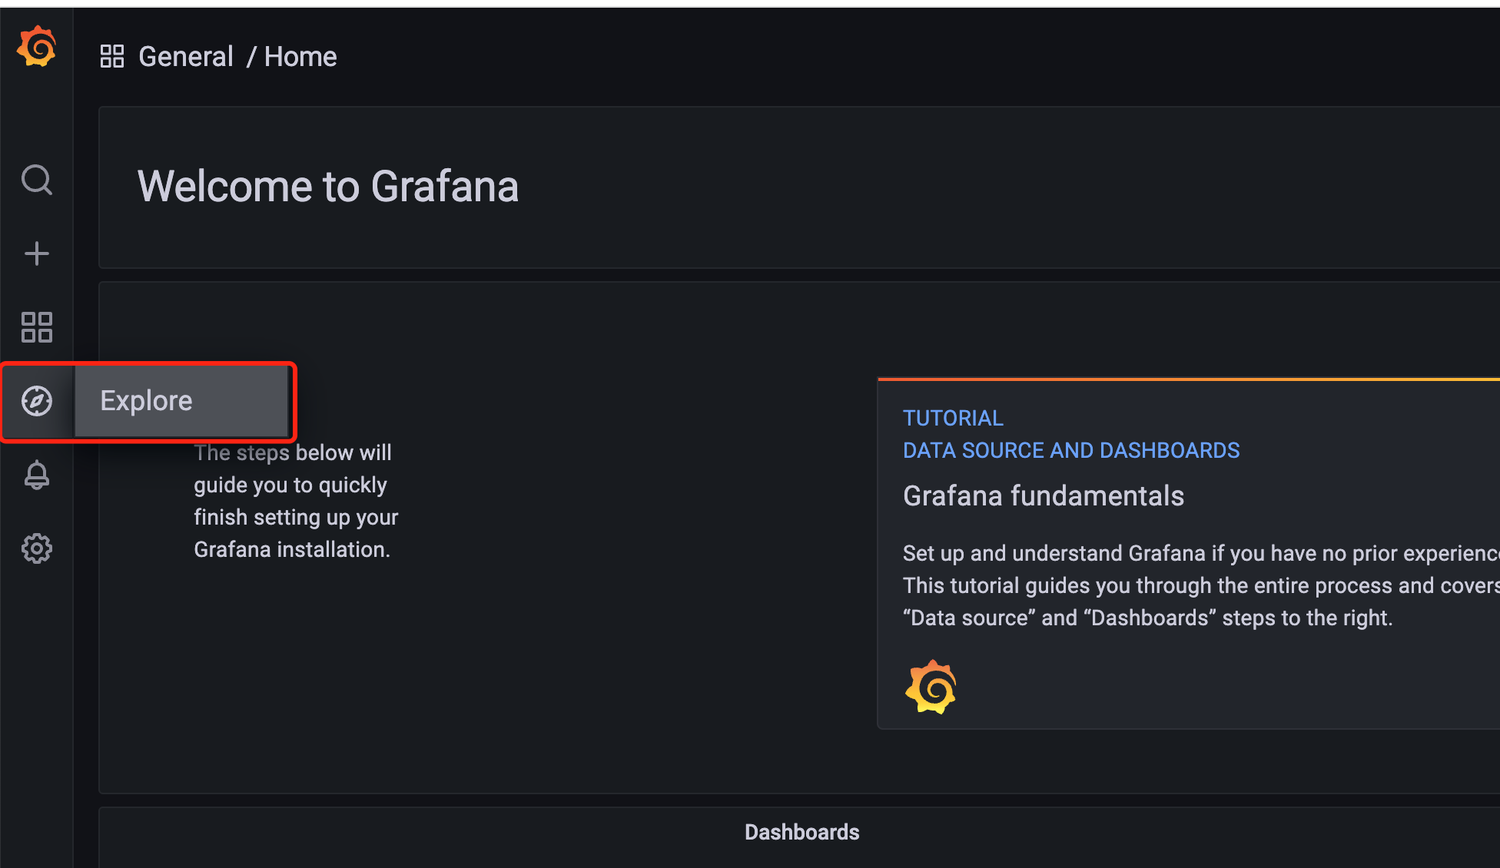
选择监控指标导入的 Prometheus 实例。
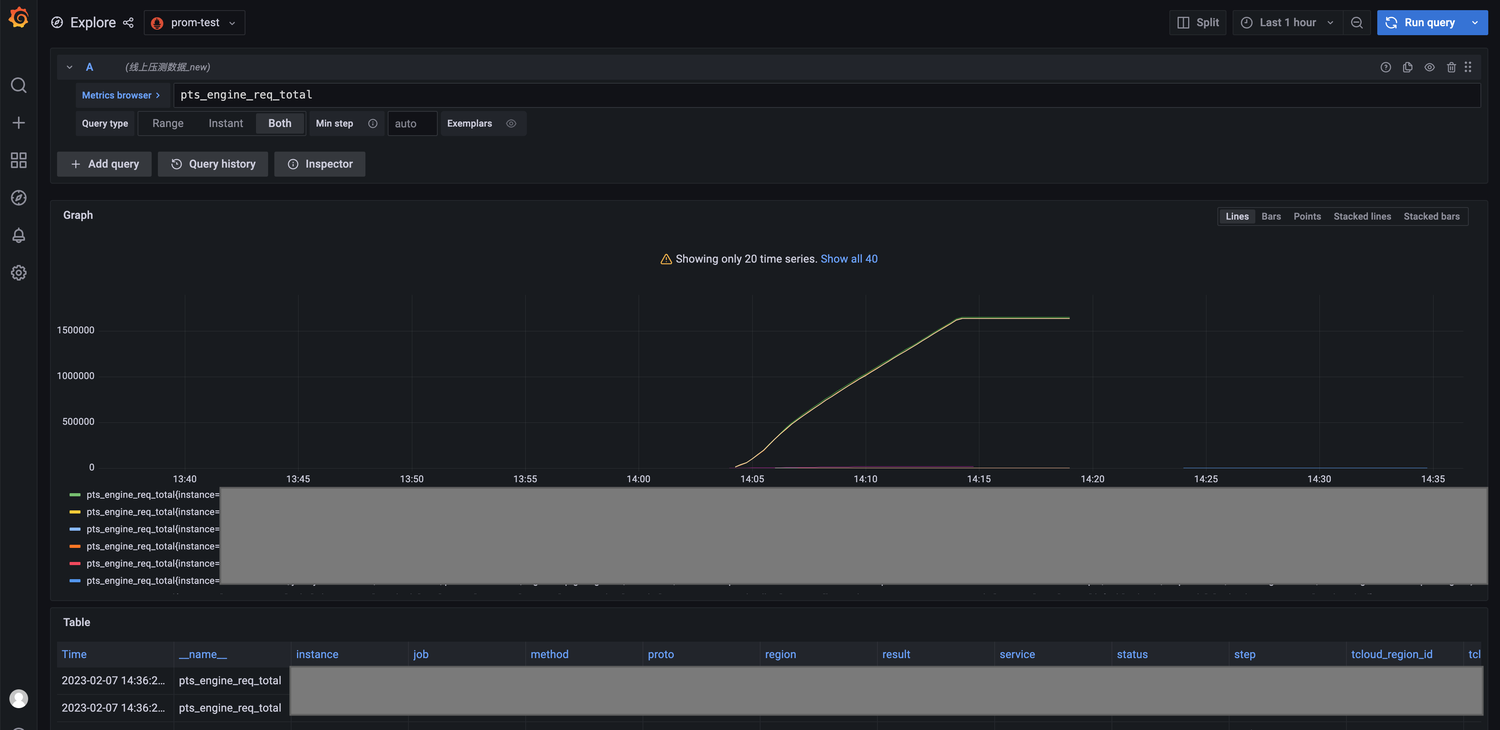
2. 输入想要查询的 PromQL 模式和语句即可,具体请参见 Grafana 官方文档。
文档反馈