Background
To minimize the application integration cost and reduce the impact of APM tools on the entire software development process, Tencent Cloud officially launched the tencent-opentelemetry-operator integration solution in May 2024, providing a simple and efficient way for multi-language applications deployed on Kubernetes to access APM.
Application Integration Solution Comparison
Manual Reporting Scheme
This is the most basic access method, requiring developers to explicitly call the APIs provided by the APM tool in the code to collect and report performance data. The advantage is high flexibility, allowing precise control over the data to be collected and the timing of collection; the disadvantage is that it requires modification of the application code, resulting in a significant workload.
Semi-Manual Reporting Scheme
In this scheme, developers still need to call the APIs provided by the APM tool in the code, but can simplify part of the work based on commonly used frameworks or libraries. For example, some APM tools provide libraries integrated with common development frameworks (such as Spring, Express, etc.), and developers only need to enable these libraries in the configuration file to automatically collect and report performance data.
Probe Solution
A probe is a method for automatic collection of performance data. It is a module running within the application process that can dynamically collect performance data while the application is running, without modifying the application code. The probe solution also provides integration with common development frameworks, enabling automatic collection and reporting of performance data. Compared to manual reporting schemes, deployment is simpler and can be introduced after the application is compiled, even achieving a perception-free experience throughout the entire development process.
Sidecar Solution
Sidecar is a module that runs outside the application process, typically in the form of a separate process or container. It can monitor the application's network communication and collect performance data. The advantage is that it does not require modification of the application code and has very little impact on application performance; the disadvantage is that the Sidecar solution deployment is complex, requiring management of additional processes or containers, and can only add value based on special application architectures such as Service Mesh (service mesh).
eBPF Solution
eBPF (Extended Berkeley Packet Filter) is a technology in the Linux kernel that can run user-defined programs in the kernel and collect various system and network performance data. APM tools using eBPF can provide very detailed and accurate performance data with minimal impact on application performance. For containerized applications that have been deployed to Kubernetes, the deployment of the eBPF solution is relatively simple, but like the Sidecar solution, it lacks mature distributed link tracking capabilities.
|
Manual Reporting | Extremely high | High | High | High |
Semi-manual Reporting | High | High | High | High |
Probe | Low | High. Suitable for most languages. | High | High |
Sidecar | Low | Low. Dependent on specific application architecture. | Low | High |
eBPF | Low | High comparison. Dependent on higher version kernel. | Medium | Low |
Overall, for the selection of APM solutions, the difficulty of integration is the primary consideration. If integrating an APM tool requires modifying business code, it will bring a heavy burden to the development team and will inevitably lead to difficulties in promotion within the team in the long run. This is also the main reason why many enterprises give up during the process of introducing APM tools. Therefore, we need to try to eliminate manual reporting solutions. Although the eBPF solution represents the future development direction of APM, its maturity level is still very low and there are significant shortcomings in feature coverage. Therefore, the probe solution is still the most mature and worthwhile choice at present, especially for programming languages such as Java and Python that run on virtual machines, which naturally have a high degree of compatibility with the probe solution.
Operator Solution
Tencent-opentelemetry-operator is built by Tencent Cloud based on the community opentelemetry-operator and is a probe-based integration solution. Since it implements an automatic probe injection mechanism in Kubernetes environments, it eliminates the workload of probe deployment and configuration, making application integration simpler. Currently, Tencent-opentelemetry-operator supports rapid integration of Java, Python, Node.js, and .NET applications. After an application is deployed to Tencent Cloud Container Service TKE, you only need to add 2 lines of annotations in the workload's YAML file to complete the entire integration process, without involving any code modifications in the development state.
Integration Advantages
Simplify Operator Installation Process: The installation and deployment process not only lists it on the TKE Application Market but also enables one-click installation of the Operator in the APM console.
Reduce Human Resource Through Packaging: A series of configuration items required during the integration process are packaged, eliminating the need for manual filling, including the address of the APM integration point, business system token, etc.
Optimize Certificate Management Mechanism: Resolves various compatibility issues that may arise during the Operator installation process.
Downgrade Processing: When any component of the APM platform fails, the entire integration mechanism is based on the premise of not affecting the normal operation of the business. When necessary, downgrade processing is performed on the probe injection and monitoring data reporting logic to ensure the stable operation of the business.
Integration Principle
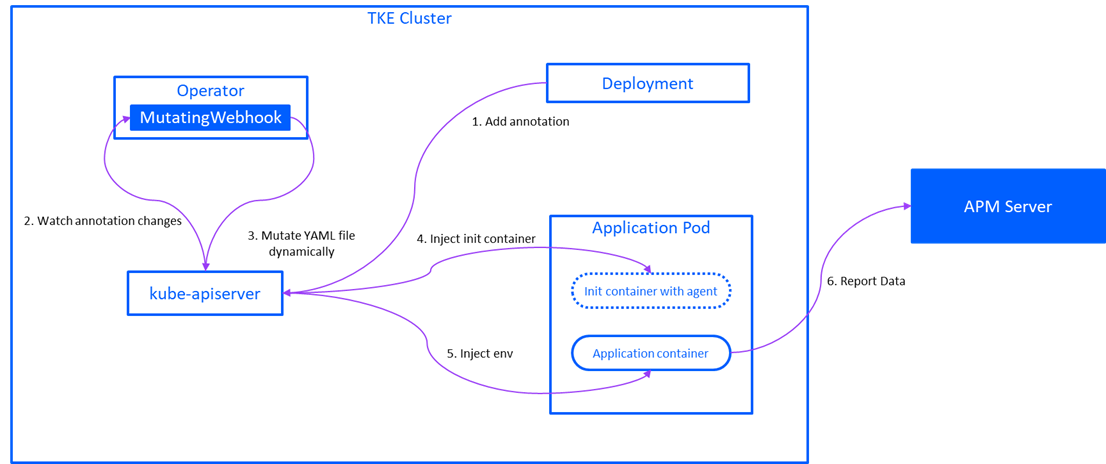
The Operator solution utilizes Kubernetes' Dynamic Admission Control mechanism to implement probe injection. You can refer to the following process to understand the integration principle of the Operator solution:
1. The user adds an annotation to the workload, and the API Server initiates an update of the workload based on its deployment strategy.
2. Among the related components of the Operator, there is a workload with Dynamic Admission Control capability, which runs in the form of a Mutating Webhook in the TKE cluster and can listen to changes in the workload from the API Server.
3. After the Operator listens to the application workload adding integration-related annotations, it will dynamically modify the application Pod to be created through the API Server, and the modified content is reflected in the Pod's YAML description.
4. The Operator injects an init container into the application Pod, which contains the agent file in its local path.
5. The Operator also injects some environment variables into the application container, which can be used to configure the application process to mount the agent. Taking Java applications as an example, the Operator adds the JAVA_TOOL_OPTIONS environment variable to the application container, which includes the -javaagent parameter, pointing to the local path of the agent file introduced by the init container, so that the Java process performs the mount agent operation when it starts.
6. The probe automatically collects monitoring data through bytecode enhancement mechanism and reports to the APM server.
Install Tencent-Opentelemetry-Operator
2. Select Application Performance Management > Application list in the left sidebar, and click Access application.
3. Select the programming language you want to integrate in the pop-up box, such as Java.
4. Go to access Java Application page, select Automatic onboarding of TKE environment as the reporting method, and then click Single Step Installation.
5. Enter the one-click installation Operator pop-up window, select the reporting region, default business system, TKE cluster and other information through the drop-down list, confirm and click Install.
Note:
The reporting region should be the same as the region where the APM business system is located. Each TKE cluster can only specify a unique reporting region, which is best consistent with the region where the TKE cluster is located.
6. After the installation is complete, go to Kubernetes Engine (TKE) Console, select Cluster Ops > Helm in the left sidebar, and enter the Application Management page to query the tencent-opentelemetry-operator application installed in the kube-system namespace. You can also check the installation status by executing the helm list command through the Helm client. Application Access
After the Operator is installed in the TKE cluster, thanks to the dynamic probe injection capability of the Operator solution, the application access process is extremely simple. You only need to edit the YAML file of the workload where the application is located and add 2 annotations in the Pod Template to complete the application access. Taking a Java application as an example, the content that needs to be added is as follows:
`cloud.tencent.com/inject-java: "true"` # Enable APM Integration
`cloud.tencent.com/otel-service-name: my-app` # Specify the application name
Among them, the `otel-service-name` field represents the application name. Multiple processes that use the same application name to connect will appear as multiple instances under the same application in APM. The complete workload YAML file can refer to the following code snippet:
apiVersion: apps/v1
kind: Deployment
metadata:
labels:
k8s-app: my-app
name: my-app
namespace: default
spec:
selector:
matchLabels:
k8s-app: my-app
template:
metadata:
labels:
k8s-app: my-app
annotations:
`cloud.tencent.com/inject-java: "true"` # Integrate with APM
`cloud.tencent.com/otel-service-name: my-app` # Specify the application name
spec:
containers:
image: my-app:0.1
name: my-app
After adding annotations, update the workload based on different deployment strategies, triggering the recreation of application Pods. Newly launched Pods will automatically inject probes and connect to the APM server, submitting monitoring data to the default business system of the Operator. Go to TCOP Console, and in APM > Application list, you can query the newly integrated applications. For more application integration guides, please refer to the following help documentation:
Custom Event Tracking
Based on the probe access solution, the Operator mode further simplifies the process of application access to APM through probe injection. The probes injected by tencent-opentelemetry-operator come from the OpenTelemetry ecosystem and achieve runtime automatic instrumentation for mainstream development frameworks and class libraries. For most users, after the application is successfully connected, monitoring data reporting can be completed and distributed tracing can be achieved without modifying any code. However, in some special scenarios, if the automatic instrumentation mechanism of the probe cannot meet user needs, users can introduce the OpenTelemetry API. On the basis of automatic instrumentation, custom event tracking can be added by modifying the application code. For example, in the following scenarios, custom event tracking may need to be introduced:
The development frameworks and class libraries introduced into the application are not widely used among developers, or the versions are very low.
The development frameworks and class libraries introduced into the application are either encapsulated by the user or come from closed-source commercial custom development.
For some core custom methods, it is necessary to add method-level event tracking in the request link.
For the probes injected by tencent-opentelemetry-operator, you can refer to Components and Frameworks Supported by OpenTelemetry Solution to understand the scope of automatic event tracking. The specific way to write custom event tracking code can be referred to in the following official documentation of OpenTelemetry: Taking Java language as an example, if we need to add method-level event tracking to a certain custom method in the request link, we can refer to the following steps to implement it.
1. Introduce OpenTelemetry API dependency:
<dependencies>
<!-- Other Dependencies -->
<dependency>
<groupId>io.opentelemetry</groupId>
<artifactId>opentelemetry-api</artifactId>
</dependency>
</dependencies>
<dependencyManagement>
<dependencies>
<dependency>
<groupId>io.opentelemetry</groupId>
<artifactId>opentelemetry-bom</artifactId>
<version>1.9.0</version>
<type>pom</type>
<scope>import</scope>
</dependency>
</dependencies>
</dependencyManagement>
2. Add method-level event tracking for doTask() in the request link through the following code.
import io.opentelemetry.api.trace.Span;
import io.opentelemetry.api.trace.StatusCode;
import io.opentelemetry.api.trace.Tracer;
import io.opentelemetry.context.Scope;
public void doTask(Tracer tracer) {
Span span = tracer.spanBuilder("doTask").startSpan();
span.setAttribute("RequestId", "5fc92ff1-8ca8-45f4-8013-24b4b5257666");
try (Scope scope = span.makeCurrent()) {
doSubTask1();
doSubTask2();
} catch (Throwable t) {
span.recordException(t);
span.setStatus(StatusCode.ERROR);
throw t;
} finally {
span.end();
}
}
3. Go to TCOP Console, in APM > Distributed tracing, find the relevant call chain, click on Span ID, and then in the Trace details page, you can see the newly added Span through custom event tracking. Summary
Tencent Cloud Application Performance Monitoring (APM) provides businesses with a comprehensive, efficient, user-friendly, and low-cost application performance management solution, helping enterprises optimize the performance of their applications. The newly released Operator scheme reduces access costs and shifts the decision point for accessing APM tools from the development status to the deployment status. Users no longer need to introduce APM-related SDKs into their code or package agent files into container images. This achieves zero intrusion into application development and is of great significance for promoting APM tools across the entire team.