Instance Operation and Maintenance is the operation page for instance snapshots generated by computing tasks based on scheduling policies and event listening. Through this page's features, you can view and manage Cycle instances and event instances. Maintenance is carried out through a series of operations to ensure that data processing and operation processes are stable, effective, and reliable.
Enter the Ops Page
2. Click Project List in the left directory tree.
3. Select the corresponding project and click to enter the Data Development module.
4. In the left directory tree, click Instance Ops.
Cycle Instance List
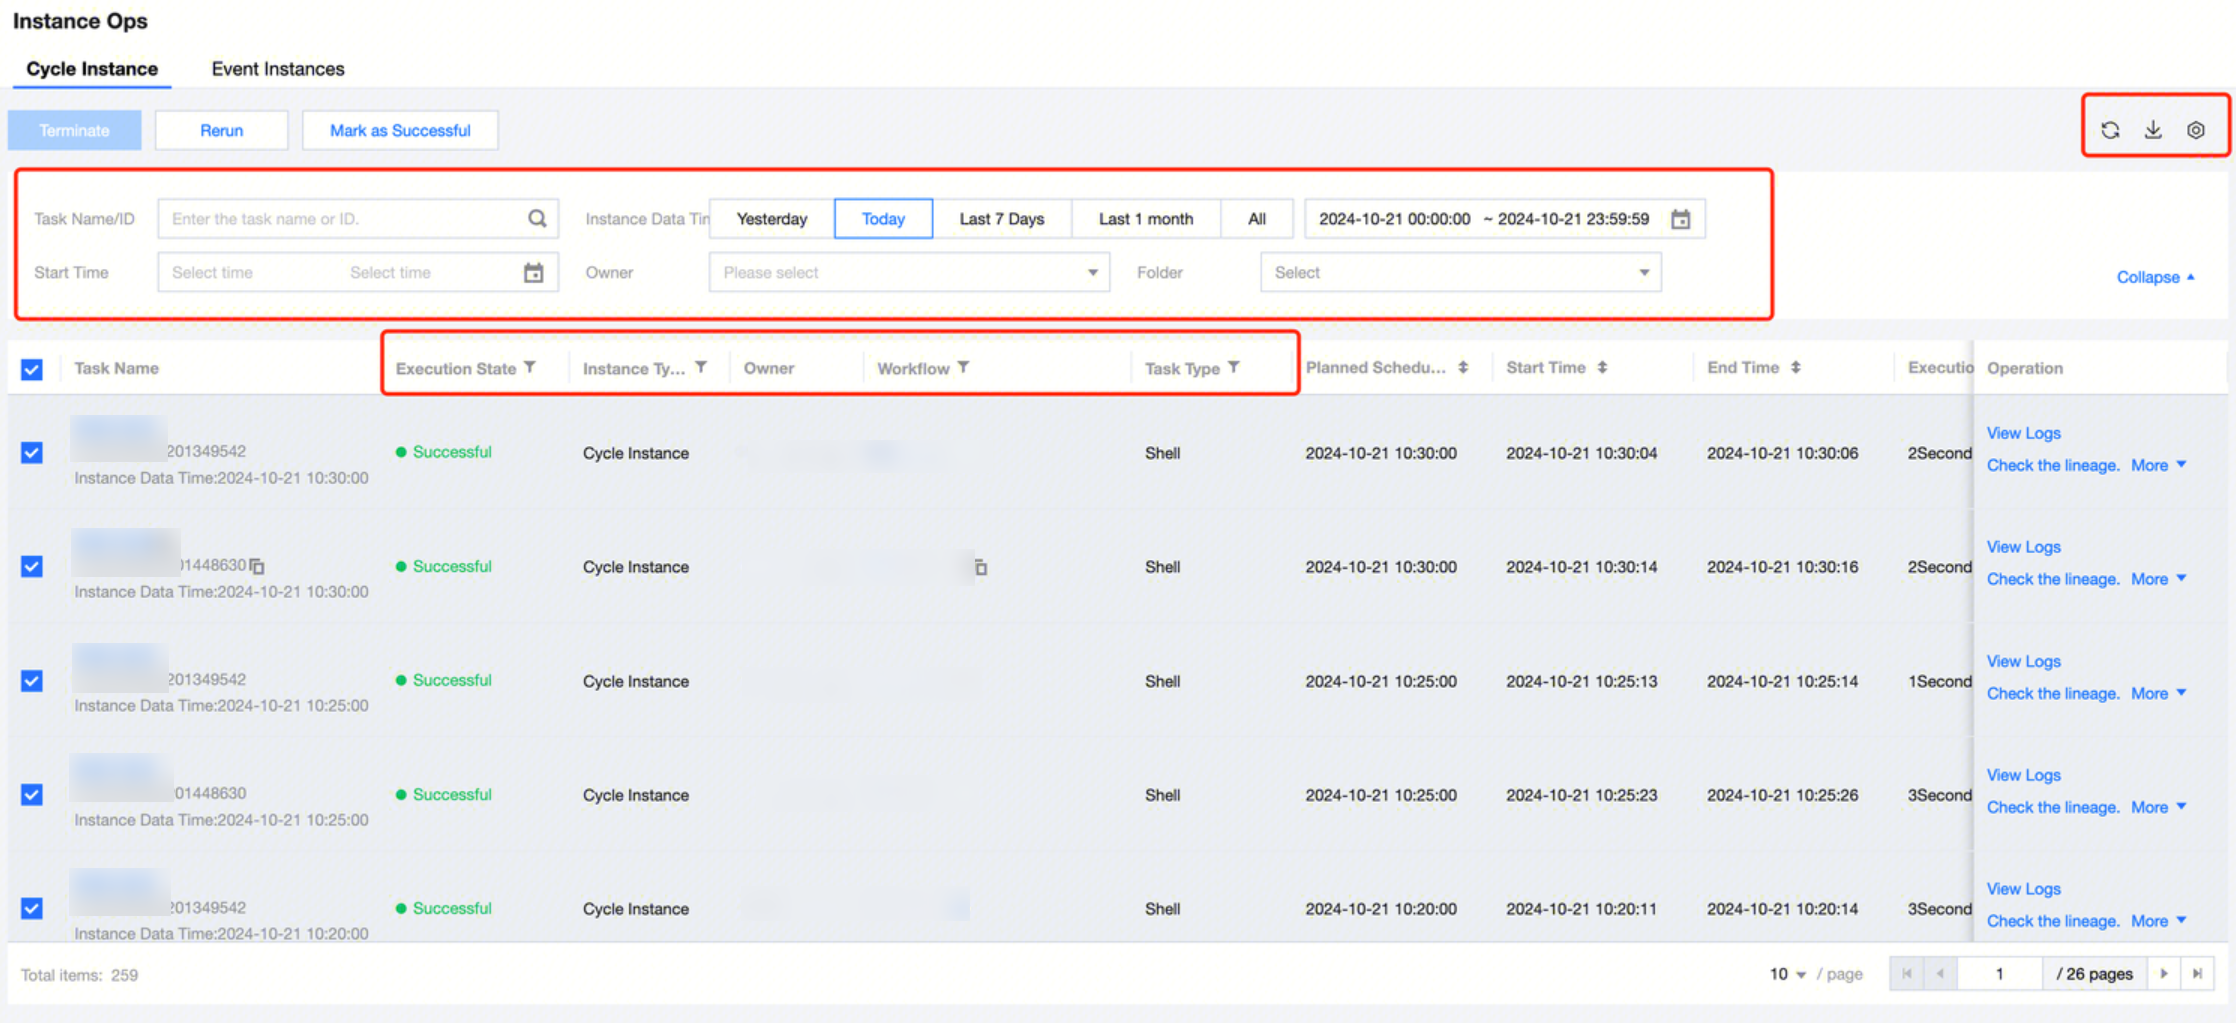
The Cycle Instance page displays detailed information and operation features for instances generated by computing tasks through scheduling policies. You can view the instance running status, logs, and upstream and downstream relationships of parent-child instances. You can also perform operations such as rerun, terminate, and set successfully.The system currently retains instances for only 3 months; instances older than 3 months will be automatically cleaned up.
Cycle Instance List Information
Feature Description:
|
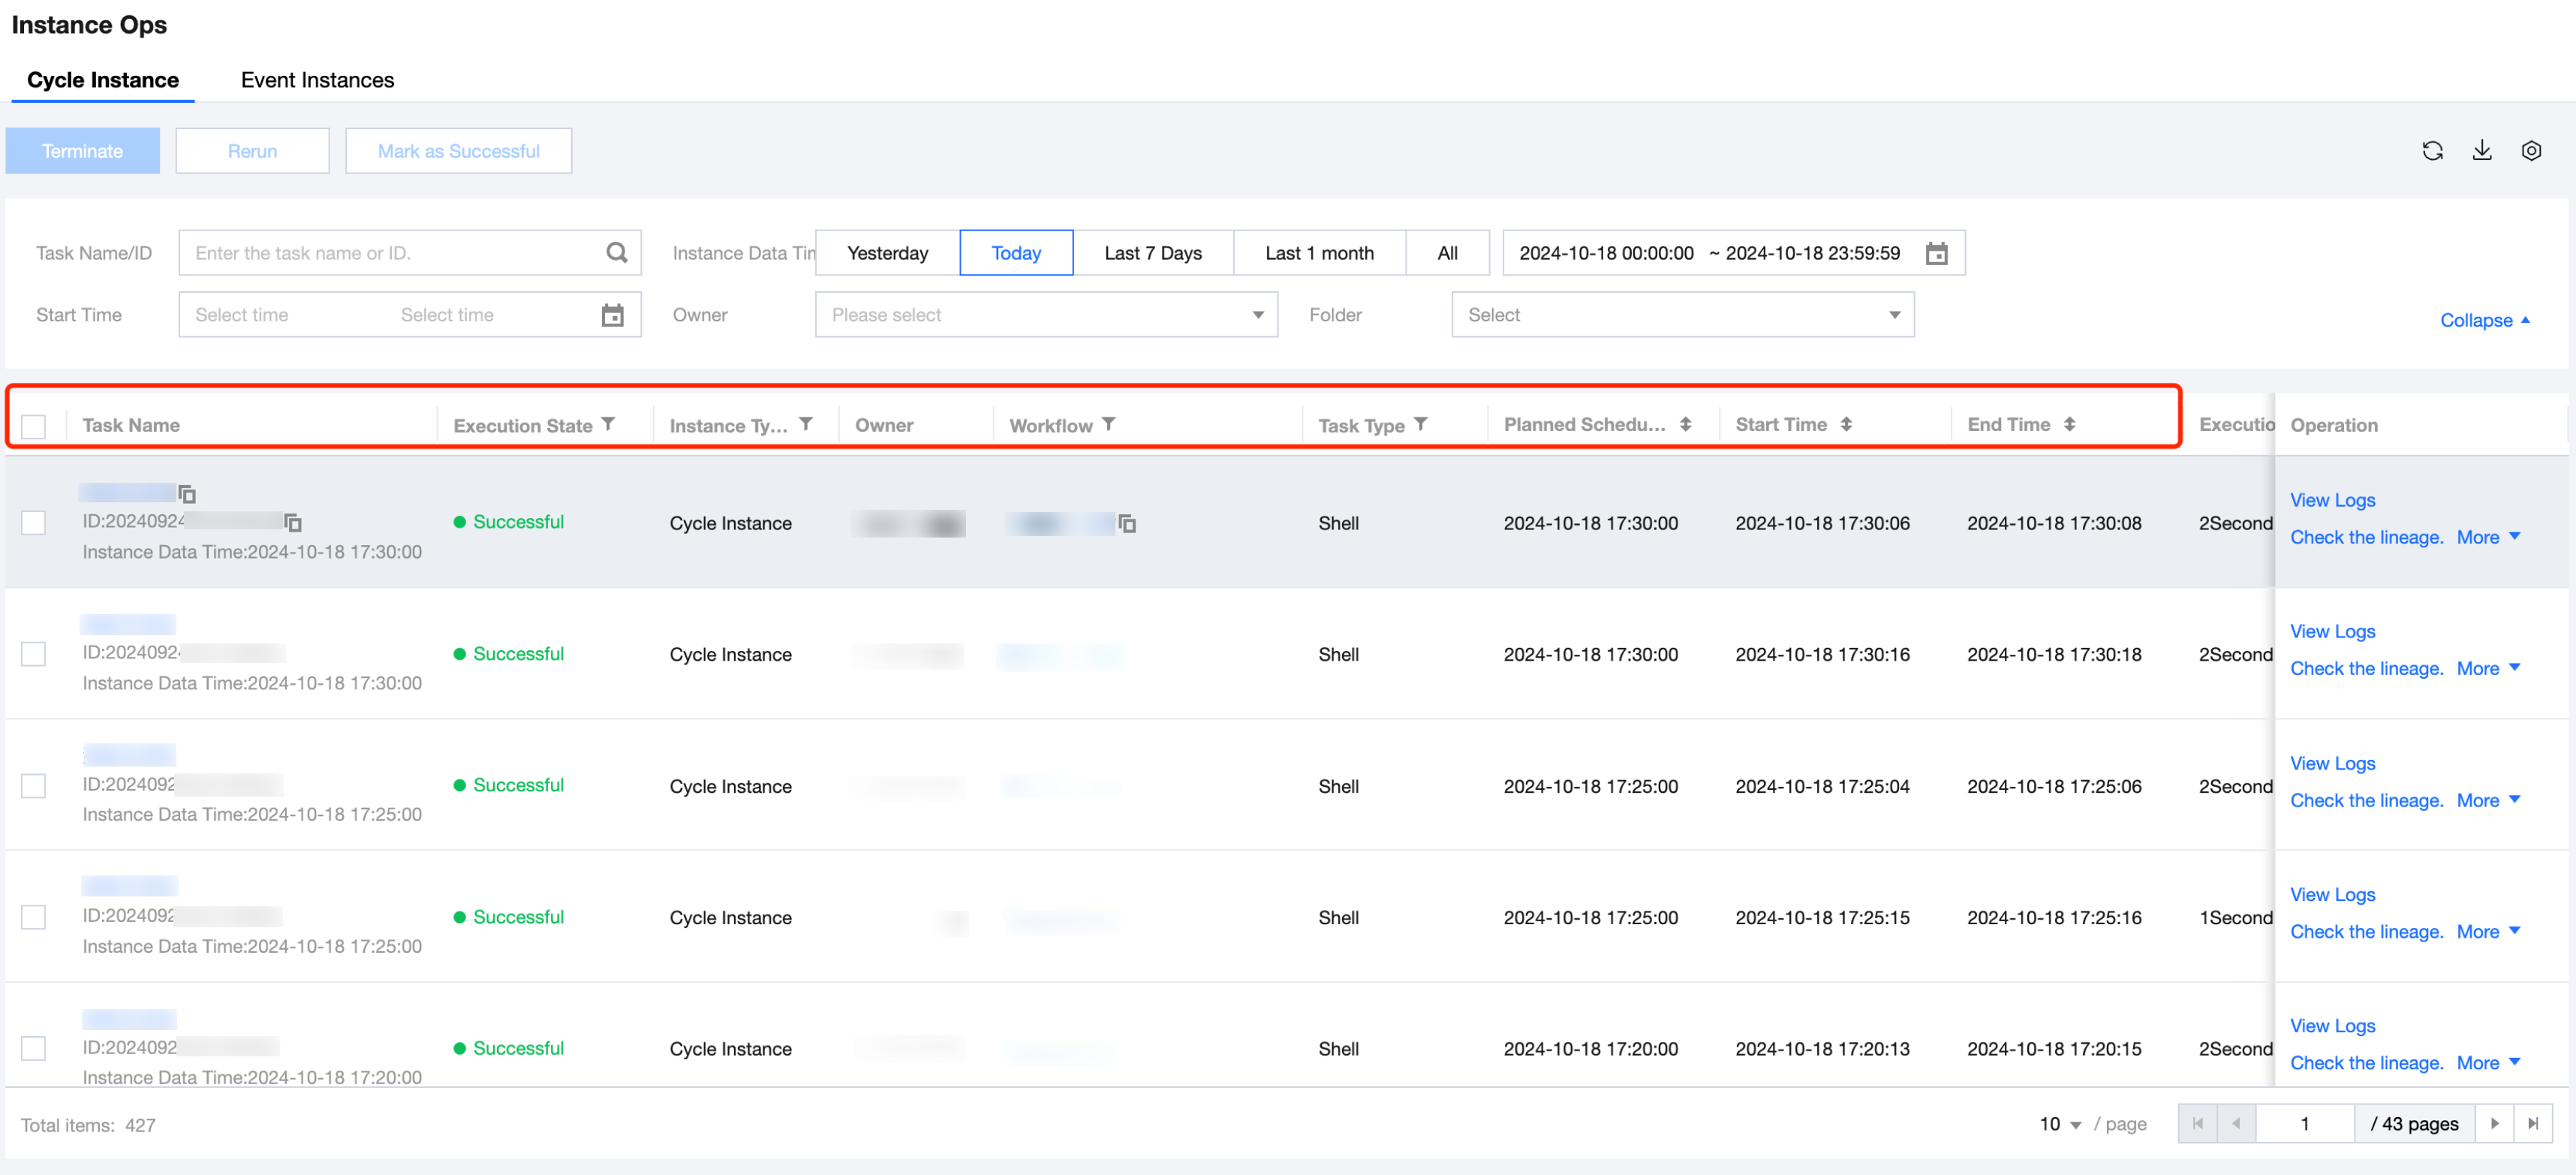
Task Name | Task Name: Click to navigate to the instance detail page - instance lineage, supports copy. Task ID: Used for backend log queries, troubleshooting problems, etc., supports copy. Instance Data Time: Displays the task's data time. Task name + instance data time can uniquely identify an instance. |
Execution Statue | Running Status of Periodic Instances, which is convenient for identifying faults, issues, and other abnormal conditions. Waiting for Event: The computing task to which the instance belongs has configured event listening. The instance will run normally when the event is triggered. Waiting for Upstream: The computing task to which the instance belongs has upstream dependency tasks in the workflow orchestration process. The current instance task will run normally after the upstream computing tasks generate instances and run successfully. Pending Execution: Waiting for scheduling resources or exceeding scheduling concurrency, waiting to be deployed to the execution machine. The instance is in the preparation phase for execution when first generated and will move to the next phase shortly. Running: The instance is in the running phase. You can view the operation process in real-time through logs. Terminating: Tasks in waiting, pending upstream, waiting to run, or running states can be terminated using the terminate feature. Failure Retry: When an instance fails, it will execute again according to the failure retry configuration in the computing task scheduling strategy. Failed: Task instance failed to run. Success: Task instance ran successfully. The execution status column provides diagnostic information and error codes Diagnostic Information: Offers diagnostic details, possible causes, and operational guidance to help users quickly locate and resolve issues when an instance encounters an exception. Error Code: Provides error codes and messages. If the problem cannot be located, the error code can be copied to seek assistance from the platform's support team. |
Instance Type | Displays the instance type according to the scheduling strategy of generated cycle instances. Periodic Instance: A computing task instance generated by a periodic scheduling strategy, such as tasks generated by daily, weekly, monthly, hourly, or minute-based schedules. Non-periodic Instance: A one-time computing task instance. Replenishment Instance: Task instances generated through data backfill. |
Owner | Displays the owner of the cycle instance, clarifying the maintenance responsibility of the computing task instance, defaulting to the creator of the computing task. |
Workflow Directory | Displays the name of the workflow to which the cycle instance's computing task belongs in the orchestration space, facilitating the identification and unified management of instances. Clicking on the workflow name will redirect to the respective task's workflow configuration page. |
Task type | Displays the type of computing task to which the cycle instance belongs. |
Planned Scheduling Time | Scheduling cycle for cycle instances. |
Start Time | Execution start time for cycle instances after generation. Format: yyyy-MM-dd HH:mm:ss. |
End Time | End time of the cycle instance's execution. Format: yyyy-MM-dd HH:mm:ss. |
Execution Duration | Execution duration from start to end time after the cycle instance runs. |
Execution Resource Group | Execution resource group used by the cycle instance. |
Retries | In periodic scheduling, supplemental entry or each rerun will count from 0. If the task does not successfully run after exceeding the set retry attempts, it will fail. "Number of Retry Attempts on Failure" is set in Task Scheduling Settings>Advanced Settings>Number of Retry Attempts, with a default value of 5. |
Accumulative Running Times | Sum of execution counts for the instance's periodic scheduling, supplemental entry, and each rerun. |
Folder | Displays the parent folder directory of the computing task to which the cycle instance belongs in the orchestration space, facilitating the identification and unified management of computational task instances. |
Cycle Type | Displays the scheduling period for the computing task to which the cycle instance belongs. |
Periodic Instance Operation and Maintenance
Feature Description:
|
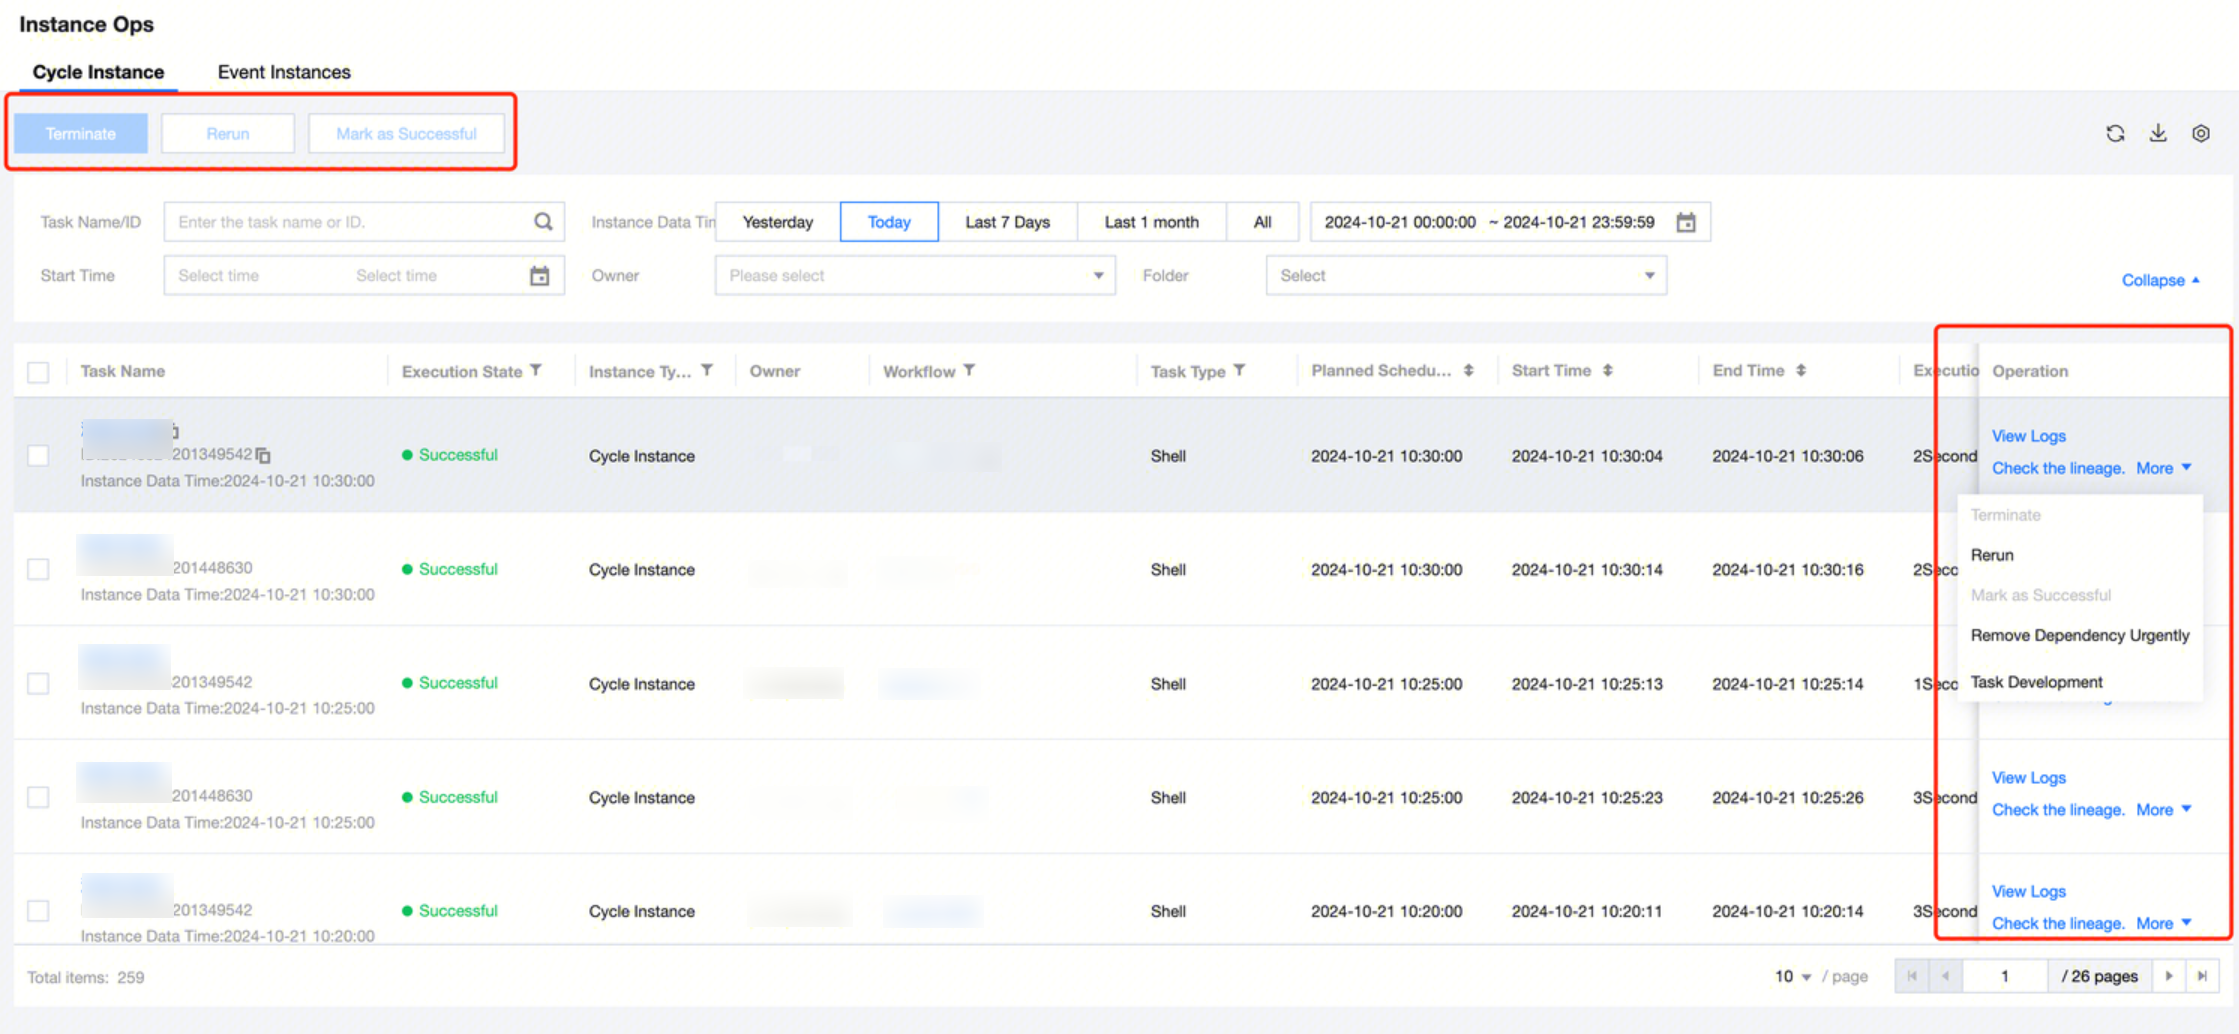
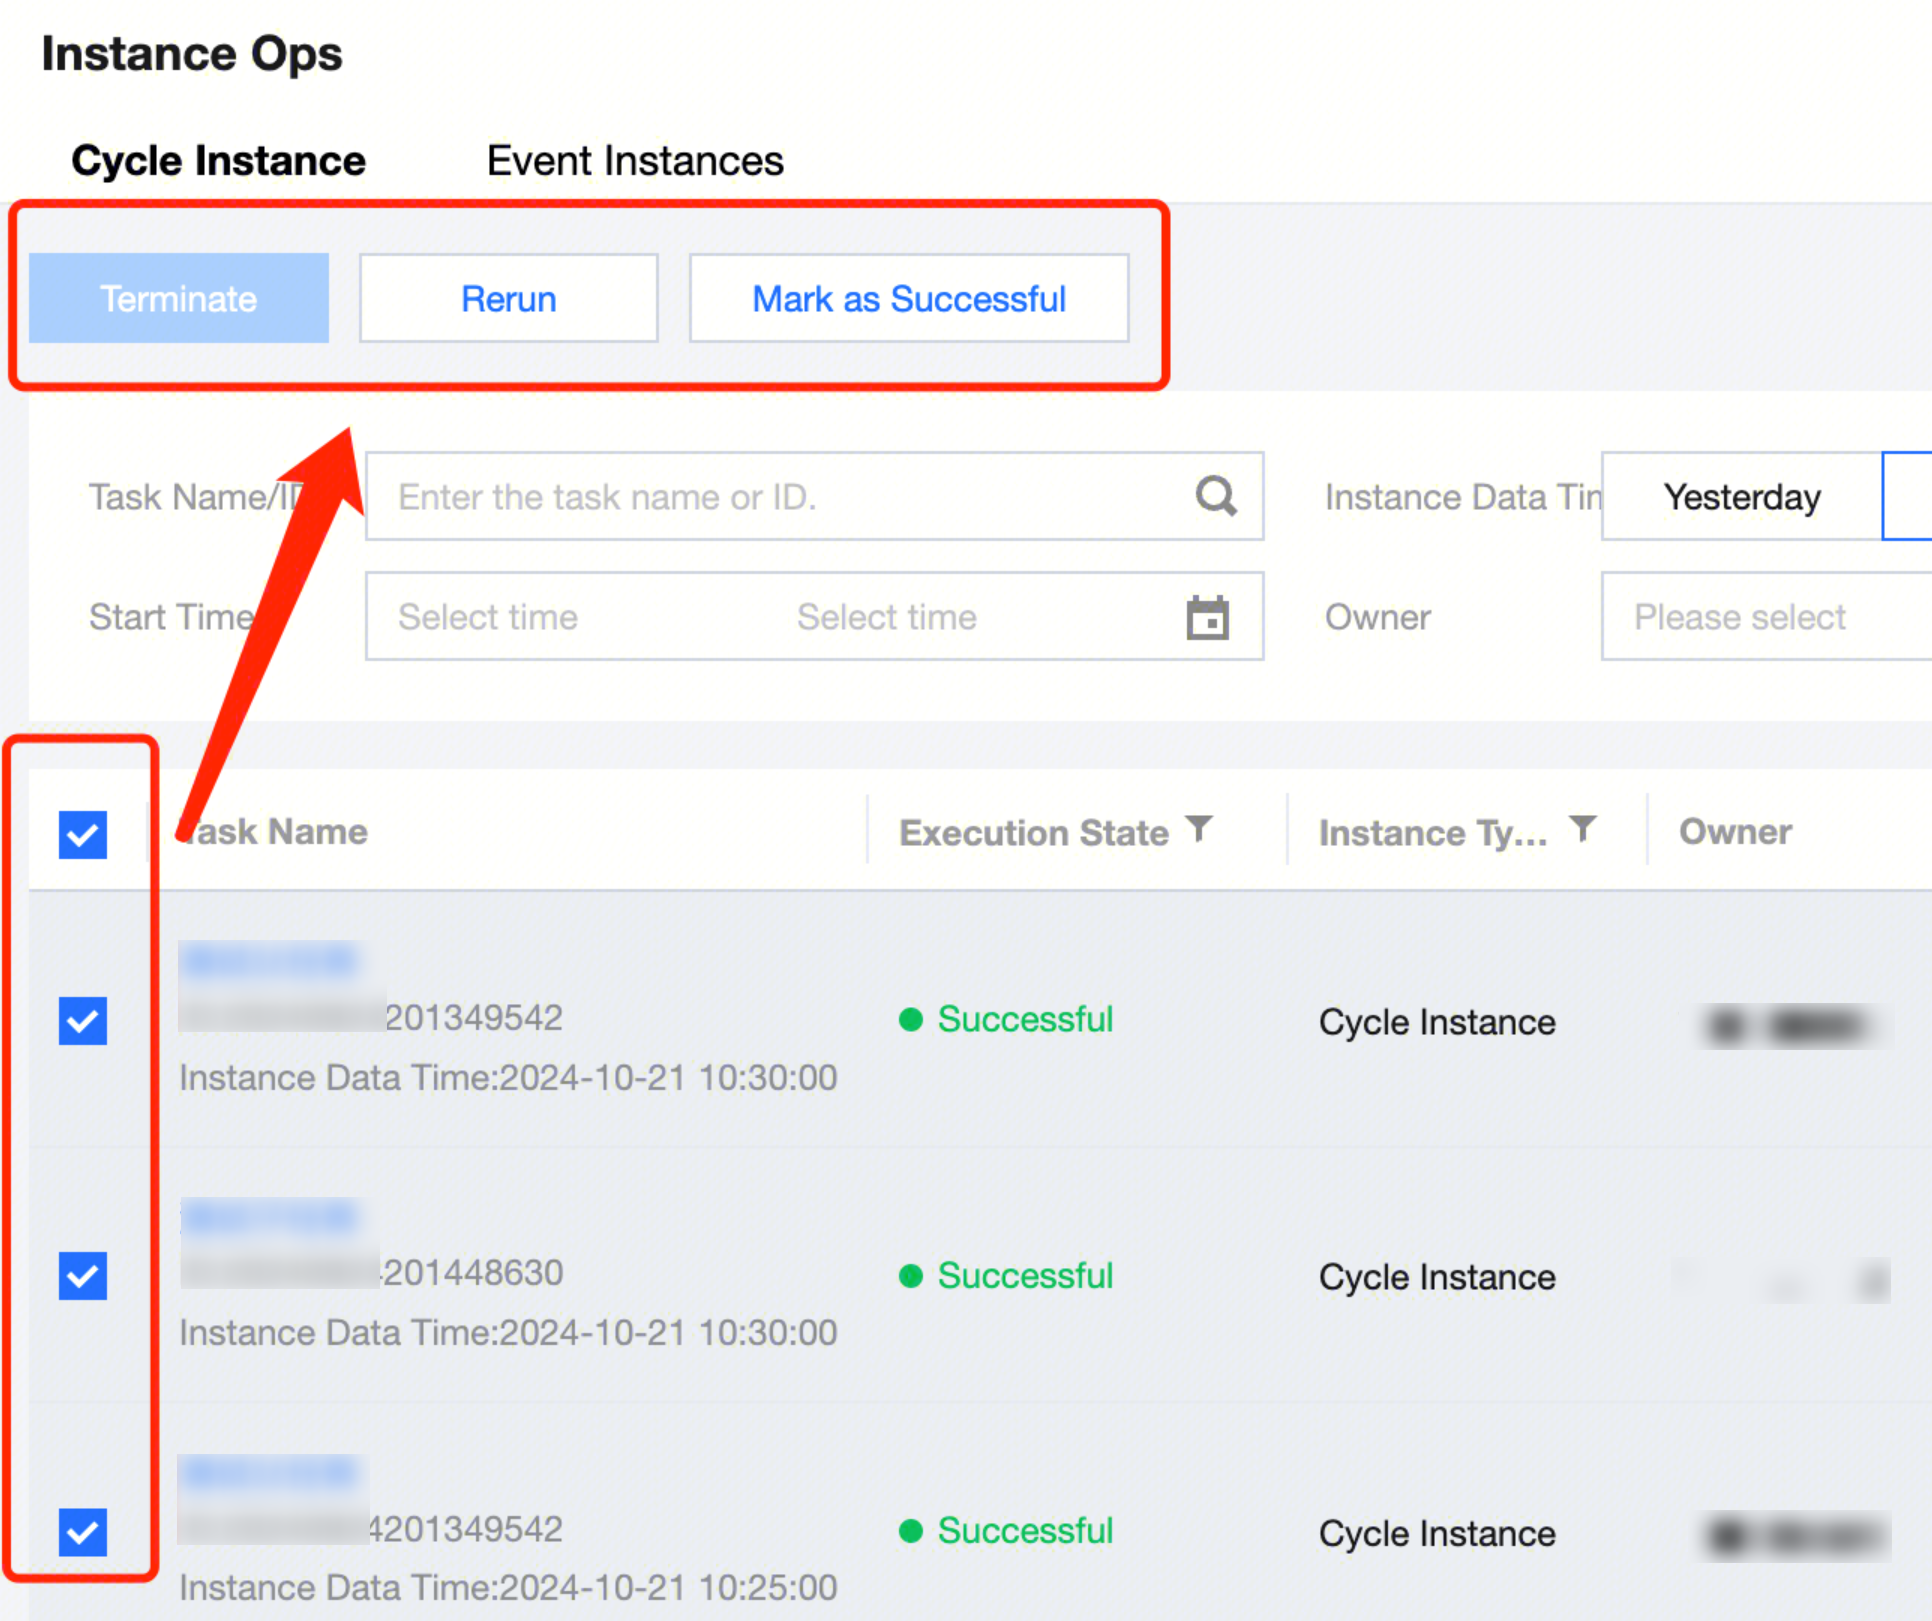
Batch Operation | Select in front of the task name and use the feature button above to batch terminate, rerun, or set the selected cycle instance execution as successful. |
|
|
|
|
|
|
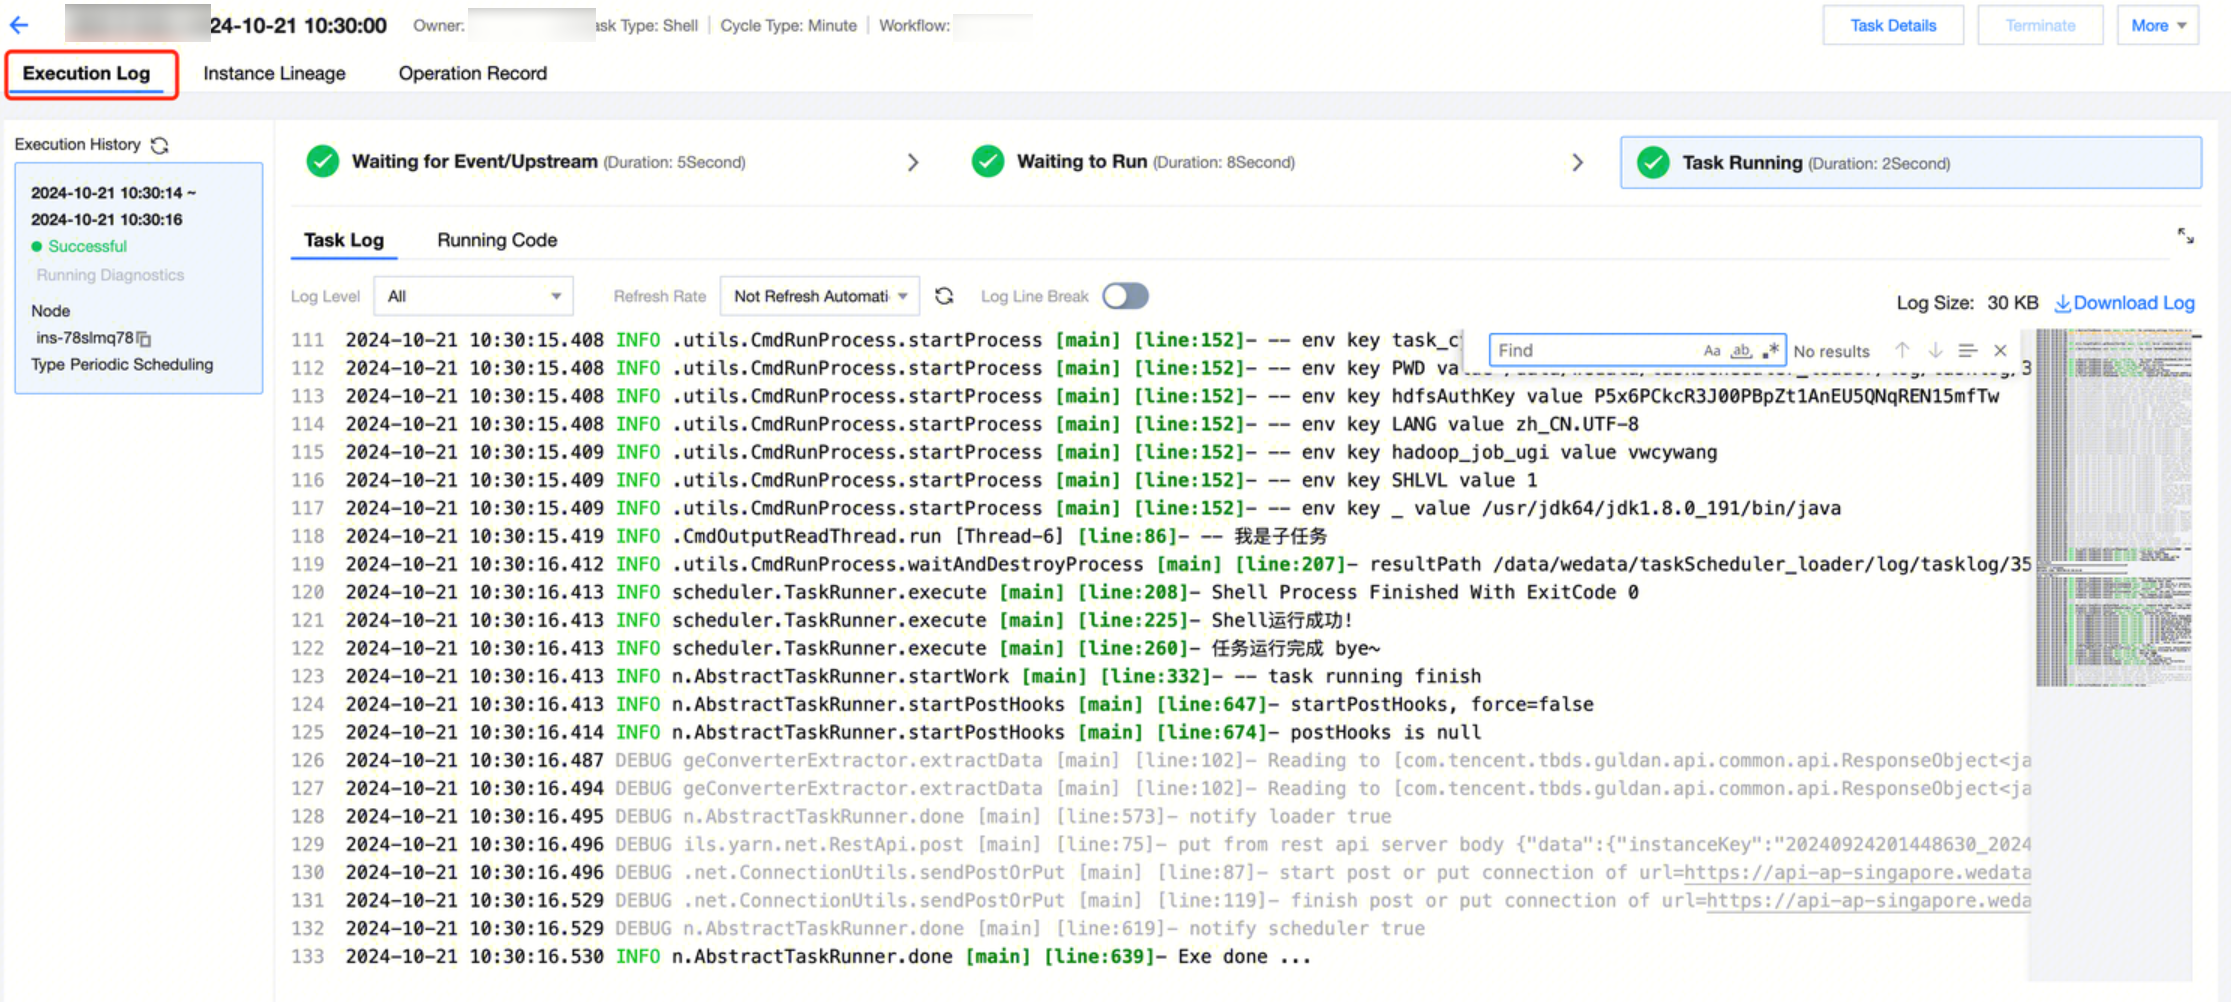
Viewing Logs | Jump to instance details page > execution log. You can view the entire process of each execution after the instance is generated, including waiting for events/upstream, pending execution, start time, end time, time consumption, specific situation, execution log, execute code, and other information. |
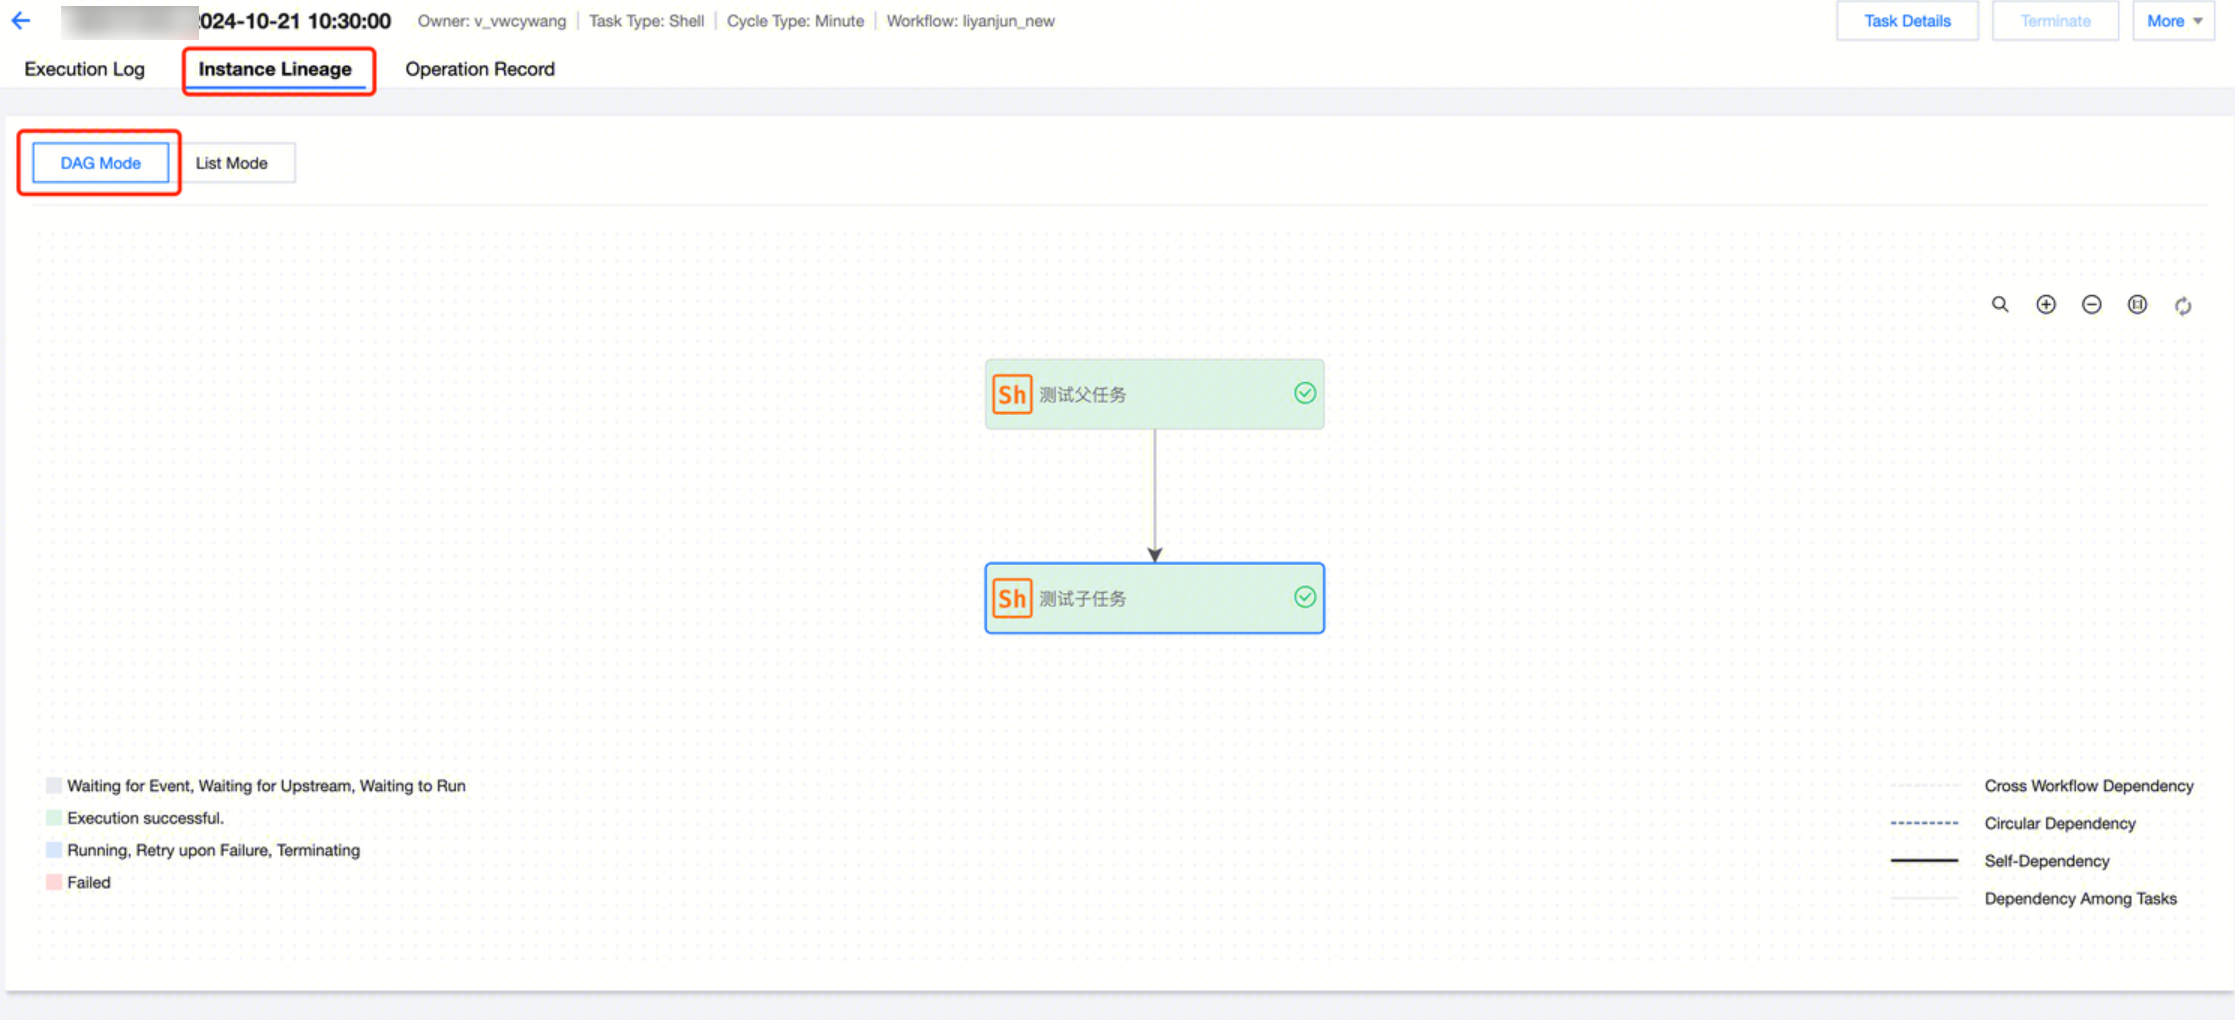
Check the lineage | Navigate to the instance details page > instance lineage, where you can view the upstream and downstream relationships of the instance. It supports simple information viewing and operations in the DAG chart. |
Terminate | Effective only for cycle instance statuses "Waiting for Event," "Waiting for Upstream," "Waiting to Run," and "Running." After terminating the instance, the corresponding instance will cease running, and the execution status will be set to "Failed." |
Rerun | Effective only for cycle instances with status "Failed," "Success," "Pending Execution," or "Failed Retry." After rerunning the instance, the corresponding task instance will be re-executed. Rerunning an instance may affect upstream and downstream dependencies, event listening, and other scheduling policies, so relevant configuration items need to be set when rerunning. Rerun Instance Range: Three rerun methods are available. Current Instance: Only rerun the currently selected instance This Instance and Downstream Instances: Rerun the currently selected instance and downstream task instances Downstream Instances: Only rerun the downstream task instances of the currently selected instance Downstream Instance Range: If rerun instance range is set to "This Instance and Downstream Instances" or "Downstream Instances," you can specify the range of downstream instances. Includes: Related Workflow: Downstream instances in the current workflow Related Project: Downstream instances in the current project All Projects: All downstream instances Specified Instance: User-defined downstream instance range Ignore Events: When the computing task configuration of the instance to be rerun involves event listening, you can choose whether to ignore event trigger conditions during the instance rerun. Check Parent Task: Check the direct upstream parent task of the selected instance. Choose whether to check the instance of the previous cycle of the selected instance, as determined by the settings in scheduling configuration > self-dependency. |
Mark as Successful | Effective only for cycle instance statuses "Running," "Failed," "Waiting for Event," "Waiting for Upstream," and "Waiting to Run." After setting the instance to success, the execution status of the corresponding task instance will be set to "Successful." |
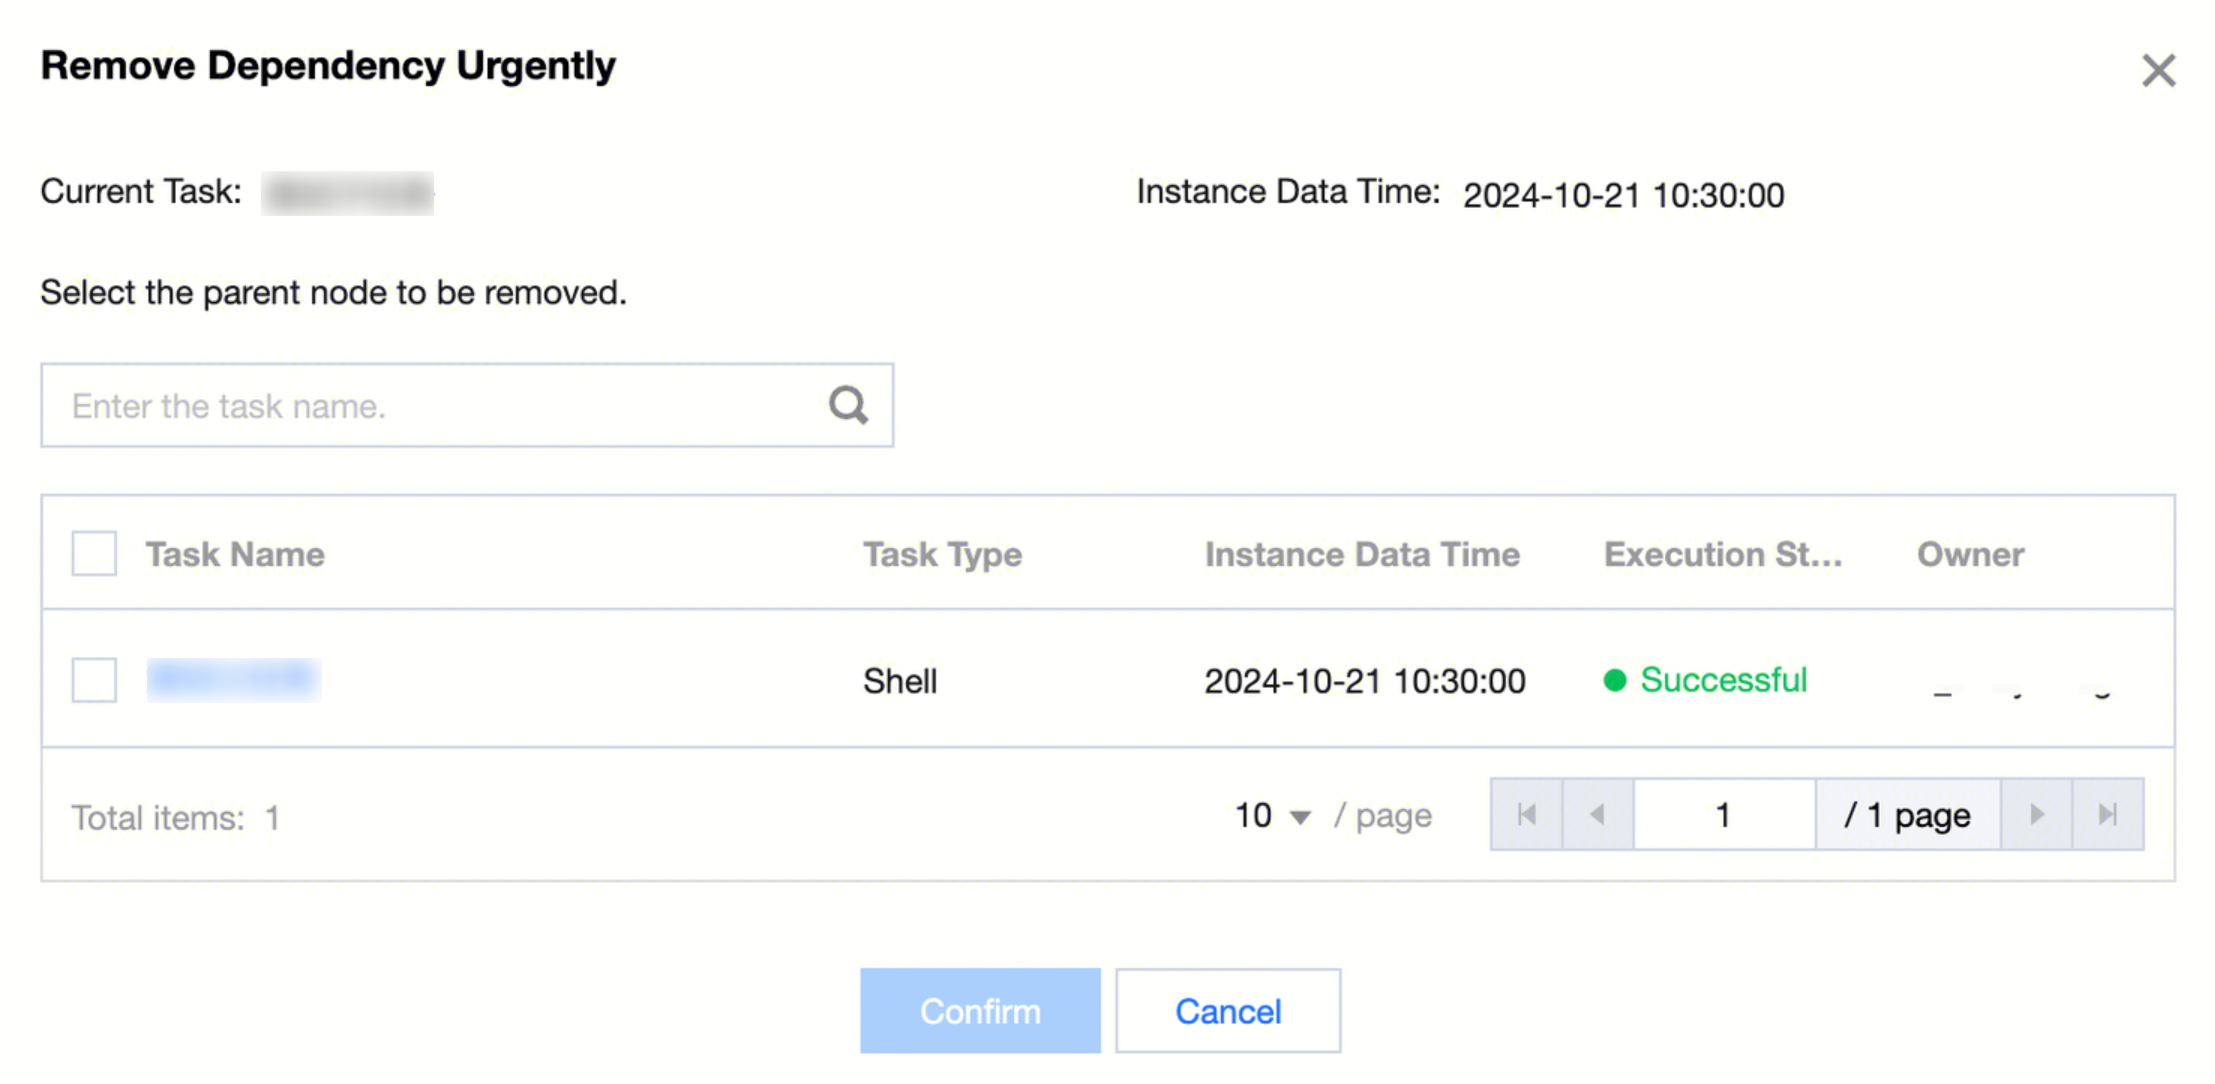
Remove Dependency Urgently | This operation can remove the dependency relationship of the instance, used in urgent scenarios where the upstream instance has not reached a successful status, affecting the execution of downstream instances. When the user determines that the upstream instance impact on the current instance is minimal, they can perform urgent dependency removal to remove the dependency relationship between the corresponding upstream and current instance, ensuring the current instance can execute normally. This operation only takes effect on the current instance and does not affect the dependencies of previous and subsequent instances. This operation is irreversible, meaning subsequent reruns and backfills for this instance will not check the removed dependency. Dependencies can be partially removed as needed. Removed dependencies will still be displayed in the instance DAG graph with special markings for user distinction. |
Task Development | Navigate to the compute node configuration interface of the corresponding cycle instance in the orchestration space. This is a quick access channel for instance operation and maintenance to the compute task node editing. |
Periodic Instance Filtering & List Operations
|
Filter options - Above the list | Support filtering by task name/ID, instance data time, start time, person in charge, and folder. |
Filter options - Within the list | Support filtering by execution status, instance type, belongs to workflow, task type, execution resource group, and cycle type. |
List Operation | Refresh: You can refresh the latest status of the cycle instance list. It is generally used to check the instance running status after operating on cycle instances, helping users easily obtain the latest operation and maintenance information. Download: You can download data from the current instance list. Currently, only instances generated before the current day's midnight can be downloaded. List Configuration: Supports adjusting the fields and field order displayed in the current list. |
Periodic Instance Details Page
Instance details page gathers all running history, operation status, instance lineage, operation records, and basic instance operations. It helps users monitor and maintain instances.
|
Execution Log | View the full process of each execution after the instance is generated, including waiting events/upstream, pending execution, start time of running, end time, time consumption, specific situation, execution logs, and execution code. Execution List: The rightmost side is the record list of each instance execution; every periodic scheduling, rerun, first execution or retry of a supplementary entry, is recorded as one execution. Execution Information: Each execution's basic condition can be viewed in three stages: waiting events/upstream, pending execution, and task running Waiting Events/Upstream: Display the direct upstream instances/events list and their statuses, facilitating quick identification of blocking instances/events. Pending Execution: Waiting to be dispatched to the execution engine. Task Running: Already dispatched to the execution engine and began execution; execution logs and execution code can be viewed. The execution information of the For-each section displays the traversal list. Click on a traversal to view the instance DAG diagram for that traversal. In the instance DAG diagram, right-click on a node > Viewing Logs to enter the sub-node instance and view its operating condition and logs.
On the sub-node instance details page, you can view the running code and execution log.
|
Instance Lineage | View the upstream and downstream relationships between the current compute task instance and other compute task instances within its workflow, and it also displays the running state and detailed information of each compute node, with different colors indicating the instance's running state. DAG Mode: View instance lineage through graph mode, which can be expanded layer by layer. Basic instance operations are supported. List Mode: View instance lineage through list mode, with options to view upstream or downstream. |
Operation Records | View the operation records of the instance, including: setting success, termination, rerun, and other operation details such as the operator and operation time. |
Event Instances List
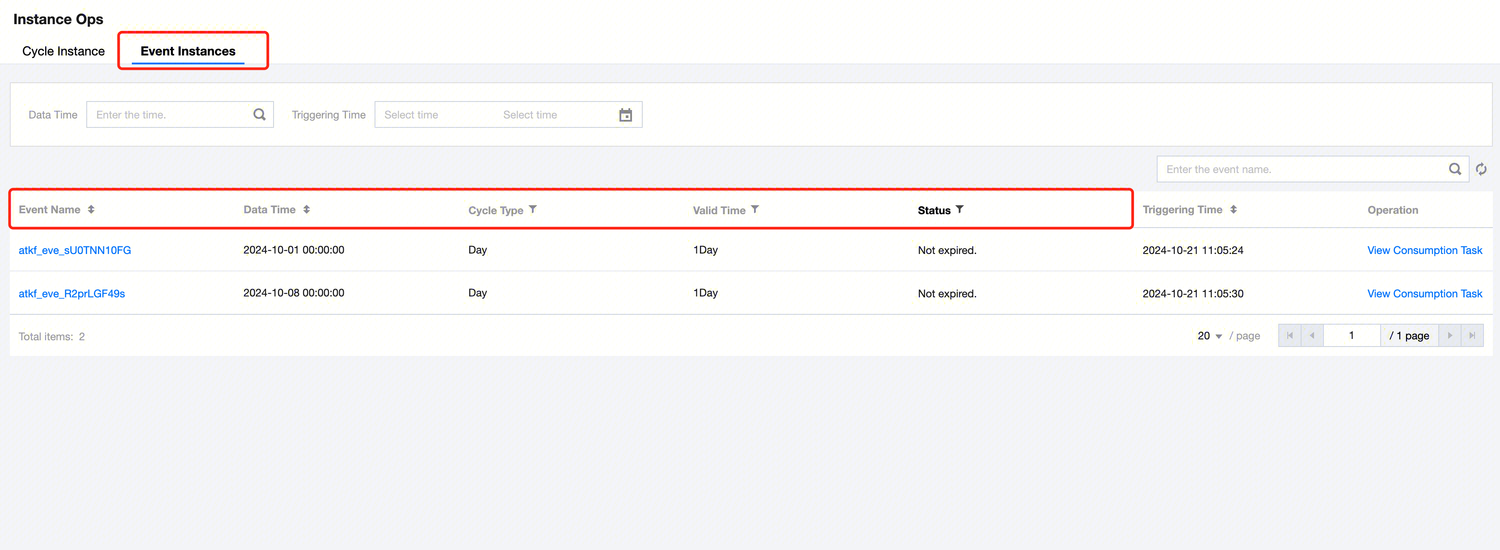
The event instance page displays event instance information and operation features generated after listening events configured by the scheduling policy are triggered. You can view the consumption status, trigger time, consumption time, and other information of the event. It is also possible to view the detailed information of the instance and the consumption tasks.
Event Instances List Information
Feature Description:
|
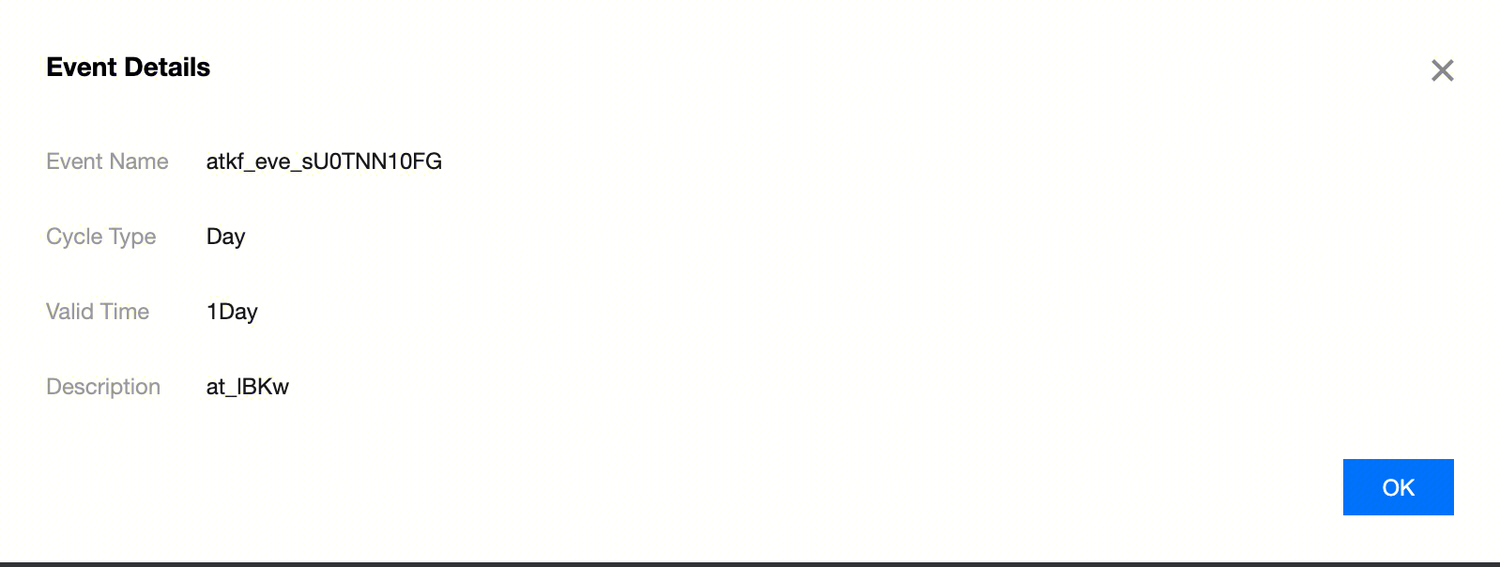
Event Name | Displays the name of the event listener that triggered the event instance. Click Event Name to view the detailed information of the corresponding listening event, including cycle type, time format, validity period, and description information. |
Data Time | Displays the scheduled time of the task instance that triggered the event instance. |
Cycle Type | Displays the trigger cycle type of the event instance, including days, hours, minutes, and seconds. |
Valid time | Displays the preset event wait time in the scheduling configuration of the computing task that triggered the event instance. If the event is not triggered within this time, the task instance will automatically terminate. |
Status | Displays the consumption status of the event instance, including pending consumption, consuming, consumed, and expired. |
Triggering time | Displays the date and time of the event instance trigger. |
Event Instances Operations
|
View Consumption Task | Click View Consumption Task under the event instance list to view the information of the computing task that triggered the event instance. |
Event Instances Filter
|
Filter options - Above the list | You can filter by data timestamp, trigger time, and event name. |
Filter options - Within the list | You can filter by cycle type, validity period, and status. |


