Overview
The Cloud Monitor module of TencentCloud Managed Service for Prometheus (TMP) integrates the basic monitoring data of Tencent Cloud products, and implements unified collection, storage, and visualization through TMP.
Note:
Data collection interval: 1 minute. Currently, smaller collection intervals are not supported.
Monitoring data granularity: 1 minute. If a metric does not support the 1-minute granularity, you can select the 5-minute granularity.
The integrated monitoring data includes tag data (not supported by some cloud products) of cloud products. The tag key should conform to the regular expression [a-Za-Z_][a-Za-Z0-9_]*. Otherwise, it will be filtered out.
Multi-region is not supported. If cloud products are distributed in multiple regions, multiple integration modules need to be installed.
Operation Steps
2. Select and enter the corresponding Prometheus instance from the instance list.
3. On the instance details page, select Data Collection > Integration Center.
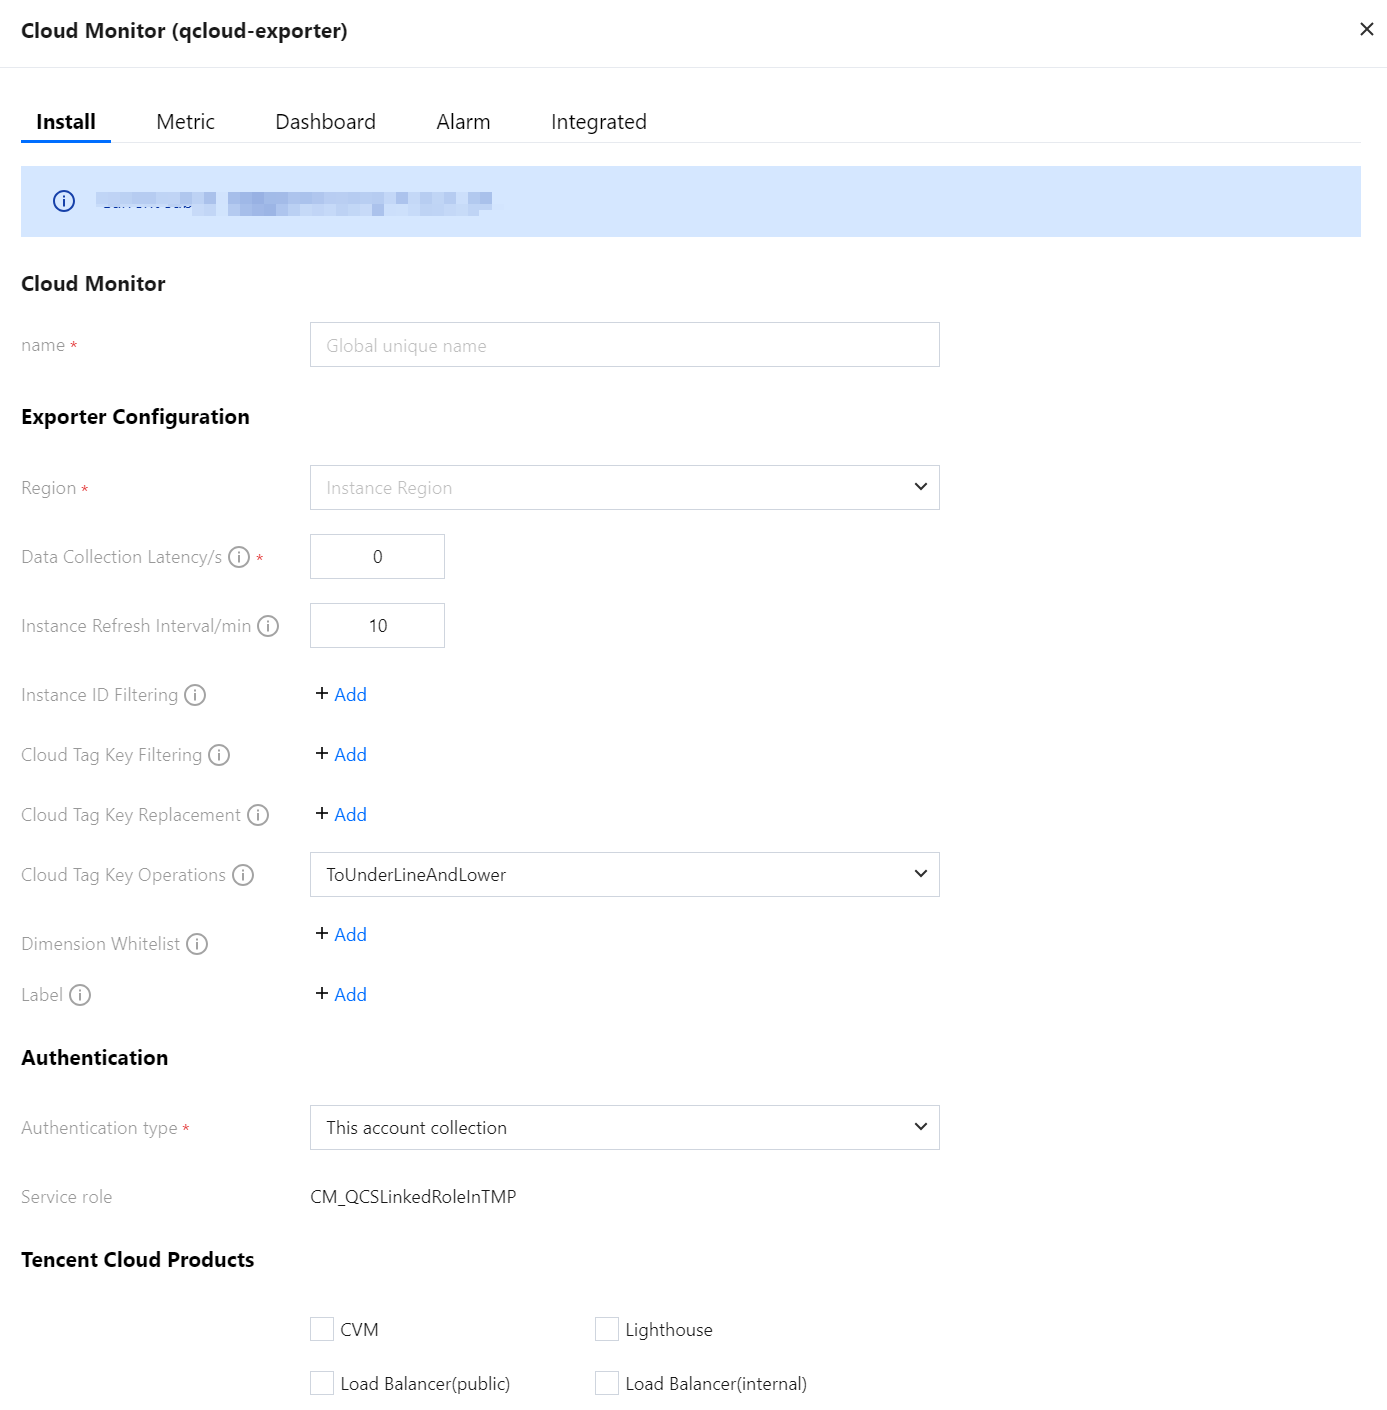
4. On the Integration Center page, click Cloud Monitor to enter the installation tab by default. Define the integration name, configure Exporter, and select the corresponding cloud product.
Configuration Instructions
|
name | Exporter name, which should meet the following requirements: The name should be unique. The name should conform to the following regular expression: '^[a-z0-9]([-a-z0-9]*[a-z0-9])?(\.[a-z0-9]([-a-z0-9]*[a-z0-9])?)*$'. |
Region | Required. Region where the cloud product is located. If the cloud product does not distinguish regions, enter any region. |
Data Collection Latency | Unit: second. If it is set to 0, the timestamp of the original data will be ignored. If it is set to a value greater than 0, the timestamp of the original data will be reported. Since there is a certain delay in reporting cloud product monitoring data to basic monitoring, this delay will be reflected in the latest data. Data pulling range: (Current time - Data collection delay - Fixed interval, Current time - Data collection delay). |
Instance Refresh Interval | Unit: minute. The minimum value is 10. At each instance refresh interval, the integration module will re-pull cloud product instance information. If the instance name or cloud tag is modified or an instance is added or deleted, the monitoring data will be updated within one instance refresh interval. |
Instance ID Filtering | Optional. If it is left blank, data will be collected from all instances under the root account by default. Enter a value in the form of the key-value pair, where the key is the unique ID of the cloud product defined by the integration module, and the value is a list of comma-separated cloud product instance IDs. Only data of the instances of the cloud products specified in the key-value pair form will be collected. |
Cloud Tag Key Filtering | Optional. Enter a value in the form of the key-value pair, where one tag key can correspond to multiple tag values that are separated by |. Take the intersection of different tag keys and take the union of multiple tag values under the same tag key. For products that support cloud tag filtering, if instance ID filtering is also configured, cloud tag filtering for that product will not take effect. |
Cloud Tag Key Replacement | Optional. Replace illegal cloud product tag keys with valid values. For example, convert Chinese names into custom English names. |
Cloud Tag Key Operations | By default, the integration module converts uppercase letters in tag keys into underscores followed by lowercase letters. It supports the conversion of tag keys of cloud products. ToUnderLineAndLower: default operation. ToLower: full conversion to lowercase letters. NoOperation: no conversion. |
Dimension Whitelist | Optional. Some cloud products have dimensions with the same indicator name and features that need to be whitelisted. By default, collection is not performed, but it can be enabled through this configuration. lb_public:listener: Cloud Load Balancer (public network) - Listener dimension. lb_public:target: Cloud Load Balancer (public network) - Real server dimension. lb_public:domain: Cloud Load Balancer (public network) - Forwarding rule domain name dimension. lb_private:listener: Cloud Load Balancer (private network) - Listener dimension. lb_private:domain: Cloud Load Balancer (private network) - Forwarding rule domain name dimension. apigw_cloudnative:node: Cloud Native Gateway - Node dimension. vbc:qosid: Cloud Connect Network - Scheduling queue dimension. |
Label | Optional. You can add additional custom tags to the metrics collected by the integration module. |
Authentication | Service role: Configure for collection within this account. Fixed as CM_QCSLinkedRoleInTMP. This account role: Configure for cross-account collection. Custom role used to obtain a temporary key for this account. Target account role: Configure for cross-account collection. Custom role used to obtain a temporary key for the target account. Target account uin: Configure for cross-account collection. Root account ID of the target account. |
Tencent Cloud Products | Select the cloud product you want to collect. |
Metric Relabel | Optional. Native metricRelabelings configuration for Prometheus Operator. The configuration method is the same as metric_relabel_configs in Prometheus scraping configuration, with only some field naming conventions being different. |
Metric Relabel Configuration Examples
The common metricRelabelings examples are as follows:
metricRelabelings:
- action: labeldrop
regex: labelA
- regex: ins-(.*)
replacement: $1
sourceLabels:
- instance_id
targetLabel: id
- targetLabel: region
replacement: ap-guangzhou
- action: drop
sourceLabels:
- __name__
regex: metricA|metricB
Supported Cloud Products
|
| Yes | cvm | Only metrics at the instance dimension are supported. |
| Yes | cbs | - |
| Yes | lb_public | By default, metrics at the instance dimension are collected. If metrics at the listener, forwarding rule domain name, or backend server dimension are required, submit a ticket. The names of metrics at different dimensions are the same name, which can be distinguished by the monitor_view tag. Instance dimension: instance. Listener dimension: listener. Backend server dimension: target. Forwarding rule domain name dimension: domain. |
| Yes | lb_private | By default, metrics at the instance dimension are collected. If metrics at the listener or forwarding rule domain name dimension are required, submit a ticket. The names of metrics at different dimensions are the same name, which can be distinguished by the monitor_view tag. Instance dimension: instance. Listener dimension: listener. Forwarding rule domain name dimension: domain. |
| Yes | cmongo | - |
| Yes | cdb | - |
| Yes | redis | - |
| Yes | redis_mem | Metrics at the instance and node dimensions are supported. |
| Yes | mariadb | Only metrics at the instance dimension are supported. |
| Yes | postgres | - |
| Yes | tdmysql | Only metrics at the instance dimension are supported. |
| Yes | cynosdb_mysql | Only metrics at the instance dimension are supported. |
| Yes | sqlserver | Only metrics at the instance dimension are supported. |
| Yes | nat_gateway | - |
| Yes | ckafka | Metrics at the broker_ip dimension are not supported. |
| Yes | lb | - |
| Yes | vpngw | - |
| Yes | vpnx | - |
| Tags are not supported. | vpc_net_detect | - |
| Yes | cdn | It does not distinguish by region. |
| Yes | ov_cdn | It does not distinguish by region. |
| Yes | cos | Storage-related metrics have a high delay (about 2 hours), and the original timestamp of the data is not retained. Storage-related metrics do not support the 1-minute granularity. By default, 5-minute data is pulled. |
| Yes | dc | It does not distinguish by region. |
| Yes | dcx | It does not distinguish by region. |
| Yes | dcg | They are the same as the VPC, network connection, and DC gateway. |
Lighthouse | Yes | Lighthouse | - |
Cloud-native API gateway | Yes | apigw_cloudnative | By default, metrics at the instance and public network CLB dimensions are collected. If metrics at the node dimension are required, submit a ticket. The names of metrics at the instance and node dimensions are the same name, which can be distinguished by the monitor_view tag. Instance dimension: gateway. Public network CLB dimension: loadbalancer. Node dimension: node. |
| Yes | ces | Only metrics at the instance dimension are supported. |
Tencent Cloud TCHouse-D | Yes | cdwdrs | - |
Data Transmission Service | Yes | dts | Kafka-related dimension metrics are not supported. |
| Yes | vbc | - |
| Yes | gaap | - |
| Yes | edgeone_l7 | - |
| Yes | waf | - |
| Yes | cfs | Currently, no metadata-related metrics are collected. |
| Yes | bwp | - |
| Yes | scf_v2 | By default, metrics at the alias dimension are collected. If metrics at the version dimension are required, submit a ticket. The names of metrics at the alias and version dimensions are the same name, which can be distinguished by the monitor_view tag. Alias dimension: alias. Version dimension: version. |
| Yes | cls | - |
| Yes | apigateway | Only metrics at the API dimension are supported. |
Metric Description
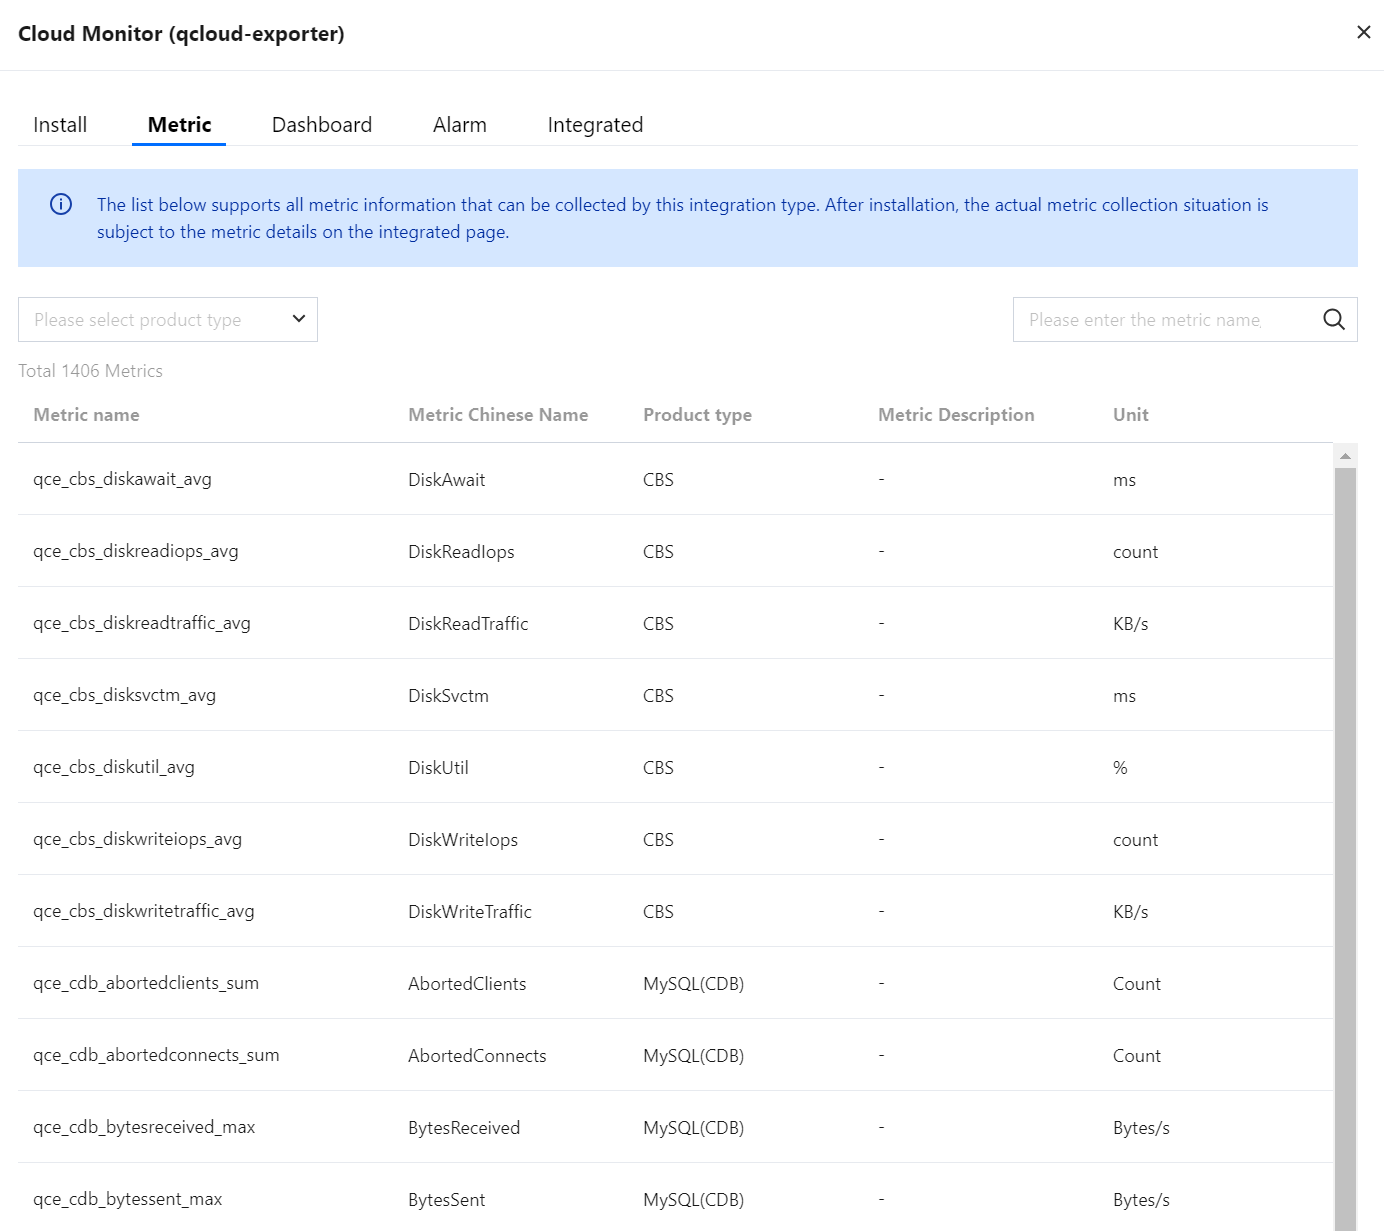
To distinguish metrics of different cloud products, Cloud Monitor integrates and converts the metric names (metric English names in the metric documentation) of cloud products. The metric page provides information on metrics supported by Cloud Monitor integration, making it convenient for users to directly view and use.
Cross-Account Collection
Note:
Cross-site collection is not supported (Chinese mainland site accounts and international site accounts cannot collect data from each other).
Scenario: Account A collects monitoring data from Account B through cross-account collection.
Configuration entries:
Create a Cloud Monitor integration in the Prometheus monitoring service instance under account A.
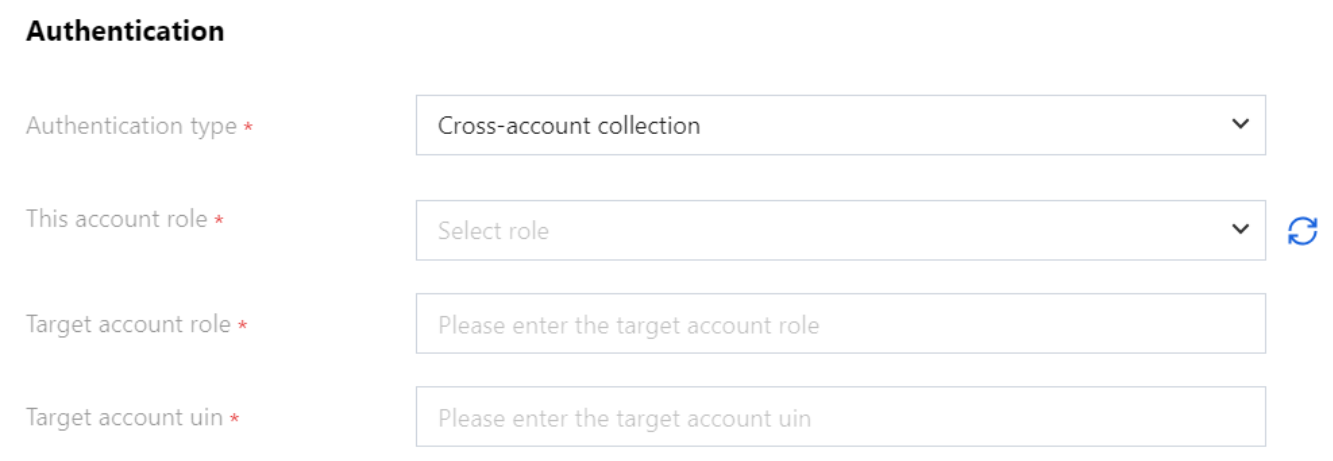
Select Authentication type as Cross-account collection.
Select This account role as the custom role created by Account A.
Enter the custom role created by Account B in Target account role.
Enter the root account ID of Account B in Target account uin.
Brief Flowchart
Creating Custom Roles
Account A Users Creating Custom Roles
1. On the Policies page, create a Custom Policy using policy syntax, and add the sts:AssumeRole permission, which is used to assume the role of account B. The policy syntax is as follows: {
"version": "2.0",
"statement": [
{
"effect": "allow",
"action": ["sts:AssumeRole"],
"resource": ["*"]
}
]
}
Note:
If you need to limit permissions, such as only assuming a custom role of Account B, you can modify resource to "qcs::cam::uin/[Root account ID of Account B ]:roleName/[Custom role of Account B]".
2. On the Roles page, click Create Role. 3. In the pop-up window for selecting the role entity, choose Tencent Cloud Product Service to enter the role information page.
4. Check Cloud Virtual Machine (cvm) as the role entity, select Cloud Virtual Machine as the use case, and click Next.
5. In the policy list, select the policy created in Step 1 as the role configuration policy, and click Next.
6. Tag the role with tag keys and tag values, which can be left blank, and click Next.
7. Enter your role name and click Complete to finish creating the custom role.
Account B Users Creating Custom Roles
1. On the role list page, click Create Role.
2. In the pop-up information window for selecting the role entity, choose Tencent Cloud Account as the role entity, and enter the role information page.
3. On the role entity information page, select other root account for Tencent Cloud Account Type, enter the Account A main account ID for Account ID, leave others blank, and click Next.
4. In the policy list, select the preset policy ReadOnlyAccess as the role configuration policy, and click Next.
5. Tag the role with tag keys and tag values, which can be left blank, and click Next.
6. Enter your role name and click Complete to finish creating the custom role.
FAQs
How to Configure "Data Pull Configuration"?
1. If the configuration is 0, Prometheus will use the current timestamp to overwrite the original timestamp of data.
Use case: Ensure the real-timeness of data timestamps to maximize the timely issuance of alarms by Prometheus.
2. If the configuration is a value x greater than 0:
As long as the value is greater than 0, Prometheus will retain the original timestamp of the data.
Use case: Keep the timestamps consistent with those on the console monitoring page.
Time window for delayed data pulls (latency equals x).
Background: To be compatible with the latency of monitoring data reporting links of cloud products, Prometheus pulls data within the time range of (now-fixed latency, now) by default.
Use case: If the reporting link latency of certain products is too high, set x here to change the time range for pulling data to (now-fixed latency-x, now-x), to ensure that data can be retrieved to the greatest extent possible within this delayed window.
Are There Issues with Targets Display?
No collection objects: A newly-created integration needs to wait for a few minutes before displaying the correct targets.
(1/2)down: Because the integration uses rolling update, it will continue to collect from the old pod until the new pod runs successfully. During that period, two targets will be displayed.
Certain Cloud Product Failed to Collect Metrics
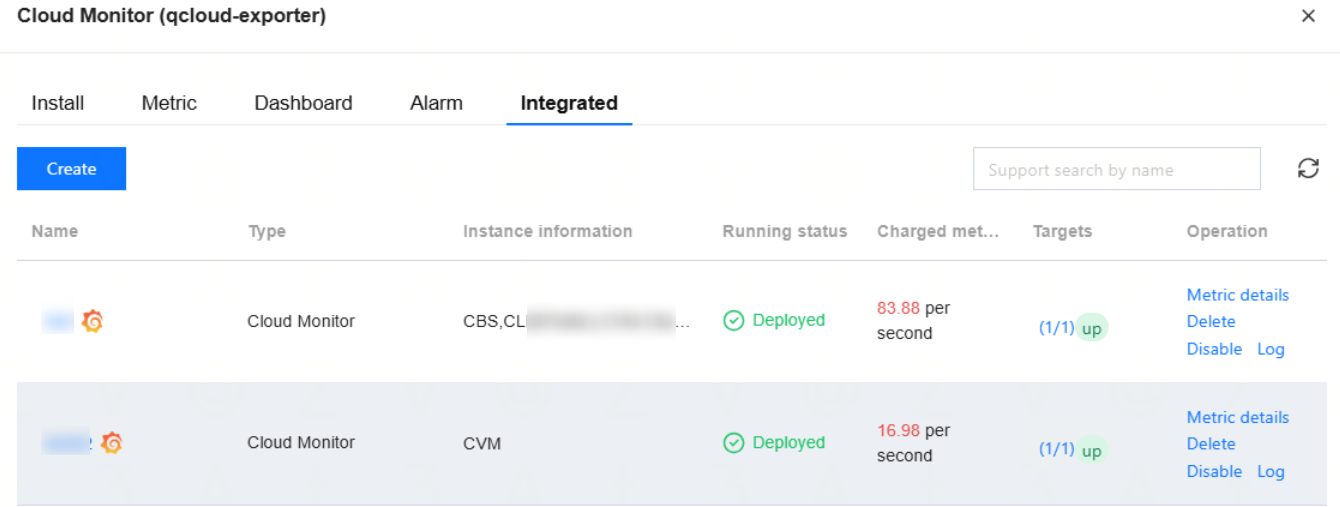
On the Integrated tab, you can check the following information:
Instance information: Check whether it contains the cloud product. If not, it means the cloud product was not selected.
Ensure that Targets are in up status.
Metric details: Check whether there are metrics for the cloud product. If there is, wait for a minute before querying again.
Ensure that there are cloud product instances in the selected region.
Check whether Instance ID Filtering or Cloud Tag Key Filtering is configured, and confirm that the corresponding configuration can help obtain the cloud product instance.
Check whether Metric Relabel is configured, and ensure that the corresponding configuration does not filter out the cloud product metrics.
Viewing Monitoring Information
Prerequisites
The Prometheus instance has been bound to a Grafana instance.
Operation Steps
1. Log in to the TMP console and select the corresponding Prometheus instance to enter its management page. 2. Click Data Collection > Integration Center, on the Integration Center page, find and click Cloud Monitor, select Dashboard > Dashboard operation > Install/Upgrade in the pop-up window to install the corresponding Grafana Dashboard.
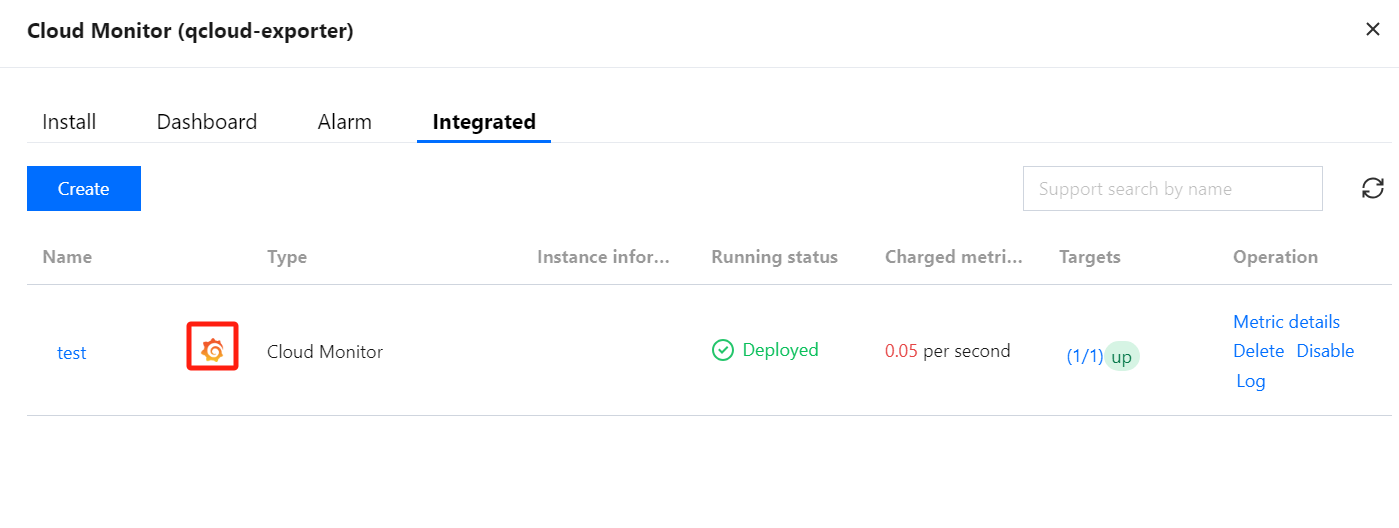
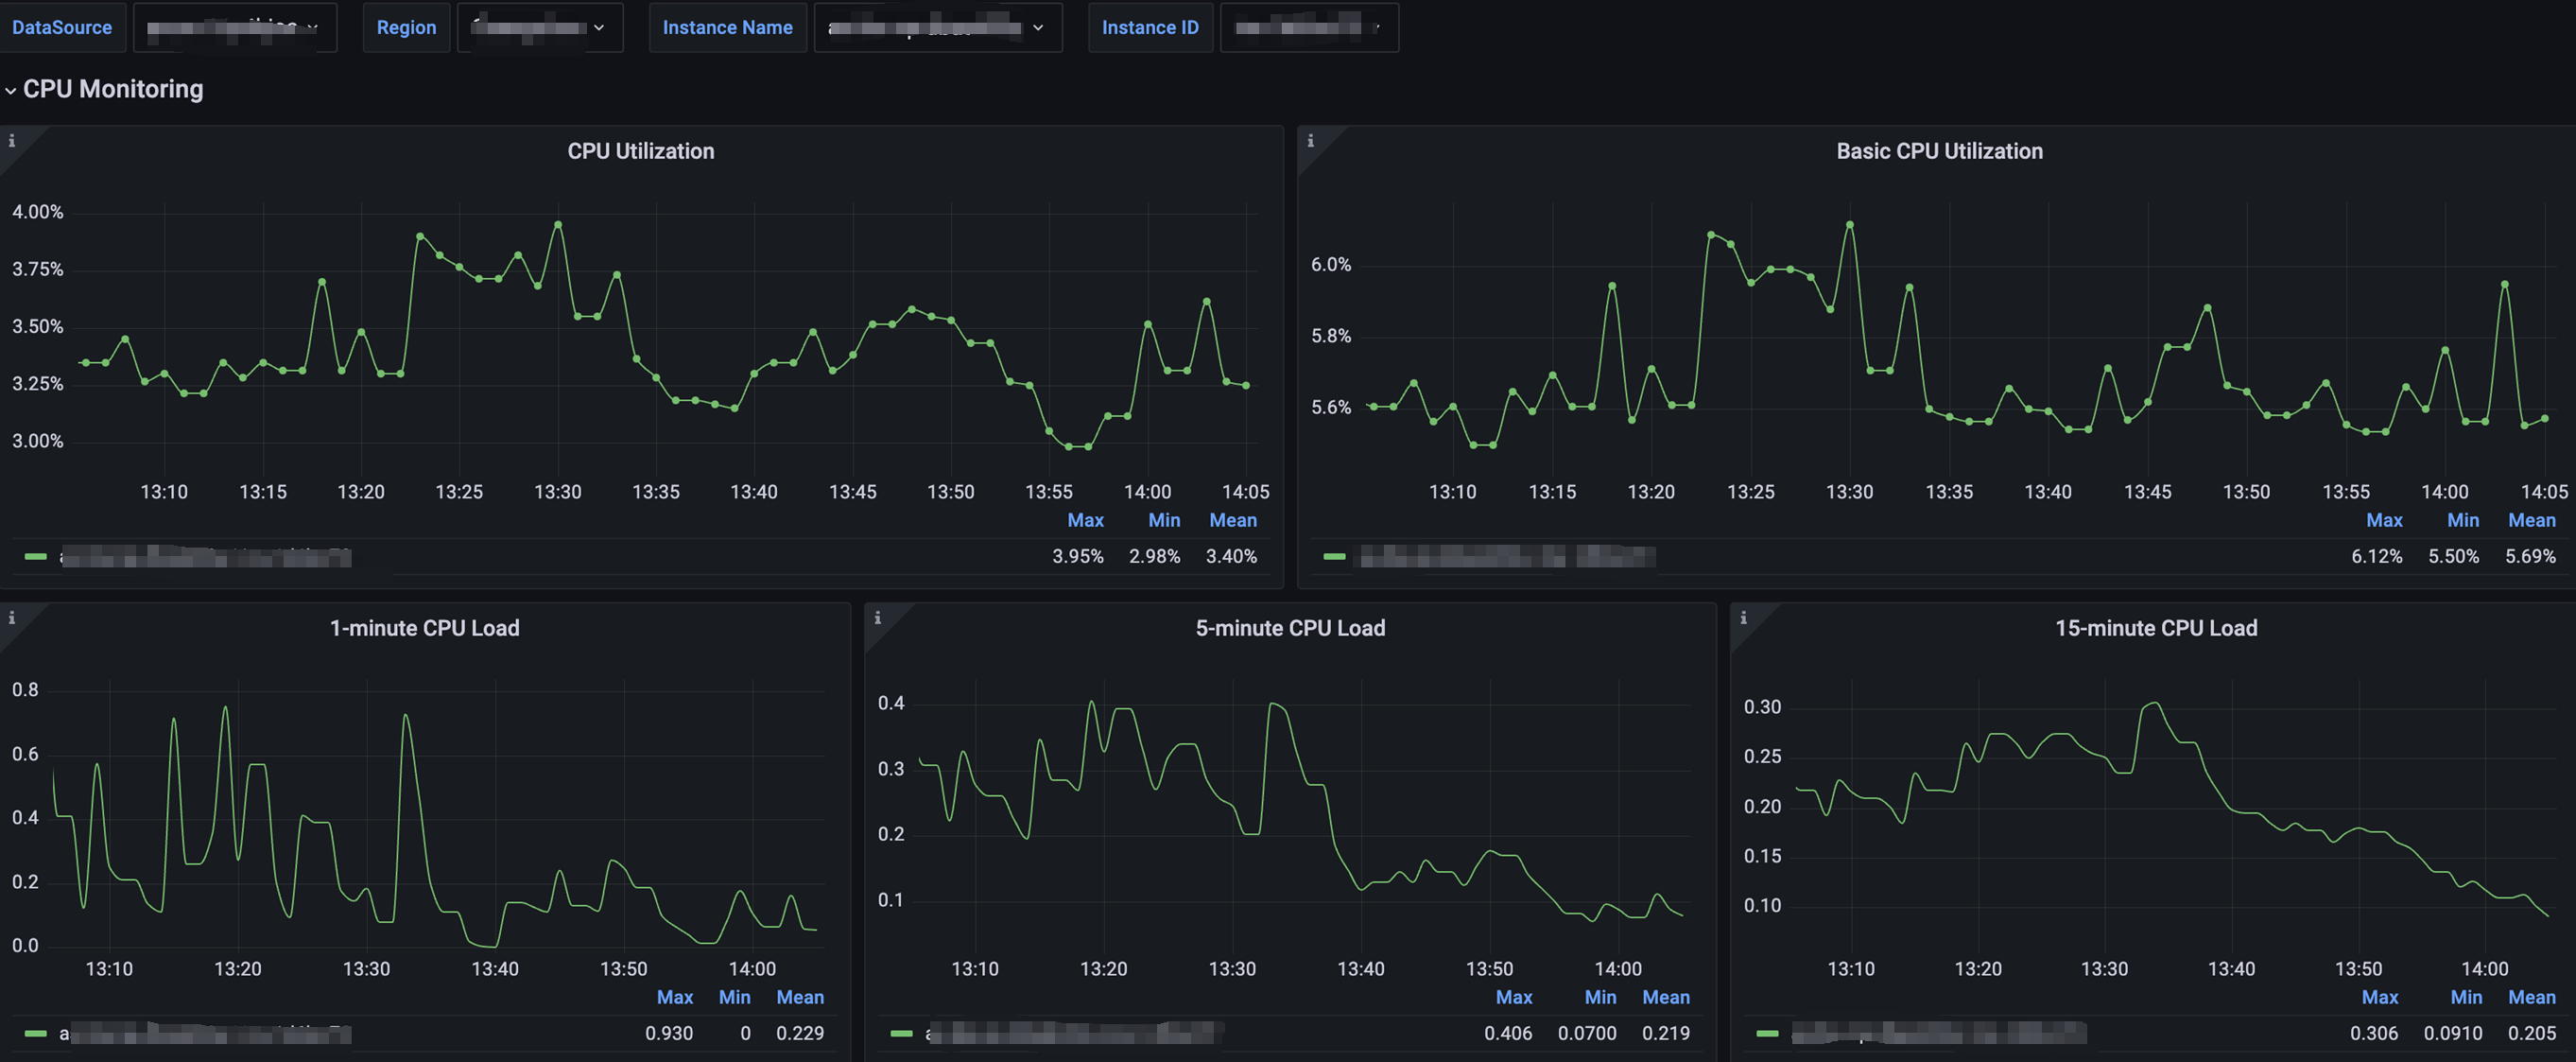
3. Select Integrated. In the integrated list, click the Grafana icon to automatically open the list of Cloud Monitor integrated dashboards. Select the corresponding cloud product dashboard to view monitoring data related to the instance, as shown below.


